Last week, the cryptocurrency market continued to exhibit a volatile trend. Bitcoin experienced a staged rebound after a quick decline in the early phase; however, from the perspective of overall structure and trading volume, the current market remains in a weak-range oscillation phase, and the medium-term trend has not fundamentally changed.
In such a market environment, we continue to execute strategies strictly according to the established trading system: on the one hand, we continuously track the evolution of the HYPE wave III main upward structure, while on the other hand, we conduct short-term price spread trading and mid-line position management around the oscillation pattern of BTC.
This week's weekly report will systematically review and analyze the market structure from last week, trading performance, and possible market evolution paths this week, and provide corresponding trading strategy references.
Weekly Trading Report Core Summary:
• In-depth deconstruction of the multi-cycle trends of HYPE: weekly tracking. (See detailed information in the first part)
• Verification of short-term trading effectiveness of HYPE: HYPE completed a short-term long position operation last week (1x leverage), successfully realizing a profit of approximately 18.44%. (See Table 1)
• Verification of BTC strategy execution (short-term) effectiveness: Bitcoin adhered to the established short-term strategy last week, completed a short-term short position operation (1x leverage), successfully achieving a profit of approximately 2.01%. (See Table 2)
• Verification of BTC strategy execution (mid-term) effectiveness: Bitcoin continued to hold a short position opened at $89,000 (1x leverage) last week, achieving a profit of approximately 18.17% by the end of last week (approximately $72,831), with a maximum profit during that period of about 32.58%.
• Verification of core viewpoint (short-term): Bitcoin continued to maintain a weak-range oscillation pattern last week. The current trend aligns with expectations.
• Forecast of BTC market trend this week and mid- to short-term operational strategies.
1. HYPE: Trend Structure Analysis and Short-term Operation Review
1. Continuous tracking of HYPE market dynamics and investment opportunities
• February 23 Weekly Review: Initially indicating that HYPE may enter an investment window, noting that the market was in the II wave correction stage at that time, predicting that the III wave main upward trend would soon start.
• March 3 Weekly Review: Determining that the low on February 24 at $25.60 could be the starting point of wave III and confirming the trend reversal position.
• March 9 Weekly Review: Indicating that price effectively broke through multiple moving average resistances on the daily chart, subsequently entering a retracement and consolidation phase, which is part of the momentum accumulation process, with expectations of a rapid rise once it concludes.
2. Overview of HYPE daily-level trend structure: (based on the market evolution after January 21)
• Wave I (driving wave): From the low of $20.46 on January 21 to the high of $38.41 on February 3, lasting 14 days, with a maximum increase of 87.73% during this period.
• Wave II (adjustment wave): From the high of $38.41 on February 3 to the low of $25.60 on February 24, lasting 20 days, with a maximum decline of 33.35% during this period.
• Wave III (main upward wave): From the low of $25.60 on February 24 to the present, reaching a new high of $38.85 on March 14, successfully breaking through the peak of wave I at $38.41, thereby confirming the establishment of wave III. As of now, the market has operated for 20 days, achieving a maximum increase of 51.76%, and the main upward trend is continuing.
3. HYPE hourly-level subdivision structure: (based on market trends after March 8)
HYPE_60-minute K-line chart
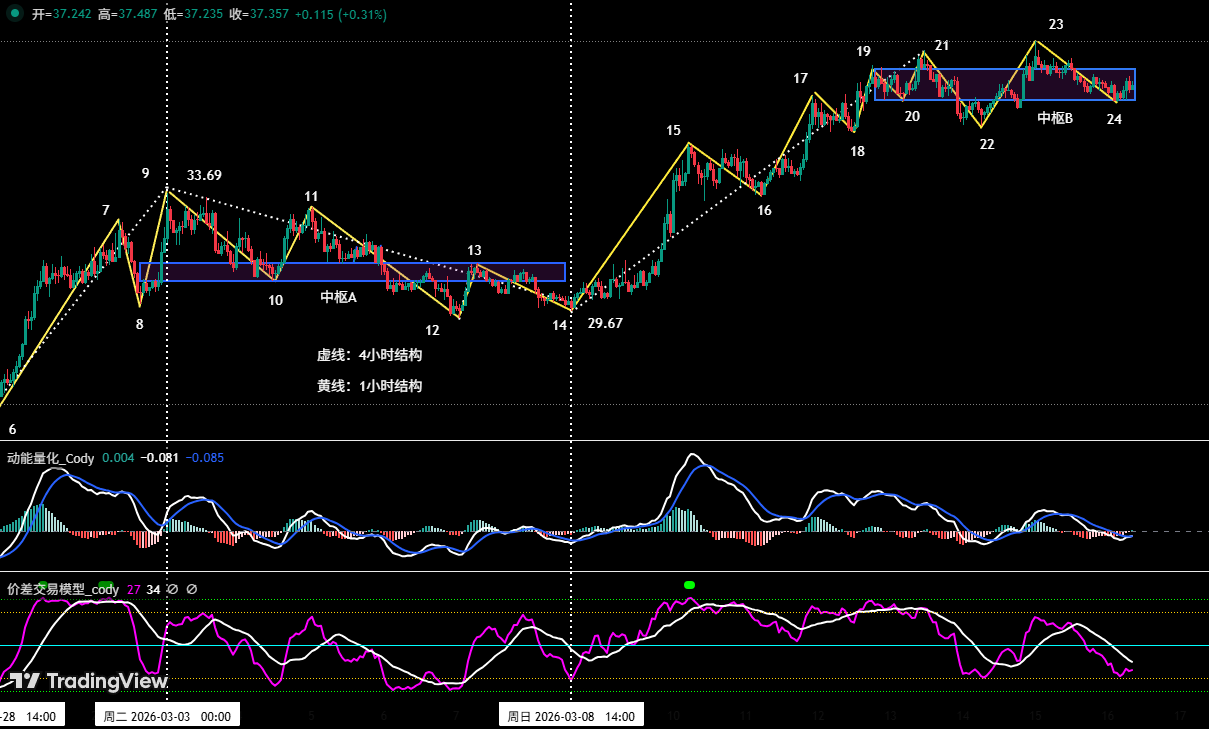
Chart 1
• Review of HYPE hourly-level trend structure (March 2 - March 8): In the March 9 Weekly Review, we analyzed that the hourly-level adjustment starting on March 2 could be divided into five segments of the adjustment structure: 9-10, 10-11, 11-12, 12-13, 13-14. Analysis shows that there were significant bottom divergence signals at the entering segment (9-10) compared to the exiting segment (13-14). Therefore, we assessed that the probability of the adjustment concluding at endpoint 14 (approximately $29.67) was quite high.
• The upward movement initiated from the March 8 low (endpoint 14) can be divided into ten segment structures from endpoint 14 to 24. These ten segments (i.e., 14-15, 15-16, 16-17, 17-18, 18-19, 19-20, 20-21, 21-22, 22-23, 23-24) constitute an upward impulse wave. As of the time of analysis, this upward structure continues.
• Central formation: In the latest ten segment structure, five segments, 19-20, 20-21, 21-22, 22-23, 23-24, are constructing an upward central structure.
4. Core viewpoint for this week: The current market is in the wave III trend. After the central formation is complete, the key for subsequent movement lies in observing whether the price can effectively break free from the gravitational pull of that central structure. The probability of maintaining a range oscillation this week is high.
5. HYPE short-term operation review (1x leverage): (March 9 - March 15)
Last week, based on our self-constructed price spread trading model and momentum quantification model, we issued trading signals and, combined with our predictions for the wave III main upward trend, completed a short-term (long position) operation, achieving a successful profit of 18.44%.
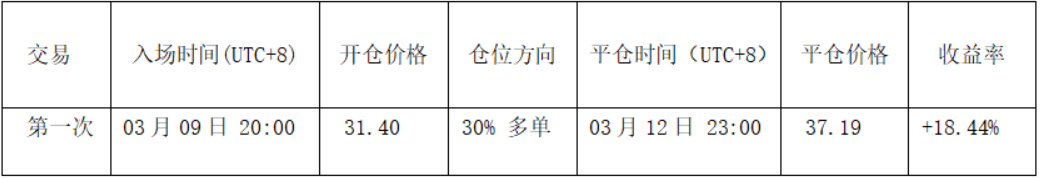
Table 1
• Opening Decision (see Chart 2): This opening decision combined three validations: trend, structure, and quantitative signaling. First, we assessed that the hourly-level adjustment structure had ended at endpoint 14 (approximately $29.67), followed by an effective breakout of the previous resistance at the upper track of the range (approximately $31.33). Meanwhile, based on the bottom resonance signals from the price spread quantitative model and momentum quantitative model, we opened a long position of 30% at $31.40.
• Closing Decision: Based on the top resonance signals from the price spread quantitative model and momentum quantitative model, and the price approaching the peak of wave I at around $38.41, we closed all positions near $37.19.
• Trading Summary: This operation successfully captured the upward opportunity of wave III, achieving a profit of approximately 18.44%.
HYPE_60-minute K-line chart
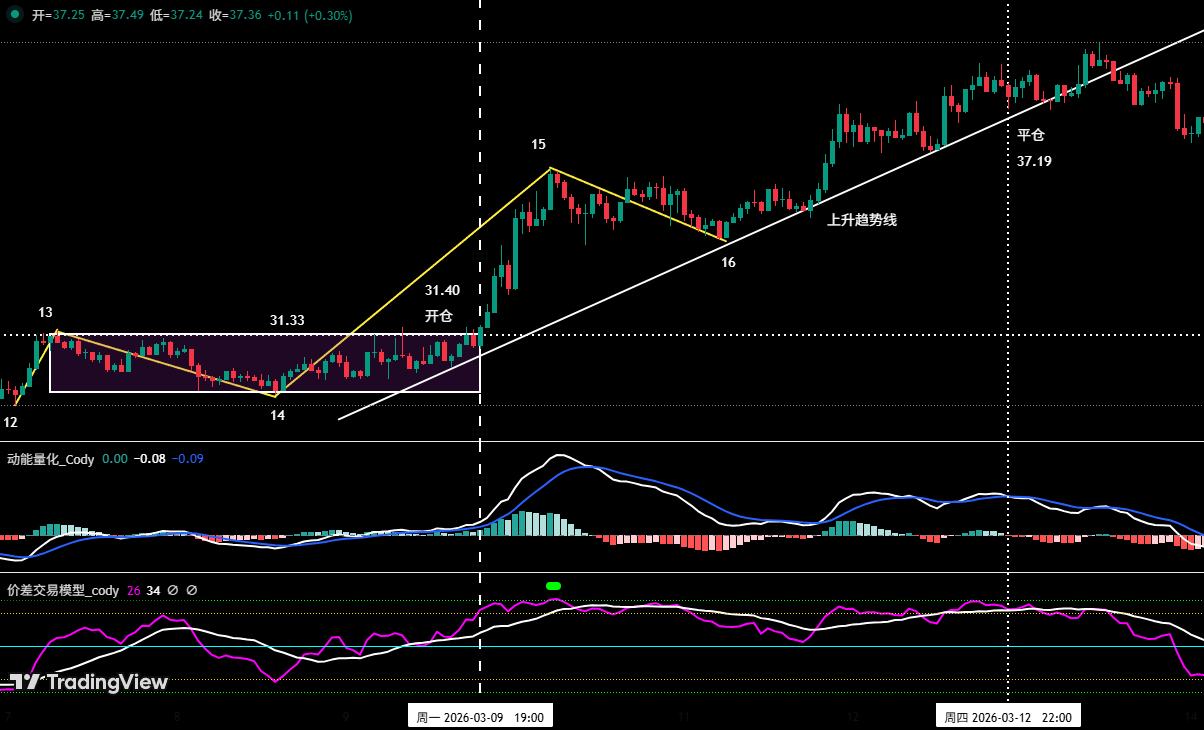
Chart 2 (short-term trading illustration)
2. Bitcoin: Trend Structure Analysis and Long-Short Operation Review
1. Short-term operation strategy review: (see Table 2)
We strictly followed the trading signals issued by our self-constructed price spread trading model and momentum quantification model, and combined with our market trend predictions, completed a short-term (short position) operation last week, realizing a profit of 2.01%.
① Summary of Bitcoin short-term trading details: (Leverage * 1x)
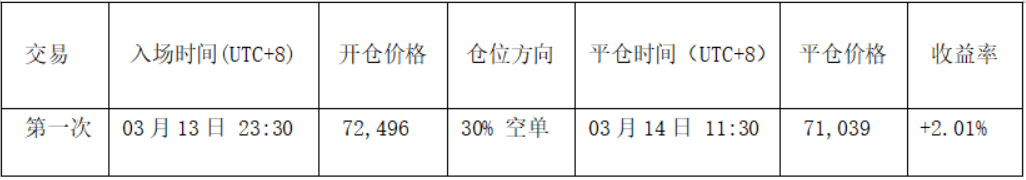
Table 2
② Short-term trading review: (see Chart 3)
• Opening: When the coin price rebounded near $74,500 and encountered resistance, the price spread trading model triggered a strong top warning signal (green dot in the chart), and the two major models provided a short resonance signal, so we established a 30% short position at $72,496.
• Closing: When it fell near $70,500, the price spread trading model triggered a bottom warning signal (red dot in the chart), so we closed all positions near $71,039.
Bitcoin 30-minute K-line chart: (momentum quantification model + price spread trading model)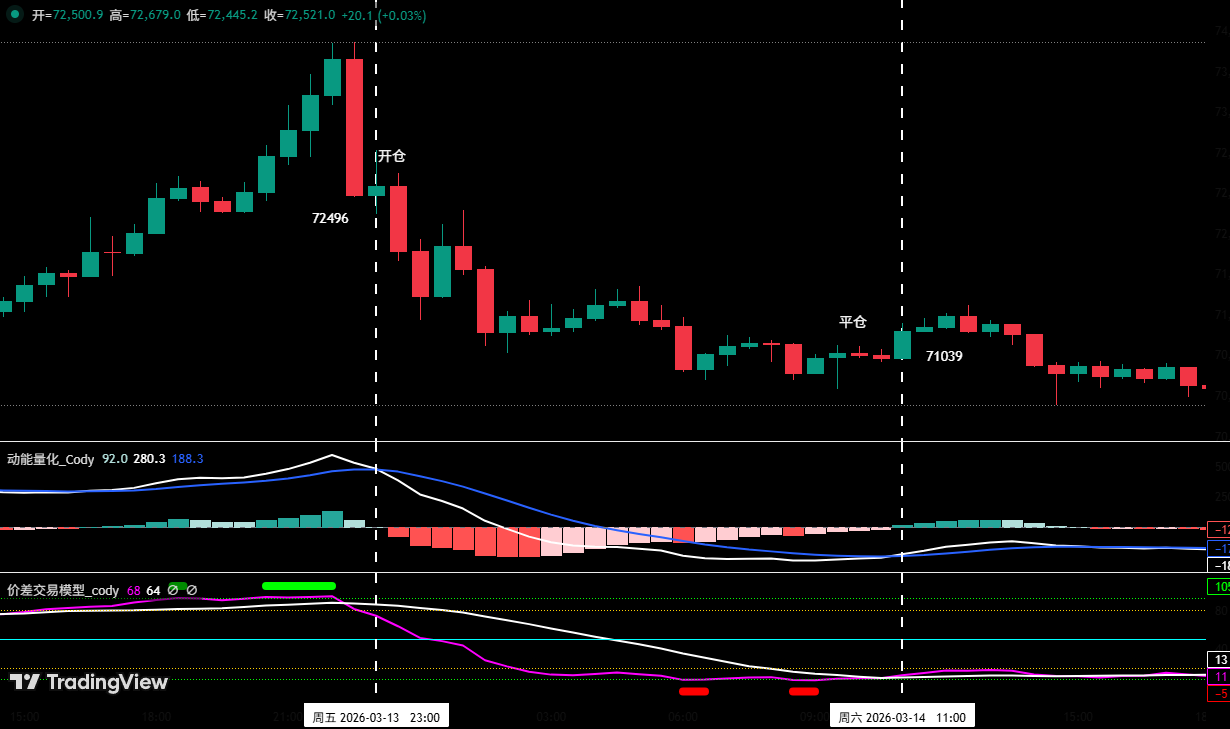
Chart 3 (short-term trading illustration)
2. Mid-line operation strategy review:
Mid-line strategy: We continue to hold a 60% short position opened near $89,000 (January 28), achieving a profit of approximately 18.17% by last week’s after-hours (closing price around $72,831).
3. Bitcoin: Weekly and Daily Technical Indicator Analysis
In conjunction with market operations, the author, based on his self-constructed trading system, deeply analyzes various technical indicators of Bitcoin from multiple models and dimensions.
1. Weekly-level analysis, as shown in (Chart 4):
Bitcoin weekly K-line chart: (momentum quantification model + sentiment quantification model)
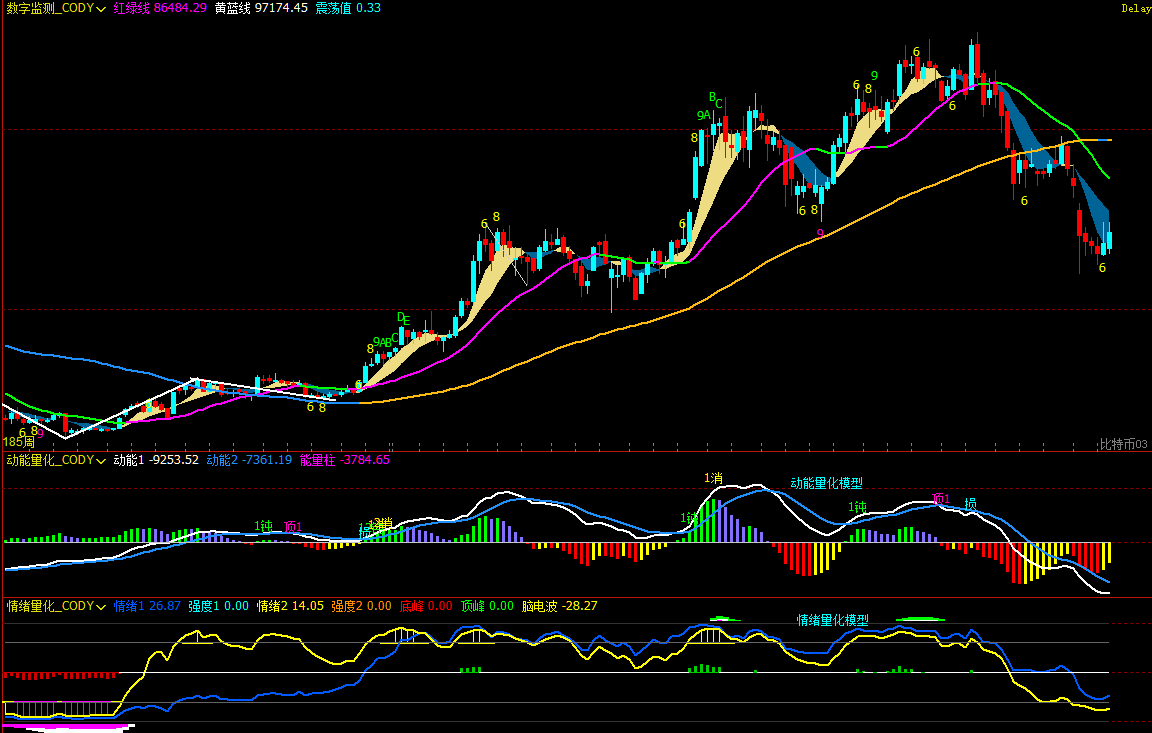
Chart 4
• Momentum quantification model: Technical indicators show that the momentum line is moving down simultaneously, with the white momentum line showing signs of flattening and the negative volume bars gradually shortening, with no momentum divergence signal appearing.
• Sentiment quantification model: The blue sentiment line value is 26, with zero intensity; the yellow sentiment line value is 13, with zero intensity, and the peak value is 0.
• Digital monitoring model: The moving averages show a bearish arrangement, with a large bullish line being printed last week, increasing by about 10.39%, and the coin price finally staying above the 7-week moving average; bottom digital monitoring signals have not appeared.
Comprehensive assessment and analysis: Based on the data from these three major models, the rebound strength in the market last week was significant, with bullish momentum being concentrated and many technical indicators being repaired, which eased the oversold condition. However, we believe the bearish trend at the weekly level of Bitcoin has not been reversed, and the large bullish line printed last week still requires further observation to confirm its sustainability.
2. Daily-level analysis: as shown in (Chart 5)
Bitcoin daily K-line chart: (momentum quantification model + sentiment quantification model)
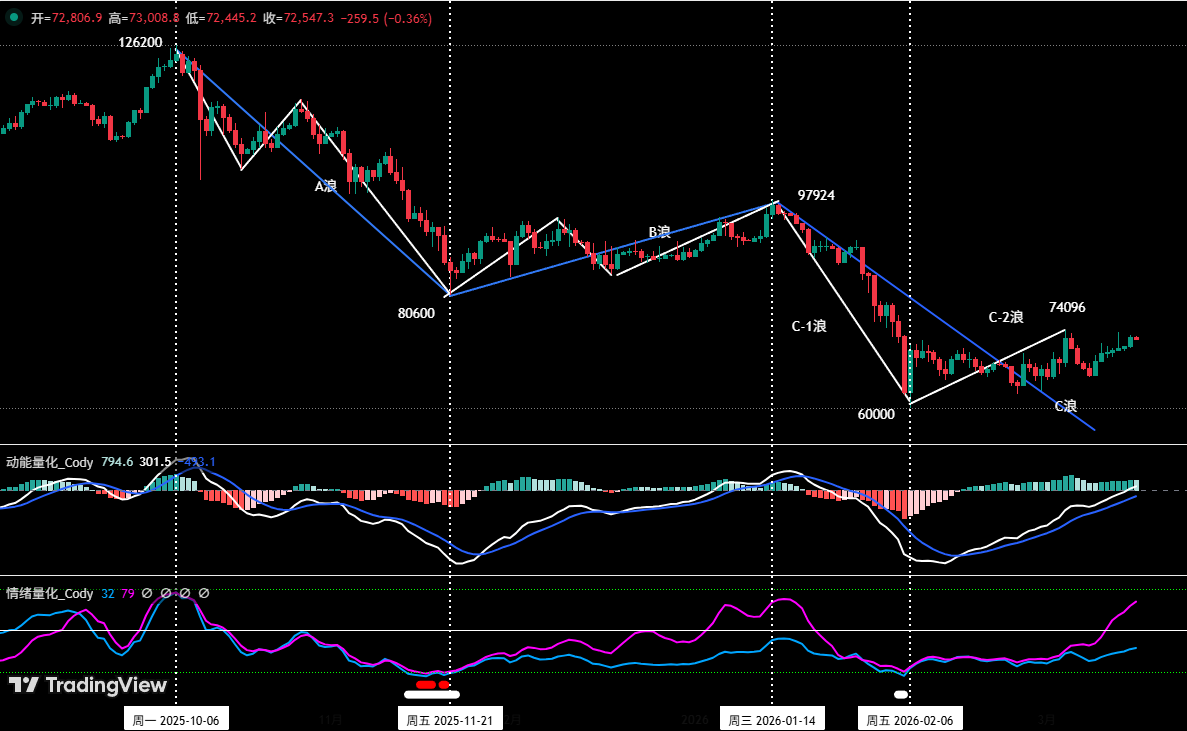
Chart 5
• Momentum quantification model: Overall, the market presented a "volatile upward" pattern last week. The momentum line is rising synchronously below the zero axis, and the white line momentum first crossed the zero axis; the positive moment bars gradually strengthened but with weak intensity.
• Sentiment quantification model: After the daily trading last week, the blue sentiment line value is 31, with zero intensity; the purple sentiment line value is 75, with zero intensity, and the purple line has seen significant upward movement.
Comprehensive assessment and analysis: Combining momentum quantification and sentiment quantification model analyses, we believe that although there were seven consecutive bullish K lines last week indicating strong short-term rebound momentum, the daily trading volumes did not increase correspondingly, and the overall trend remains in the oversold rebound category, not yet escaping the range oscillation pattern. The bearish trend is still ongoing at the daily level, and attention should be focused on the contest between bulls and bears over the key boundary line (zero axis) in the future.
4. Market Forecast for This Week: (March 16 - March 22)
1. Construction of the Bitcoin upward central structure (based on the market after the February 6 low): (updated weekly)
Bitcoin 4-hour K-line chart
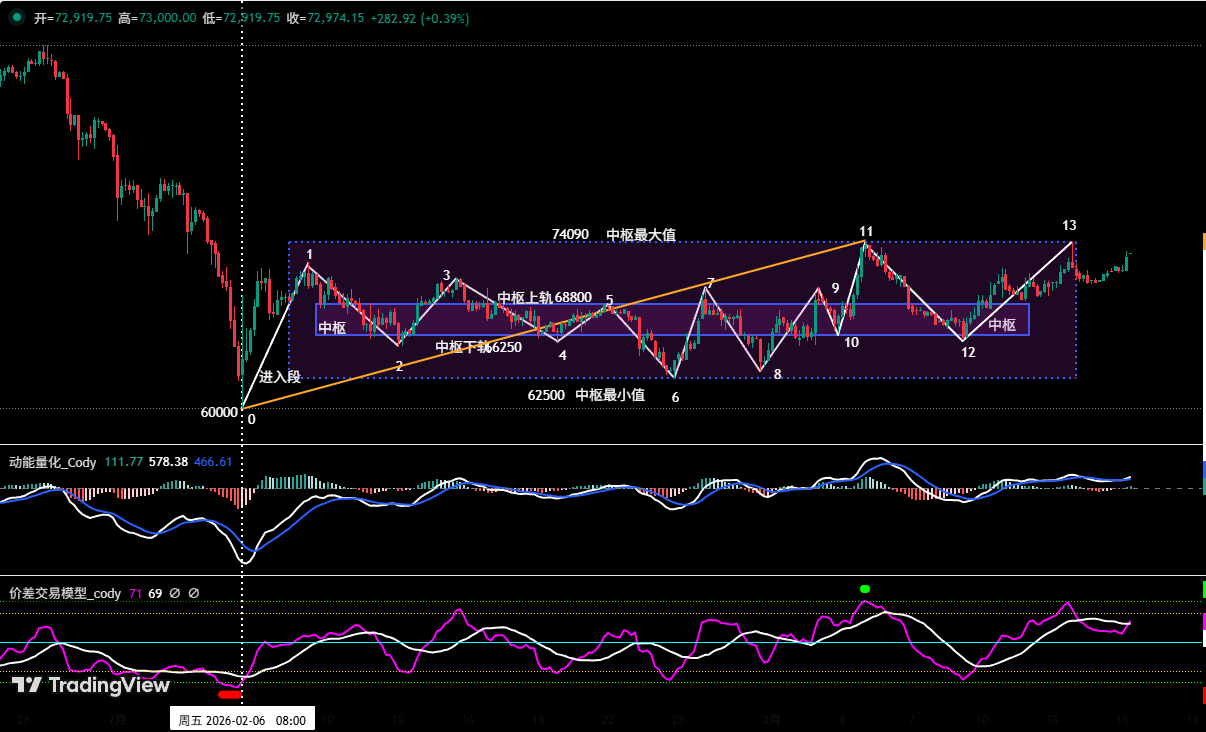
Chart 6
Using the 4-hour analysis cycle for Bitcoin:
• Central construction: As shown in (Chart 6), last week mainly operated in the 12-13 segment trend structure. Currently, it appears to be in the process of constructing an upward central structure. The highest resistance has moved to around $74,090, with the lowest support around $62,500; the upper limit of the central structure is about $68,800, and the lower limit is about $66,250.
2. Judgment of the end of C-2 wave rebound:
• Maintain the previous core judgment framework: The upward trend initiated from Bitcoin's low on February 6 (around $60,000) is fundamentally a major C wave adjustment's internal C-2 wave oversold rebound, followed by a C-3 wave adjustment period.
• Basis for ending the C-2 wave rebound: If the price effectively breaks below the support around the lowest point of the central lower limit of $66,250 during the adjustment and subsequently fails to re-establish itself above that level, it constitutes a third category sell point in the context of the theory of waves. This signals strong downward momentum, and there's an increased probability that the rebound structure might have been disrupted, significantly raising the possibility of an end to the C-2 wave rebound.
3. Core viewpoint for this week: Maintain the range oscillation pattern between $62,500 and $74,500, observing the battle between bulls and bears near the upper and lower edges of the range; pay special attention to: The trends after the coin price effectively breaks below the lower limit of the central structure (around $66,250). The strategy should firmly implement the principle of "reducing positions (long) at highs to control risk."
4. Core resistance levels:
• First resistance area: near $74,500 (near previous important low)
• Second resistance area: around $79,500–$80,600 (near the November 2025 low)
5. Core support levels:
• First support level: near $65,000 (previous important support area)
• Second support level: around $60,000–$62,500 (near February 6 low)
• Third support level: near $57,400
5. Operating Strategies for This Week (excluding the impact of sudden news): (March 16 - March 22)
1. Mid-line strategy: (see Chart 7)
Bitcoin daily K-line chart: (position monitoring model)
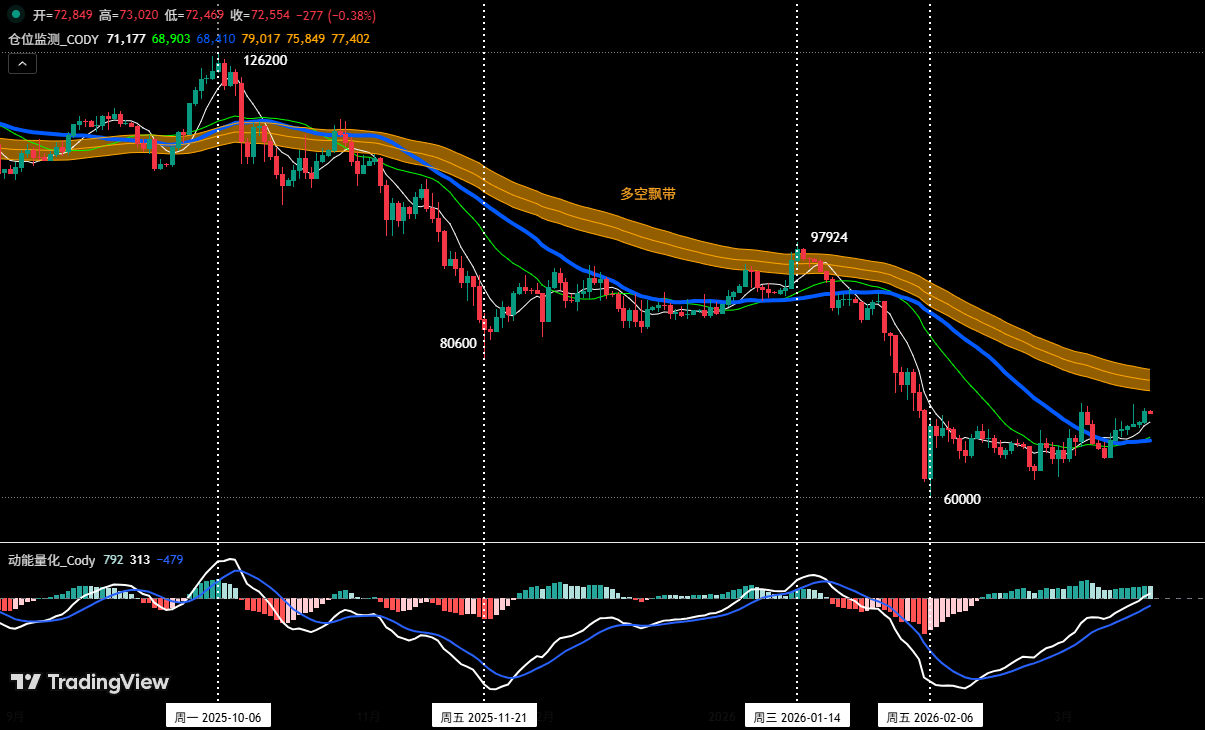
Chart 7
Position monitoring model: Currently, the coin price is below the bullish and bearish floating band (yellow), so we continue to hold the 60% short position opened at around $89,000 (January 28).
• If the coin price rebounds and effectively breaks above $74,500, the mid-line position can be reduced to 40%.
• If the coin price rebounds and effectively breaks above the floating band and stabilizes above it, the mid-line position should be entirely cleared.
2. Short-term strategy: Use 30% of the position, set stop-loss points, and based on support and resistance levels, look for "price differential" opportunities. (Using 30 minutes/60 minutes as the operational cycle).
3. Due to the mid-term direction of the market being a bearish trend, in order to dynamically respond to the market's complex evolution and in combination with signals from our self-constructed trading models, we propose two sets of short-term operational plans:
• Plan A: Short on rebounds meeting resistance.
• Opening: When the coin price continues to rebound to around $74,500 triggering a resistance signal coupled with model top signals, a 30% short position can be established.
• Risk control: Set the initial stop-loss for the short position above $76,000.
• Closing: When it falls to near important support positions coupled with model signals, positions can be gradually closed for profit-taking.
• Plan B: Short positions breaking with the trend.
• Opening: When the coin price effectively breaks below the lower limit of the central structure $66,250, then pulls back to that point without stabilizing, and coupled with model top signals, a 30% short position can be established in line with the trend.
• Risk control: Set the initial stop-loss for the short position above $67,500.
• Closing: When it falls to support levels coupled with model signals, positions can be gradually closed for profit-taking.
6. Special Reminders:
1. When opening positions: immediately set the initial stop-loss.
2. When profits reach 1%: move the stop-loss to the opening cost price (break-even point) to ensure capital safety.
3. When profits reach 2%: move the stop-loss to a position of 1% profit.
4. Continuous tracking: After that, for every additional profit of 1% that the coin price achieves, the stop-loss will also be moved up by 1% to dynamically protect and secure profits.
The financial market is ever-changing, and all analysis and trading strategies must be dynamically adjusted. All viewpoints, analytical models, and operational strategies mentioned in this article are based on personal technical analysis and are for personal trading logs only. They do not constitute any investment advice or basis for operation. The market has risks; investment should be cautious, and decisions should not be made based on these.
免责声明:本文章仅代表作者个人观点,不代表本平台的立场和观点。本文章仅供信息分享,不构成对任何人的任何投资建议。用户与作者之间的任何争议,与本平台无关。如网页中刊载的文章或图片涉及侵权,请提供相关的权利证明和身份证明发送邮件到support@aicoin.com,本平台相关工作人员将会进行核查。


