Original author: Four Pillars
Original translation: AididiaoJP, Foresight News
Key Points
In eight months, 99.5% of daily protocol revenue was used to complete a $328 million buyback, with two independent data aggregators arriving at the same conclusion despite not communicating. To manipulate the data, it would be necessary to deceive both DeFiLlama and Adam_tech, which only indexes Solana's Dune data while maintaining a stable ratio of 68-69%, supported by 105.17 billion PUMP tokens in verifiable wallets.
The "dilution curve" in August 2026 is actually a supply substitution rather than an addition; with the current revenue level, the buyback can absorb double the new supply. Once the team and investors unlock their holdings, community emissions will cease. Monthly emissions will drop from 10 billion tokens to 9.2 billion tokens.
The true reason for the current depressed valuation multiple is due to: industry classification ("original sin stock" nature), trust foundation (anonymous team, discretionary buybacks), and capital flow (suspected insider traders using buybacks to dump tokens).
1. Proof of $328 Million Buyback
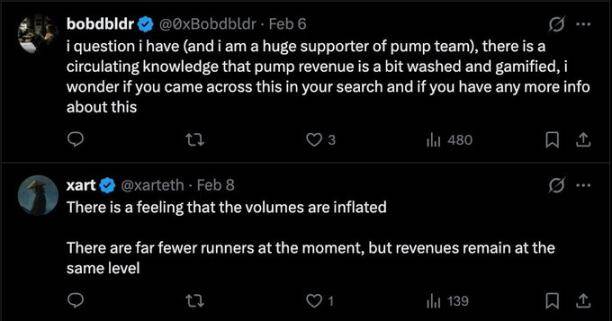
Rumors of income falsification by Pump.fun have been circulating on Twitter; the following analysis indicates these rumors are false.
As of March 15, 2026, data from fees.pump.fun shows the cumulative buyback amount reached $328 million. This means that 2,283,518 SOL were used to purchase 10.45 billion PUMP tokens, which accounts for 10.45% of the total supply, offsetting 29.52% of the circulating supply. Over eight months, the daily buyback amount has maintained between 99.5% and 100.5% of protocol revenue, with an average daily buyback of $1.25 million as of February 2026. Faking $328 million in revenue requires a significant capital outflow: for every dollar bought back, one dollar worth of SOL must flow out of a verifiable wallet to purchase tokens stored at an auditable address. Faking $328 million in revenue would require an actual expenditure of $328 million.
The relevant tokens are stored on-chain for verification (as of March 17, wallet G8CcfRff holds 10.396 billion PUMP, 8PSmqJy6 holds 1.21 billion PUMP, totaling 10.517 billion). The initial execution wallet 3vkpy5Y (marked as "Pump Buy Back" by Solscan) has completed the transfer to the holding wallet and has been cycled out, currently with a balance of zero.
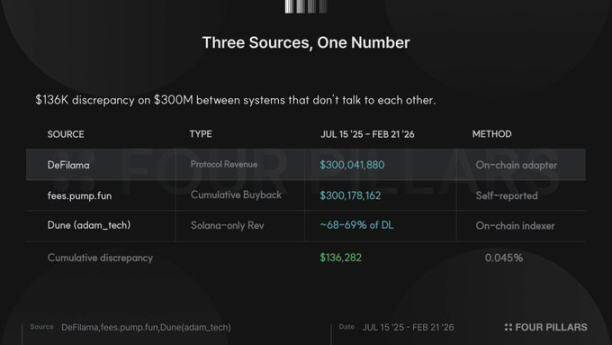
DeFiLlama recorded a total protocol revenue of $300,041,880 from July 15, 2025, to February 21, 2026. During the same period, fees.pump.fun reports a cumulative buyback amount of $300,178,162. The matching rate of both is 100.05%, with only a discrepancy of $136,000 between the two independent systems.
Adam_tech's Dune dashboard provides a third layer of verification. This platform only tracks revenue from the Solana chain, consistently accounting for 68-69% of DeFiLlama's multi-chain data, as it has not indexed revenues from the Padre project launched on Base, Ethereum, and BNB Chain in October 2025. This ratio remains stable daily, indicating that both independently read the same on-chain events.
Prior to the launch of PumpSwap in March 2025, the error among the three data sources was within 1-5%. After the launch of PumpSwap, the data diverged into three tiers: total fees, protocol revenue, and Solana only revenue. If the revenue data were artificially fabricated, it would require deceiving both independent on-chain indexers, maintaining stable cross-ratios through three product changes, ensuring that the multi-chain revenue split ratio aligns with actual business expansion, and using token purchases in verifiable wallets as support.
2. Four Statistical Tests
In addition to on-chain evidence, the 747-day fee data can undergo four standard tests to verify the authenticity of financial data. While individual tests may not be definitive, the credibility significantly increases when all four point to the same conclusion.
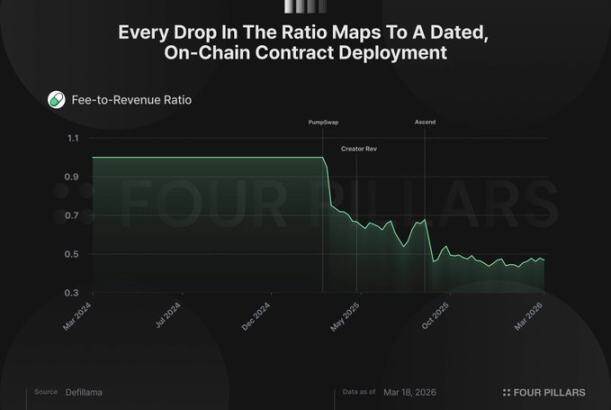
The first test examines the ratio of fees to revenue, the most challenging metric to falsify. Pump.fun charges fees for each joint curve transaction, but not all are included in protocol revenue; some flow to LPs, creators, and referral rewards. In the dataset, the total fees to net income ratio dropped from 1.0 to about 0.48, but not gradually; instead, it fell sharply in three stages, each corresponding to product changes recorded on-chain:
- On March 20, 2025, the LP fee split mechanism went live with PumpSwap, where the ratio dropped from 1.00 to 0.70 within two days.
- On May 13, the creator income-sharing mechanism was launched, with the ratio dropping from 0.69 to 0.56.
- On September 2-3, the Ascend project introduced a dynamic fee mechanism, with tiered pricing allowing creators to earn up to 0.95% in fees on low-market-cap tokens, leaving only 0.05% for the protocol, causing the ratio to fall from 0.68 to 0.46.
Faking this data would require synchronously simulating the fee and revenue series experiencing three structural adjustments, with daily ratios fluctuating between 0.40 and 0.55 based on token tier combinations. This complexity makes fabrication difficult to achieve. The reality is that natural product iterations lead to data changes, rather than artificially constructing structural breakpoints that align with contract deployment timelines.
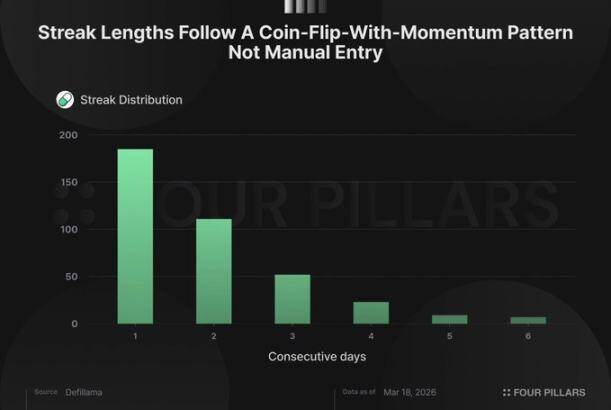
The second test examines continuity and digital distribution characteristics, aimed at determining whether the data exhibit signs of human entry. Humans struggle to generate genuine random sequences, tend to avoid prolonged streaks, prefer whole numbers, and unconsciously favor specific digits. The data from Pump.fun does not show these characteristics:
The longest streak of consecutive increases or decreases was 6 days, with an average consecutive length of 1.92 days, consistent with expectations of a natural process with moderate momentum. The distribution of consecutive lengths decreases geometrically: 185 instances of single-day streaks, 111 instances of two-day streaks, 52 instances of three-day streaks, and down to 7 instances of six-day streaks.
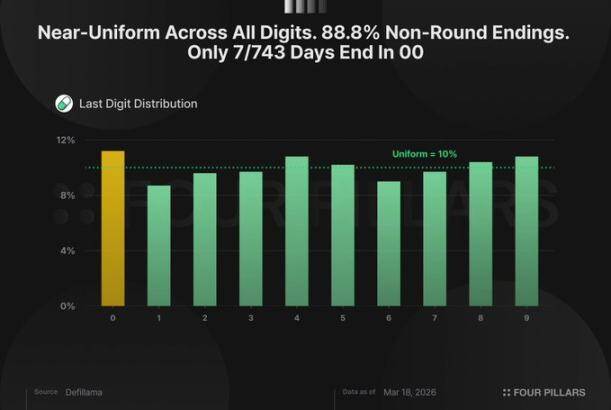
Daily fee's last digits have a near-uniform distribution between 0-9, with each digit accounting for 8.7%-11.2%. 88.8% of dates have non-integer last digits, with only 7 dates among the 743 non-zero dates ending with 00 or 000.
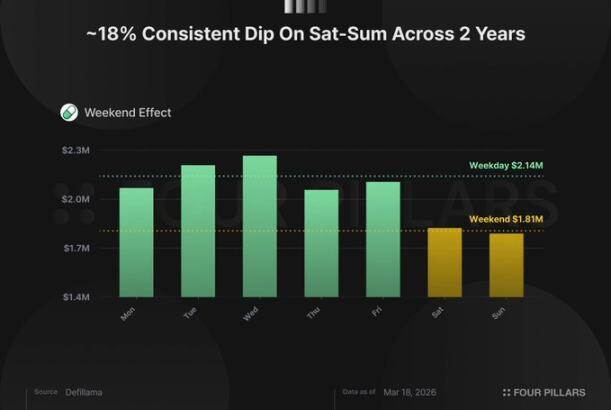
The third test examines the weekend effect. Pump.fun is a retail platform, with users mostly issuing tokens on trading days rather than weekends. Average fees on weekdays are $2.14 million, while on weekends they are $1.81 million, indicating a sustained drop of about 18%, visible week-after-week over two years of data. The Mann-Whitney test shows a p-value of 0.003, indicating statistical significance. If the data were artificially constructed, there would need to be an intentional effort to keep the weekend figures consistently low, which increases the complexity of the fraud and the risk of being uncovered.
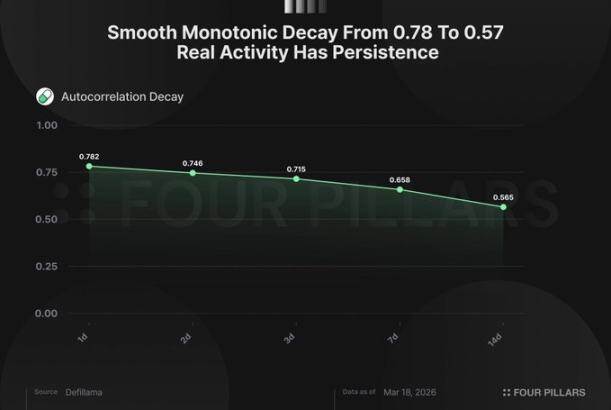
The final test examines autocorrelation, measuring the association between today's revenue and tomorrow's revenue. Pump.fun has a first-order autocorrelation of 0.78, indicating a 78% correlation between today's fees and yesterday's; a week later (lagged by 7 days), it remains at 0.65; and two weeks later (lagged by 14 days) it is 0.57. This slow, smooth decline reflects the momentum characteristics of organic platform activities: active periods cluster, while dull periods extend. If daily income were generated randomly, the correlation between adjacent dates would be almost zero, and the data would jump like noise rather than flow like markets. While it’s not difficult to fabricate high autocorrelation at a single lag, it’s nearly impossible to simultaneously fake the entire decay structure (with each lag gradually declining monotonically) while maintaining the weekend effect, continuity characteristics, and authentic digital distributions.
Four independent tests, four consistent conclusions, with three data sources mutually corroborating each other. The revenue data is authentic and credible.
3. Analysis of Remaining Valuation Discount Factors
Rumors of revenue falsification are one of the reasons for the current depressed valuation of PUMP. The previous analysis has clarified this point. However, the tokens continue to trade at a discount, necessitating an exploration of other suppressive factors and their authenticity.
First, we analyze the team unlock in August. Community emissions are 10 billion tokens per month and will cease after reaching 240 billion in July, coinciding with the team and investor unlock. The cumulative monthly emissions will be 9.2 billion tokens. Monthly emissions dropping from 10 billion to 9.2 billion represents an 8% reduction in inflation. Based on the current daily average revenue of $1.25 million, the monthly average buyback of $38 million, at a price of $0.0021 per token, can absorb about twice the monthly new supply of $19 million. After August, as emissions decrease and buybacks continue, this ratio will further improve.
Revenue has also not shown a decline. Over the past fourteen months, monthly fees have fluctuated between $2.3 million and $4.8 million daily: a drop of 49% in July 2025, a rebound of 94% in August, a surge of 72% in September, and a spike of 45% in January 2026. Overall, there has been a mean reversion around a daily average of $2.5 million, with weekly trading volume stabilizing at $640-$700 million. The so-called "decline from Q3 to Q1" is a one-sided conclusion drawn from selectively choosing peak data from September.
The remaining suppressive factors are as follows:
The "original sin stock" discount is the most enduring. Solidus Labs found that 98.6% of tokens on the platform exhibit "rug pull" characteristics, creating a prevailing effect: regardless of revenue, institutional allocators will not include "meme coin casinos" in their portfolios. This is a continuous structural factor, wholly unrelated to revenue quality.
Source: Solidus Labs
Allegations of insider selling constitute palpable recent pressure. Wallet 77DsB received 3.75 billion PUMP tokens from what Solscan marked as "token custodial wallet" address in July 2025, reportedly liquidating for 8.02 million USDC between February 16 and 22, 2026. Wallet GpCfm simultaneously transferred 1.21 billion PUMP ($2.57 million) to Bitget. A third wallet deposited 1.757 billion PUMP ($3.54 million) into Bitget on March 6. While there is no confirmed source of ownership, at least $14 million was moved to exchanges in conjunction with the protocol buyback at a market price of $0.002, compared to a previous private offering price of $0.004. Regardless of the identity of the wallet owners, this situation raises suspicion.
The trust dimension is the hardest to price. The founder's identity is anonymous (co-founder Dylan has a "rug pull" record from 2017); buybacks are explicitly "discretionary" ("pump.fun may modify or suspend related plans at any time"); Bubblemaps indicated that Hayden Davis was associated with a $50 million private placement, a claim later retracted because co-founder Alon labeled it "defamation." There indeed exist on-chain connections, but the attribution is disputed and unverified.
None of the above factors pertain to the core business fundamentals. Revenues are genuine, data supports them, and the unlocking arrangement favors holders. The "original sin stock" tag, anonymous founders, and insider capital flows represent a trust discount on an agreement with a daily verifiable on-chain revenue of $1.25 million, capable of absorbing twice the new supply through buybacks. The trust discount will ultimately narrow, and these revenue levels will not misalign permanently.
免责声明:本文章仅代表作者个人观点,不代表本平台的立场和观点。本文章仅供信息分享,不构成对任何人的任何投资建议。用户与作者之间的任何争议,与本平台无关。如网页中刊载的文章或图片涉及侵权,请提供相关的权利证明和身份证明发送邮件到support@aicoin.com,本平台相关工作人员将会进行核查。


