Market Waves: March 21 Bitcoin (BTC) Market Analysis Reference:
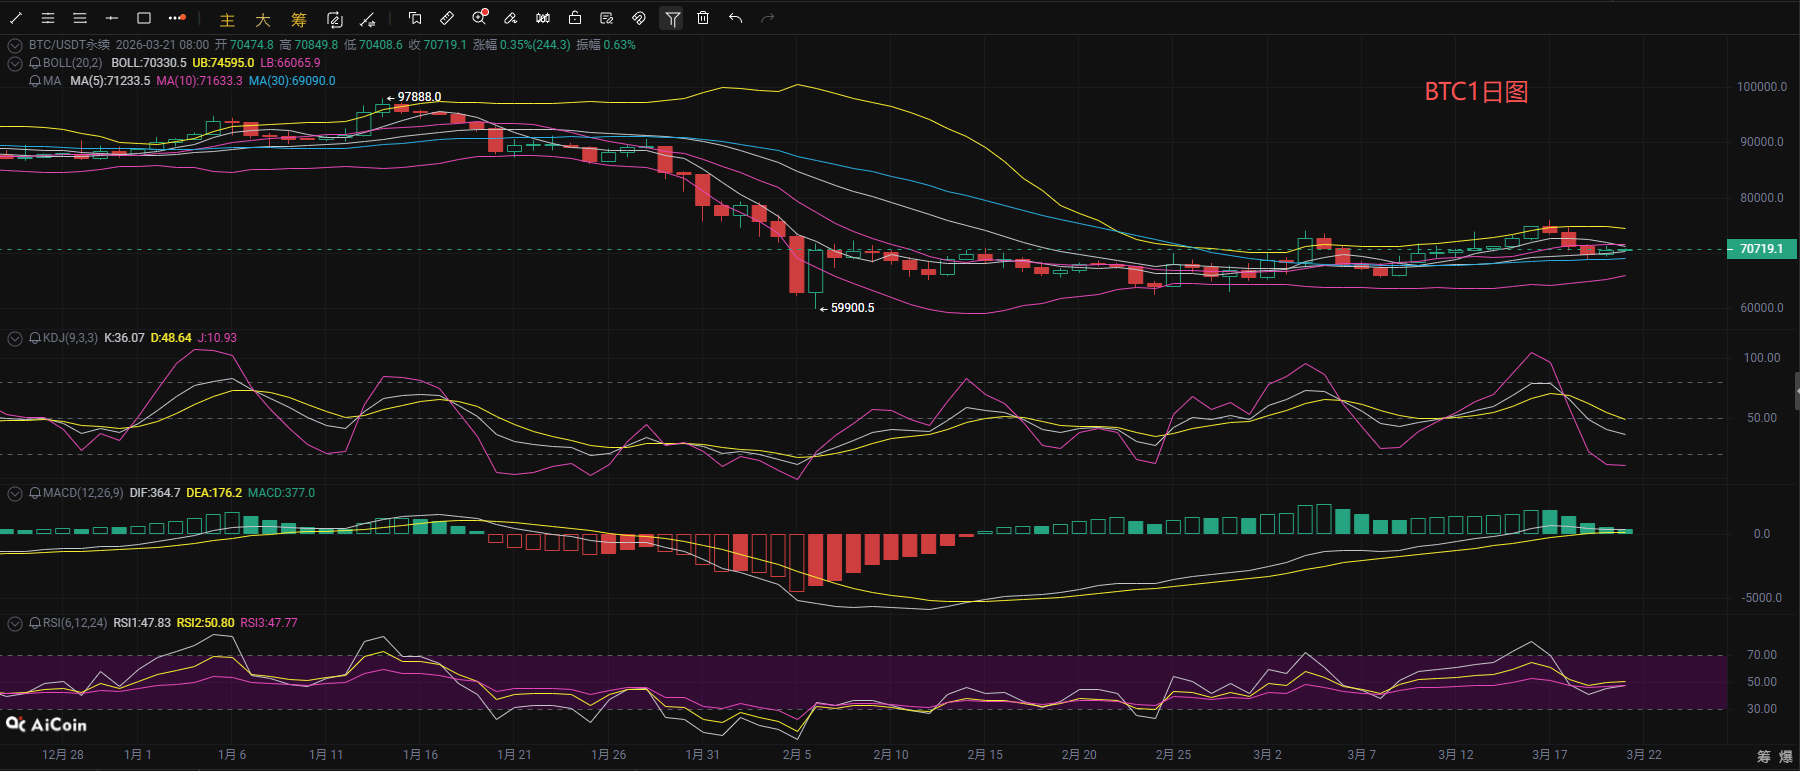
Bitcoin's intraday market has overall maintained narrow fluctuations and consolidation. From the daily chart, Bitcoin's current price is fluctuating around 70600, though it is under pressure from the short-term moving averages MA5 and MA10, it remains above the mid-term moving average MA30. The MACD indicator's DIF and DEA are still above the zero line, and the trading volume continues to diminish, indicating weakening bearish momentum. The KDJ indicator's three lines are diverging downwards, with the J value having entered the oversold area, signaling a short-term technical rebound and recovery demand. The RSI indicator's three lines have all fallen back to the 50 neutral zone. Overall, the bearish momentum at the daily level has diminished but has not exhausted completely, and it is expected that the short-term fluctuation pattern will likely continue.
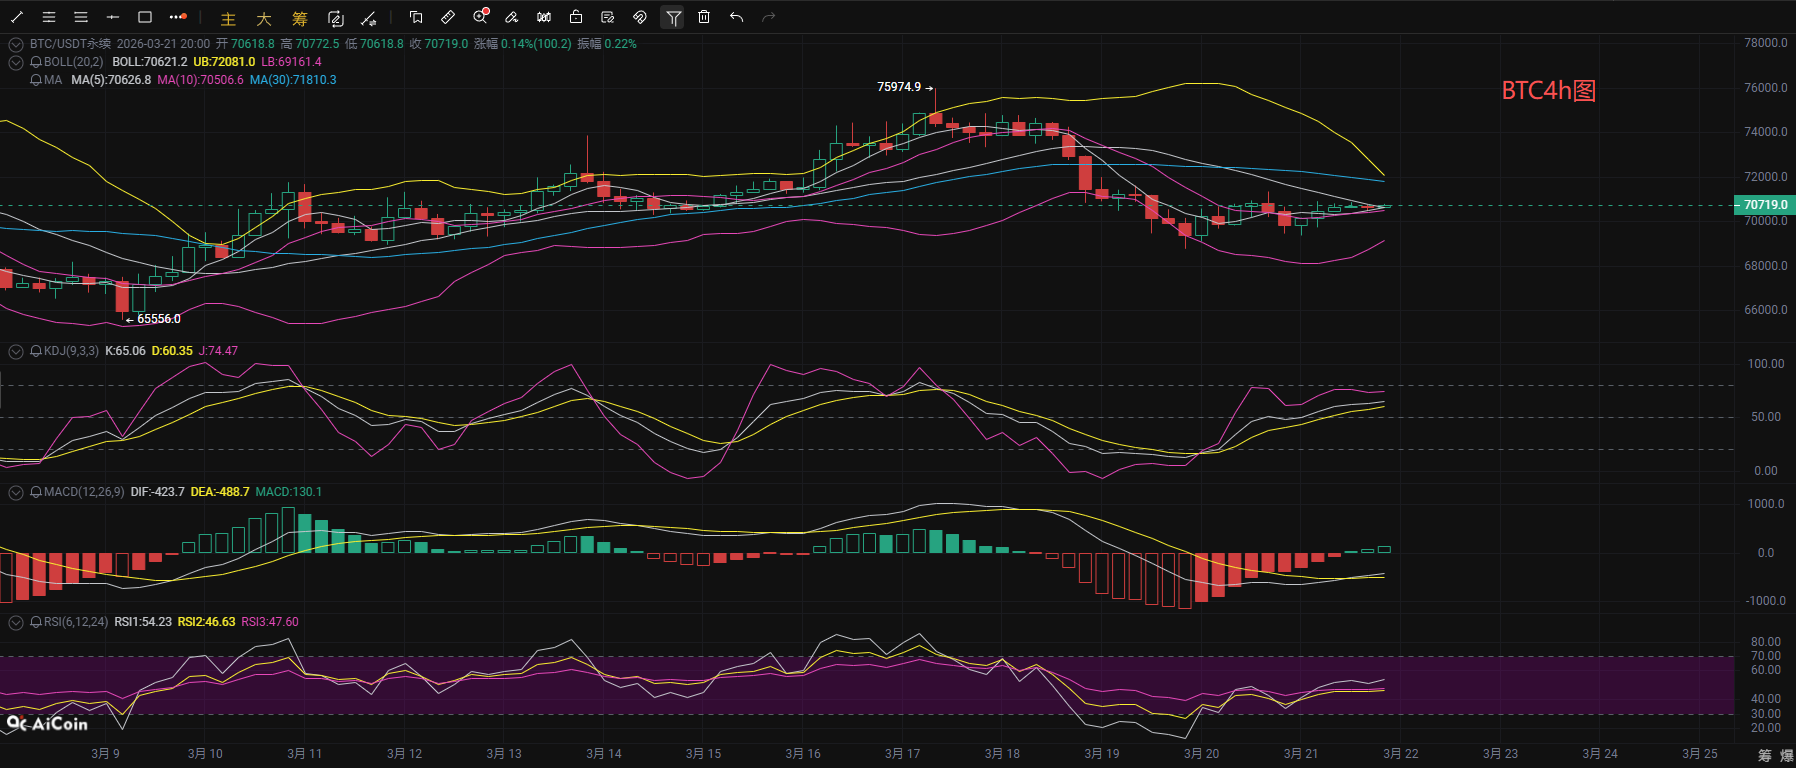
From the short-cycle hourly chart, at the 4-hour level, the Bollinger Bands show a convergence pattern, and the current price is fluctuating around 70600. The price is above the MA5 and MA10 moving averages but below the MA30 moving average. The short-term moving averages are turning upwards, while the mid-term moving averages continue to exert pressure on the price. The MACD has turned from negative to positive, with the indicators DIF and DEA showing a golden cross below the zero line, indicating a decrease in bearish momentum and a gradual increase in bullish power. The KDJ indicator's three lines are diverging upwards, entering the neutral bullish area, and the RSI indicator's three lines have risen to around 50, signaling a shift in market sentiment from bearish to neutral. At the hourly level, prices have stabilized at the Bollinger Bands midline and short-term moving averages, with the MACD golden cross expanding slightly, and the RSI remaining in the bullish territory, indicating bullish dominance but not yet a breakout. Overall, the indicators suggest a short-term rebound and recovery demand, but the strength is limited, likely leading to a consumption of retracement pressure by exchanging time for space. It is expected that the short-term price will fluctuate and consolidate in the 69500-72000 range; operationally, it is recommended to short at high and long at low within this range.
Market Waves: March 21 Bitcoin Short-term Reference:
Short Position: Short in the 71500-72500 range, stop loss at 500 points, target at 70500-69500,
Long Position: Long in the 69000-70000 range, stop loss at 500 points, target at 70500-71500,
Market Waves: March 21 Ethereum Short-term Reference:
Short Position: Short in the 2170-2220 range, stop loss at 30 points, target at 2160-2120,
Long Position: Long in the 2000-2130 range, stop loss at 30 points, target at 2150-2200,
[The above analysis and strategies are for reference only; please bear the risks yourself. The article review and publication may have delays, and the strategies may lack timeliness; do not operate blindly.]

The content of this article is originally shared by 【Market Waves】 and represents personal views only. The article may have delays in dissemination and is for reference only; do not operate blindly! Want to receive more daily real-time signals? Then follow my official account! Here, you can engage in online technical learning and gain knowledge related to positions and exits. I have years of research experience in the market, focusing on major trends in the cryptocurrency space. I am mainly responsible for analyzing and guiding investment operations in BTC, ETH, SOL, BCH, and other coins. Welcome to study and research together.
免责声明:本文章仅代表作者个人观点,不代表本平台的立场和观点。本文章仅供信息分享,不构成对任何人的任何投资建议。用户与作者之间的任何争议,与本平台无关。如网页中刊载的文章或图片涉及侵权,请提供相关的权利证明和身份证明发送邮件到support@aicoin.com,本平台相关工作人员将会进行核查。