Coin Waves: 3.22 Bitcoin (BTC) Market Analysis Reference:
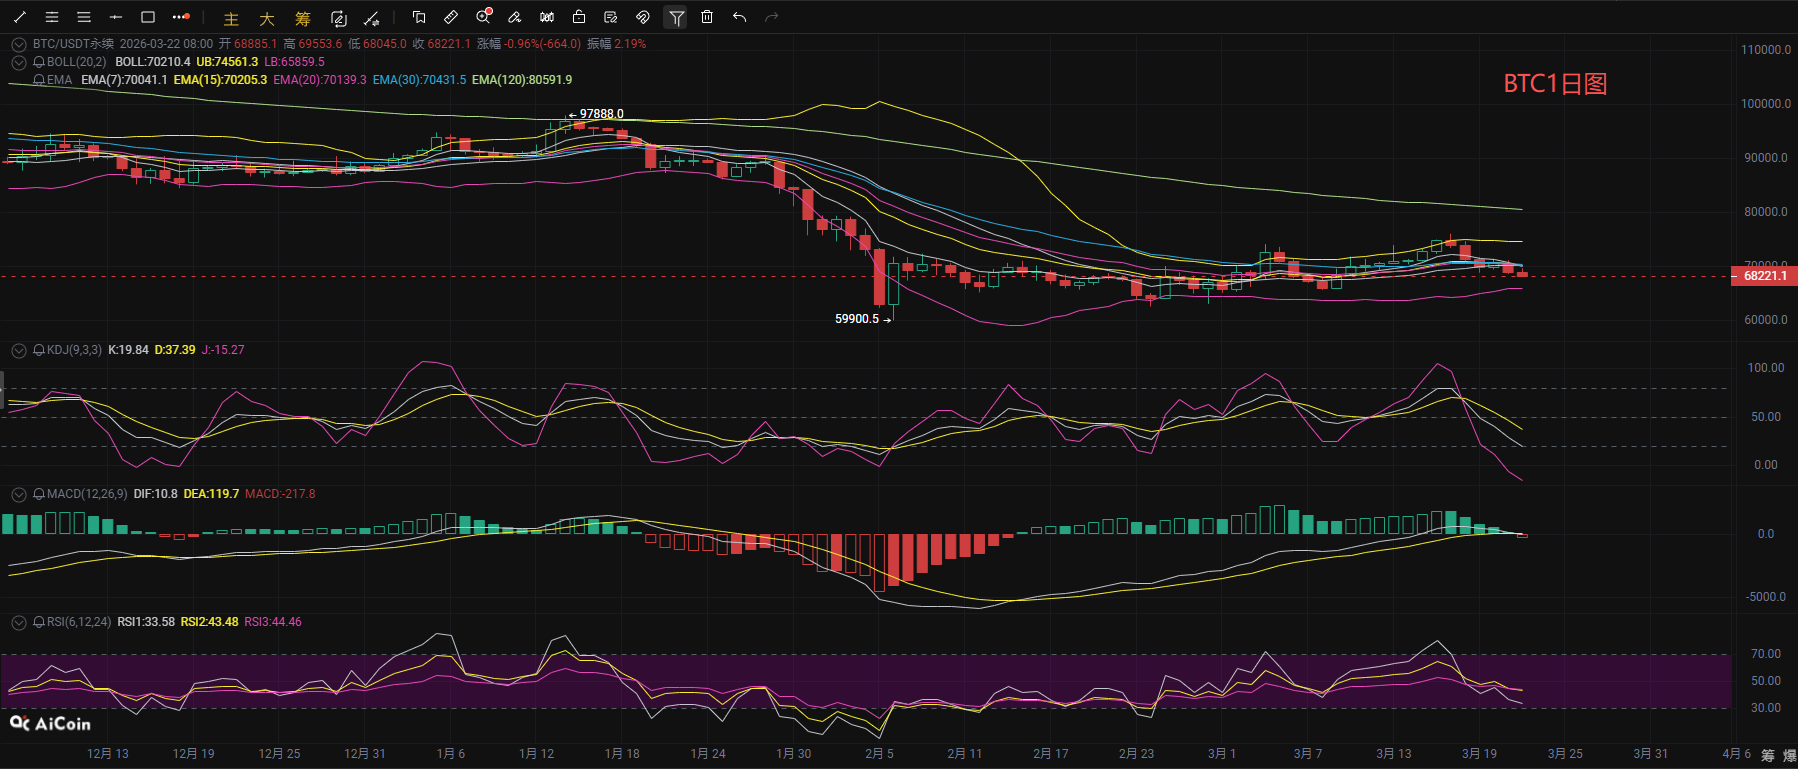
Bitcoin experienced a quick drop earlier today, touching the lower line around 68200 before rebounding. As of publication, the coin price is fluctuating around 68300. From the daily perspective, the K line closed in the red, and the current price has dropped below the short-term moving averages. The 7-day, 15-day, and 20-day EMA have all turned downwards, indicating a weakening short-term trend. The KDJ indicator shows all three lines diverging downwards, with the J value entering the oversold zone and showing no signs of reversal, indicating that bearish strength still dominates. The MACD indicator's DIF is crossing below the DEA, signaling a death cross, and the volume bars are gradually shrinking and turning negative, indicating a continuous weakening of buying momentum. The RSI indicator's three lines have all retreated below 50, confirming a short-term bearish pattern, with only limited support from the lower Bollinger Band and previous lows in the 66000-67000 range. It is expected that the future trend will likely continue to decline.
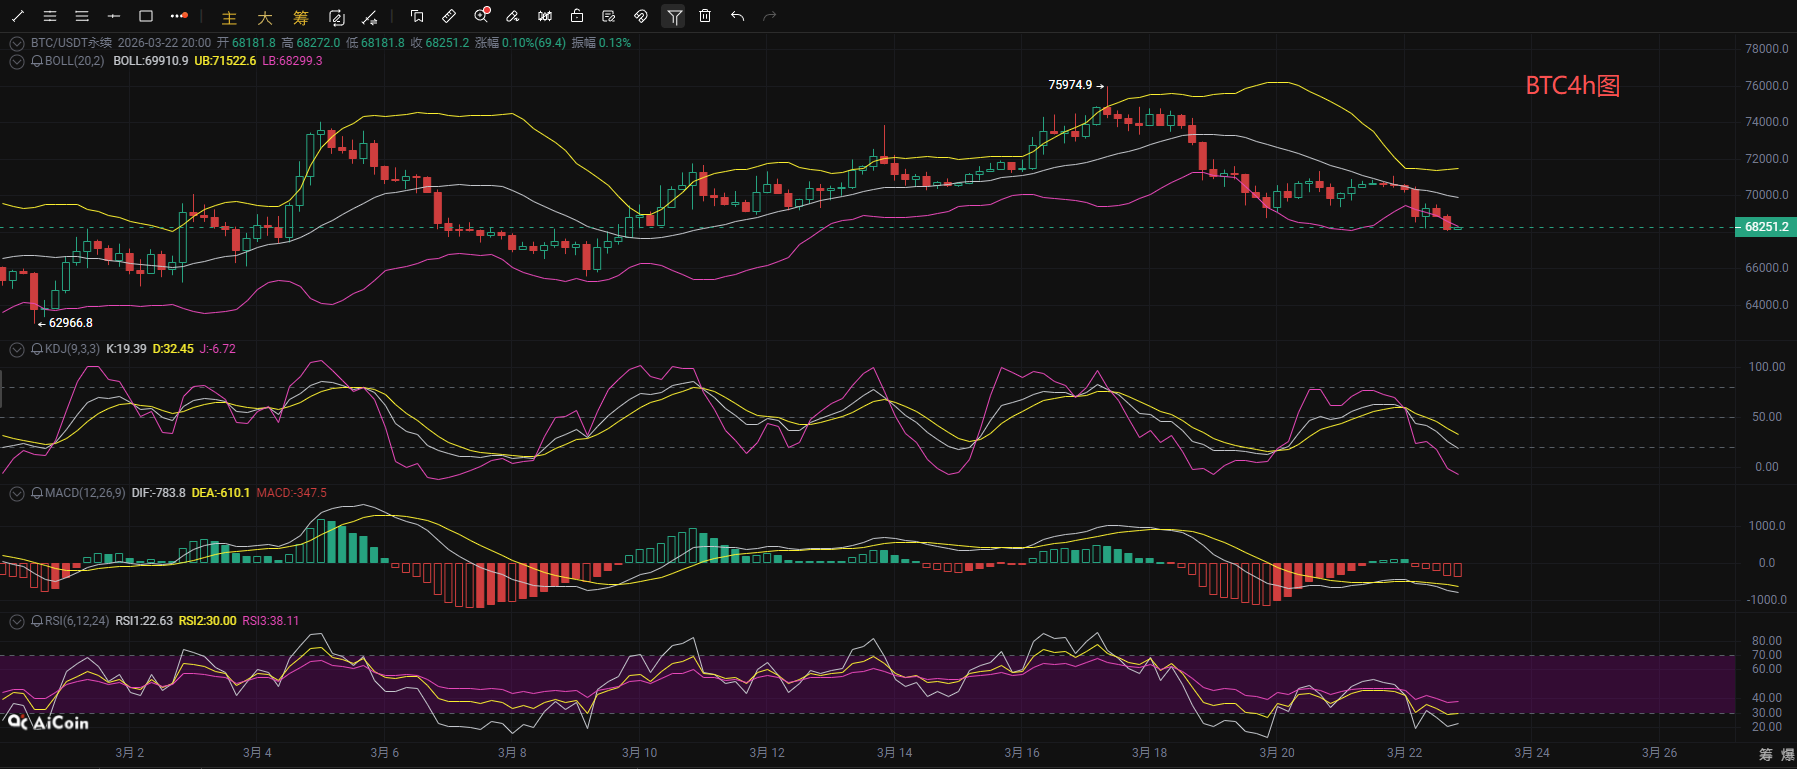
From the short-cycle hourly chart, the current BTC 4-hour chart shows that the price has fallen below all short-term EMA lines (7/15/20) as well as the medium-term EMA30 and long-term EMA120, with the moving average system in a bearish arrangement, and the Bollinger Bands opening downwards, with the price closely following the lower band, indicating a clear bearish trend; KDJ shows three lines diverging downwards with the J value nearing the oversold zone, and the MACD shows a death cross and the volume bars continue to increase. The RSI's three lines have all retreated below 40, reflecting extremely weak market sentiment, with weak short-term rebound momentum. In terms of future trends, the price will likely continue to pull back, and if it breaks below the recent low of 68200, it will further test the support area of 66000-67000; if it briefly stabilizes and rebounds, the upper range of 70000-70500 will face dual pressure from the EMA30 and the Bollinger middle band, making a breakout very difficult. Overall, the trend will still be focused on bearish fluctuations, and further risks of dropping towards the mid-term support should be noted.
Coin Waves: 3.22 Bitcoin Short-Term Reference:
Short Position: Sell in the 69500-70500 range, stop loss at 500 points, target at 68500-67500,
Long Position: Buy in the 66500-67500 range, stop loss at 500 points, target at 68500-69500,
Coin Waves: 3.21 Ethereum Short-Term Reference:
Short Position: Sell in the 2130-2180 range, stop loss at 30 points, target at 2080-2020,
Long Position: Buy in the 1995-2025 range, stop loss at 30 points, target at 2070-2150,
【The above analysis and strategies are for reference only; risks are to be borne by yourself. The article's review and publication may have delays, and strategies may lack timeliness. Please do not operate blindly】

This content is originally shared by【Coin Waves】and represents only personal opinions. The article may have delays in transmission and is for reference only; do not operate blindly! Want to get more daily real-time orders? Then follow my WeChat public account. Here, you can engage in online market technical learning and also learn about relevant knowledge for exiting positions. I have years of research experience in the market, focusing on major trends in the cryptocurrency circle, and primarily responsible for analyzing and guiding investments in BTC, ETH, SOL, BCH, etc. Welcome to study and research together.
免责声明:本文章仅代表作者个人观点,不代表本平台的立场和观点。本文章仅供信息分享,不构成对任何人的任何投资建议。用户与作者之间的任何争议,与本平台无关。如网页中刊载的文章或图片涉及侵权,请提供相关的权利证明和身份证明发送邮件到support@aicoin.com,本平台相关工作人员将会进行核查。