Author: Murphy
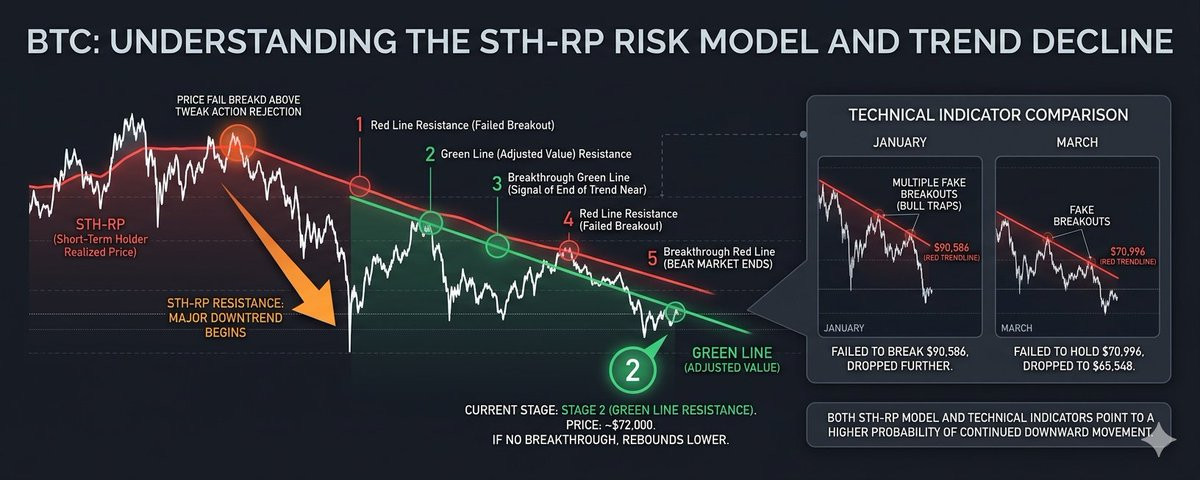
When the price of BTC is suppressed by the STH-RP, it means that a large amount of selling pressure will occur when the price approaches the short-term cost average line, which is why it cannot break through. This often marks the beginning of a major downtrend (as indicated by the orange arrow in the figure).
Therefore, we regard the STH-RP model as an important risk signal!
However, once the downtrend begins, the price of BTC may significantly deviate from the STH-RP, and even if there is a rebound afterwards, it will be far from it. Therefore, we need to adjust the algorithm to provide a more referential value. For example, the green line in the figure.
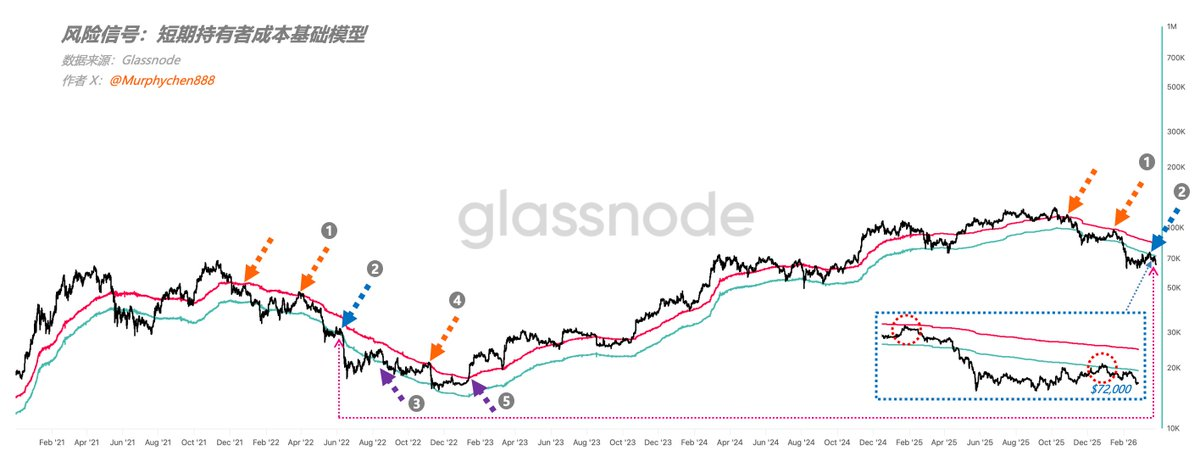
(Figure 1) Risk Signal: Short-term Holder Cost Base Model
Thus, we see a visualized process of energy decay: 1 Red line encounters resistance → 2 Green line encounters resistance → 3 Breakthrough of the green line → 4 Red line encounters resistance → 5 Breakthrough of the red line, indicating the end of the bear market.
Of course, after point 3, there may not be a 4, but it may jump directly to 5. This is usually caused by a low-probability event that significantly boosts market confidence, thus instantly reversing the trend.
It is clear that what we currently see is: BTC is in the aforementioned 2nd stage; that is, it encounters resistance at the green line, and both the red and green lines are still continuing to decline. In other words, as long as BTC does not break through the green line, the "rebound height" will continue to decrease, and the probability of downward movement will be greater.
As of yesterday, the position of the green line is — $72,000.
Let’s change our perspective: from a technical indicator standpoint, the movement of BTC in March shares many similarities with January.
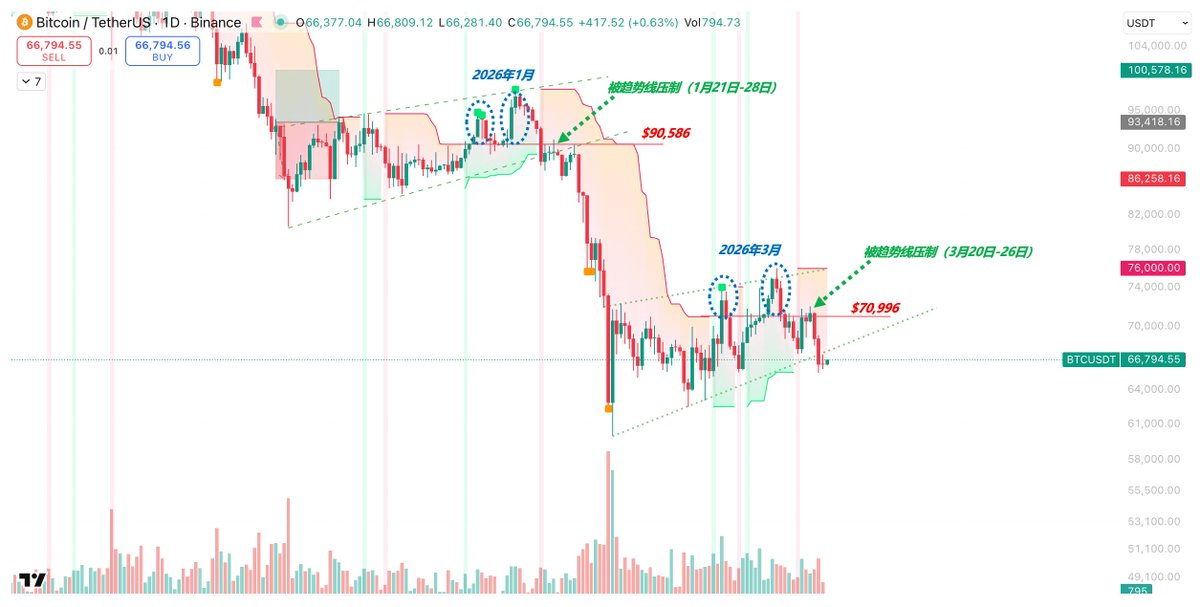
(Figure 2) BTC/USDT Daily Candlestick Chart
Both are suppressed by a downward trend line and both experienced two false breakouts at the daily level (buying traps). After the false breakouts, the trend line indicators were raised, hence we need to exclude this interference and continue to use the previous trend line position.
For instance, during the period from January 21 to 28, BTC continuously failed to break through $90,586 (red trend line), ultimately choosing to continue declining. This time, from March 20 to 26, it also failed to effectively stay above $70,996, dropping down to $65,548.
From the current formation, the probability of continuing downward direction is far greater than that of upward movement. This conclusion is completely consistent with the results obtained from our STH-RP risk model analysis.
Finally, we need to return to the trading aspect: if you find it difficult to understand or are uncertain, don’t act impulsively, to avoid making mistakes by trying harder!
For short-term trading, my personal consideration is that if the rebound approaches $70,996, I will open a position to short to verify my judgment. Avoid high leverage, while also allowing possible "false breakout" space, and set a stop loss if it breaks above $72,000.
For those looking to establish a long-term position, you might consider gradually building a position after entering the STH-RP risk model stage 3, until fully built up in stage 5. This method ensures that you can buy within the relatively bottom range of the entire bear market; you won’t miss out, costs are controllable, and certainty is high.
免责声明:本文章仅代表作者个人观点,不代表本平台的立场和观点。本文章仅供信息分享,不构成对任何人的任何投资建议。用户与作者之间的任何争议,与本平台无关。如网页中刊载的文章或图片涉及侵权,请提供相关的权利证明和身份证明发送邮件到support@aicoin.com,本平台相关工作人员将会进行核查。


