Author: David Lopez Mateos
Translation: Shenchao TechFlow
Shenchao Introduction: The media likes to summarize the rise and fall of GPU computing power prices with a single number, but the reality is: the quotes provided by four index providers on the Bloomberg terminal diverge by more than $2 from each other, with inconsistent directions and rhythms. The author of this article is David Lopez Mateos, the founder of the GPU computing power trading platform Compute Desk. He has broken down the real pricing structure of H100 and B200 using firsthand trading data, revealing a raw market without a consensus benchmark, standardized contracts, or forward curves—computing power is being hoarded and sublet like short-term rental apartments.
The media headlines make it seem like GPU computing power prices are soaring. This narrative is comfortable, perfectly embedded in the macro framework of "supply tightness + unlimited AI demand," and it implies something reassuring: we have a well-functioning market with clear price signals.
But we do not. This narrative is almost entirely based on a single index, suggesting things that should not be implied: the GPU rental market has become so efficient that a single number can represent the overall state.
Supply tightness is real, but different people experience that tightness differently—depending on who you are, where you are, what type of contract you are trading, and what computing power asset you are dealing with. Faced with this opacity, the market's natural response is not orderly price discovery, but hoarding: locking in GPU time you may not yet need, because you are not certain whether you can buy them at any price next month. Where there is hoarding and no transparent benchmark, a fragmented secondary market is bound to emerge. At Compute Desk, we have facilitated tenants subletting their clusters much like subletting apartments during major events. This is not a hypothesis; it is happening.
Indices Not Converging
In mature commodity markets, indices constructed based on different methodologies tend to converge. Brent crude oil and WTI can have a price difference of a few dollars due to geographical location and oil quality, but they move in sync directionally (Figure 1). This convergence is a hallmark of an efficient market.
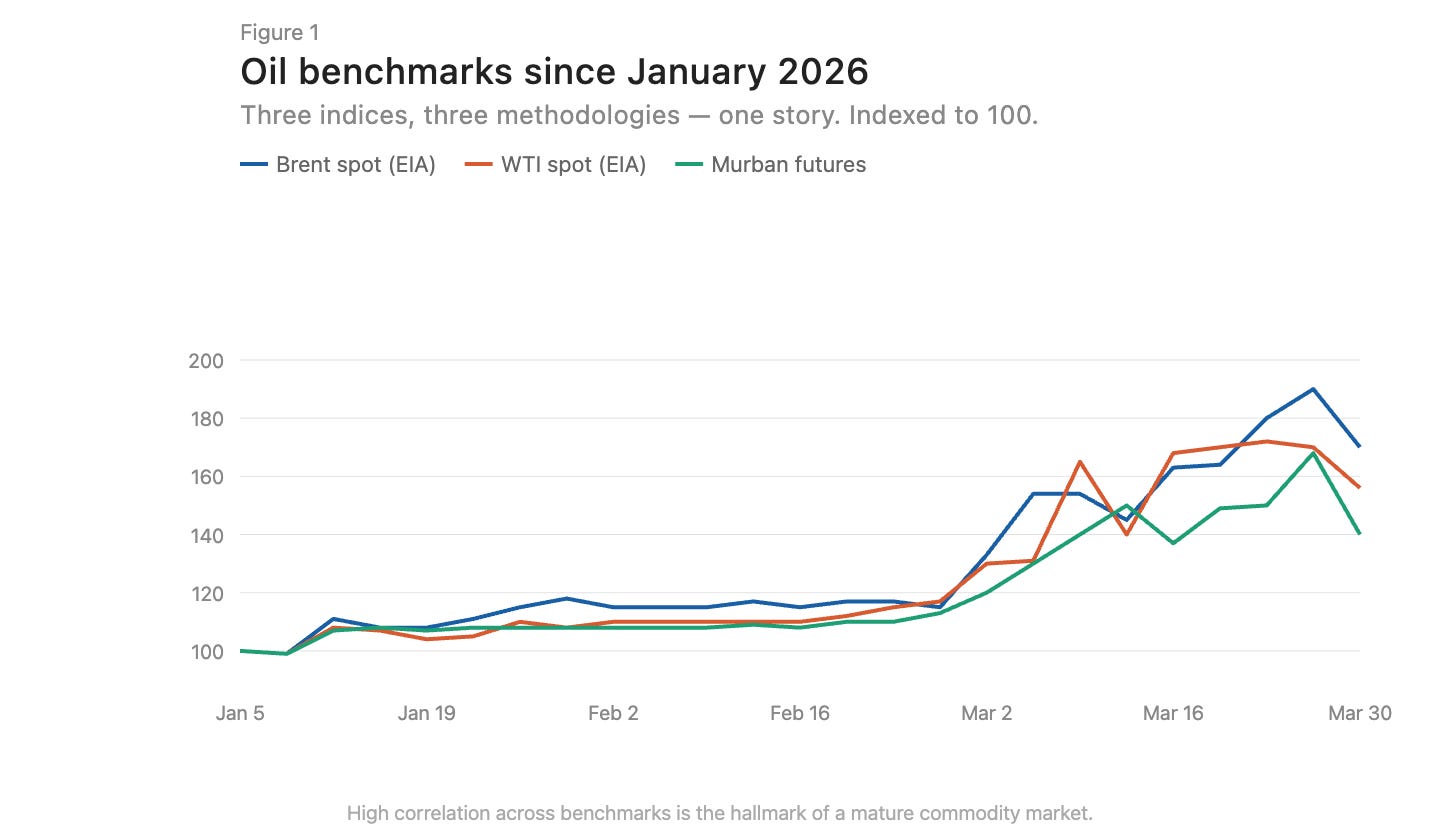
Figure Caption: Comparison of Brent and WTI crude oil price trends, highly consistent in direction
Now there are three GPU pricing index providers on the Bloomberg terminal: Silicon Data, Ornn AI, and Compute Desk. SemiAnalysis has just released a fourth— a monthly H100 one-year contract price index constructed from survey data of over 100 market participants. Silicon Data and Ornn publish daily H100 rental indices; Compute Desk aggregates data at the Hopper architecture level; SemiAnalysis captures post-negotiation contract prices rather than quoted or crawling prices. The methodologies differ, the frequencies differ, and the insights into the same market also differ. When viewed together, the divergences are glaringly apparent (Figure 2).
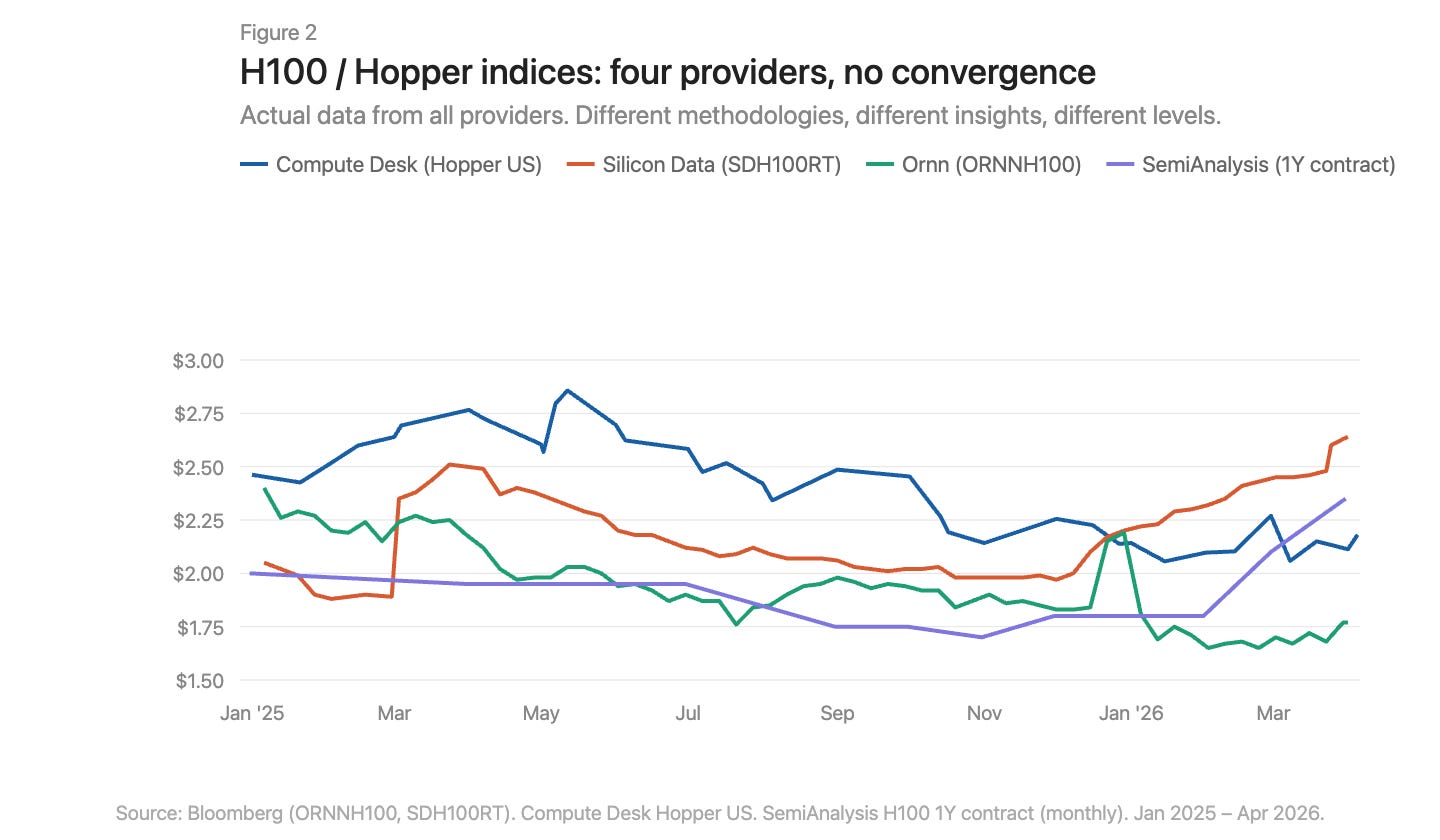
Figure Caption: Overlay comparison of four GPU indices, with明显的价格水平和趋势缺乏一致性
Where Are the Price Increases Happening?
Using Compute Desk data, we can break down the price changes for H100 by vendor type and contract structure, overlaying Silicon Data's SDH100RT index (Figure 3). All indicators show that prices are rising, but the starting points and magnitudes differ greatly depending on the index and contract type.
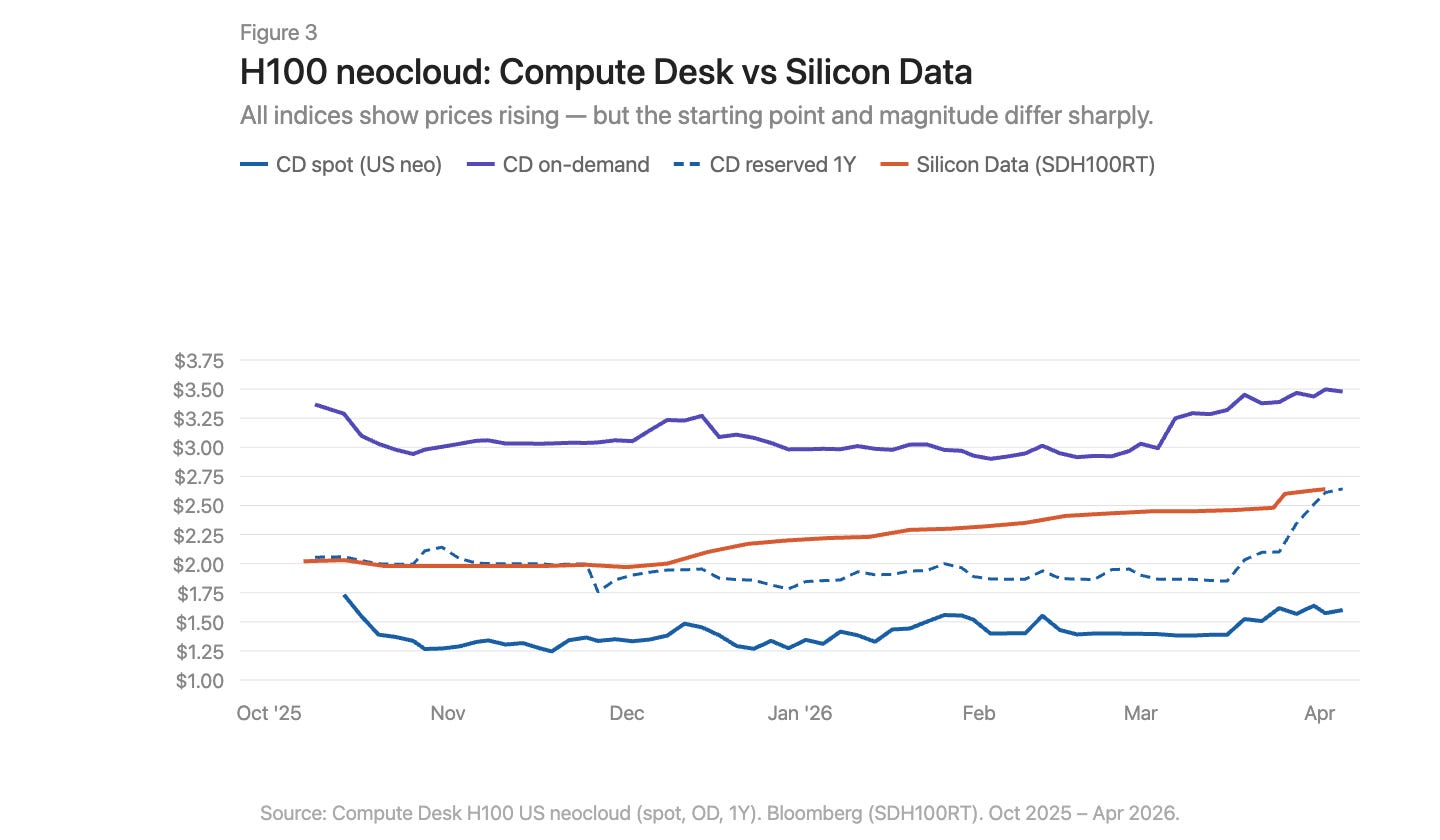
Figure Caption: H100 price trends split by contract type overlaid with SDH100RT index
Compute Desk's H100 new cloud (neocloud) data tells a more specific story than the aggregated indices. On-demand pricing remained relatively stable throughout the winter at about $3.00/hour, then sharply surged to $3.50 in March. Spot pricing was noisier and lower, showing a slight upward trend until March. Silicon Data's SDH100RT showed a smoother steady increase, rising from $2.00 to $2.64 during the same period. The two indices consistently occupy different price points, and their descriptions of the timing discrepancies differ: Compute Desk talks about a surge in March, while Silicon Data mentions a slow climb.
One-year reserved pricing remained relatively flat until February, then suddenly jumped from $1.90 to $2.64 at the end of March—not a gradual catch-up, but a sudden repricing. This resembles suppliers centrally adjusting contract rates after tightening demand in the on-demand market, rather than being driven by ongoing structural demand.
The March story of B200 is even more intense (Figure 4). Compute Desk’s on-demand index surged from $5.70 to over $8.00 within weeks. Silicon Data's SDB200RT spiked from $4.40 to $6.11 before falling back to $5.47. Both indices recorded this wave of price change, but they started over $2 apart, and the shapes of the increases and declines differ. B200 has less than five months of data, fewer vendors, and greater price variations; the two indices are observing the same event through very different lenses.
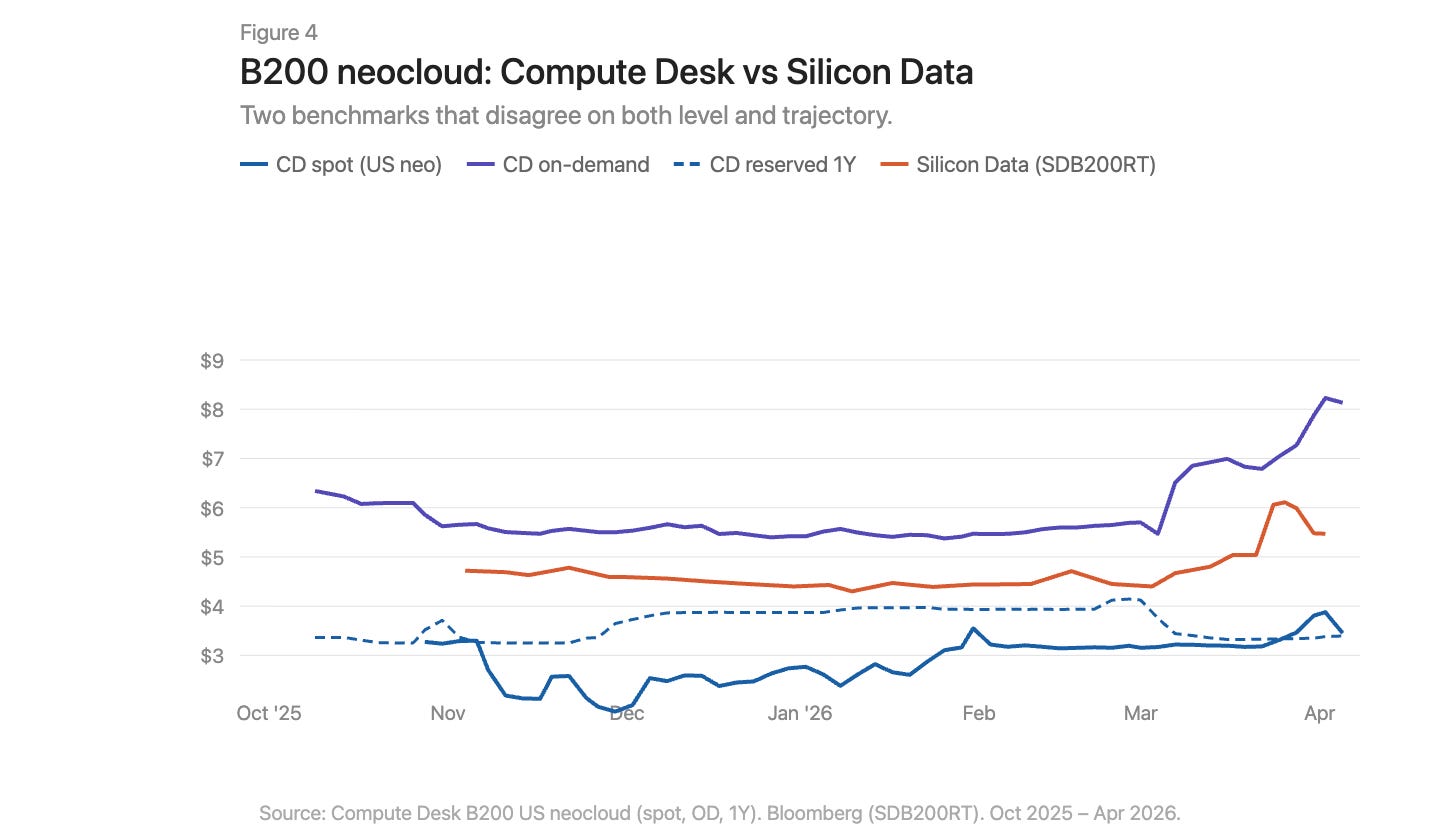
Figure Caption: B200 on-demand and reserved price trends, overlay of Compute Desk and Silicon Data data
Infrastructure Issues, More Than Just Geographic Differences
Commodity markets experience basis differentials. Appalachian natural gas is a textbook case: massive reserves are sitting above structurally constrained pipeline capacity, with utilization rates in the Pennsylvania-Ohio corridor often exceeding 100%, and new projects like the Borealis Pipeline will not come online until the late 2020s.
The GPU market has similar situations: an H100 in Virginia and an H100 in Frankfurt are not the same economic commodity. But geographic differences alone cannot explain why the divergences among indices measuring the same market are so vast. The misalignment in the GPU market is deeper than that seen in Appalachian natural gas. The issue with natural gas is a singular missing link: pipeline capacity connecting both supply and demand sides. The infrastructure gap in the computing power market exists on both sides of supply and demand. The physical infrastructure—a consistent network, predictable configurations, and predictable availability required for reliable distribution of computing power—is still immature, and sometimes outright ineffective. The financial infrastructure—standardized contracts, transparent benchmarks, and arbitrage mechanisms that could compress price differentials despite physical disparities—also does not exist.
Data tells a story. The real experience of trying to procure computing power in early 2026 tells an even more painful story. All on-demand capacity for all GPU types is actually sold out. Finding 64 H100s is challenging: Compute Desk shows 90% of vendors have zero on-demand cluster availability, and the reserved market is no better. In a well-functioning market, such a degree of scarcity would have pushed prices to a new equilibrium long ago. But that is not the case. This indicates that suppliers themselves also lack real-time pricing intelligence to adjust. Prices are rising, but too slowly, not enough to clear the market. The gap between quoted prices and actual willingness to pay is being filled by hoarding, subletting, and informal secondary market trades.
What Needs to Change?
There are seven core issues currently in the GPU computing power market:
No consensus benchmark. Multiple indices coexist, with varying methodologies and contradictory conclusions.
The aggregated narrative obscures the structure. A single number for "H100 price" hides the vast differences between different types of vendors and contract durations.
Lack of trading-level data. In a bilateral market, the deviation between quoted prices and actual transaction prices is very large.
No contract standardization. Most GPU rentals are bilateral negotiations with varying terms. Shorter, more standardized contract durations could improve liquidity and price discovery.
No assurance of delivery quality. Interconnection topology, CPU pairing, network stack, and runtime vary greatly. Buyers need to know what quality of computing power they are purchasing before making a commitment.
Contracts lack liquidity. If demand changes during the reserved period, options are very limited: either absorb the costs or informally sublet. The market needs infrastructure that allows the transfer or resale of committed computing power to direct capacity to those who need it most.
No forward curves. Without the ability to provide forward pricing, hedging becomes impossible. This is why lenders discount GPU collateral by 40%-50% and financing costs remain high.
Establishing a functioning market for the most important commodity of this century cannot rely on advancing just one line. Measurement, standardization, contract structure, delivery quality, liquidity—all of these must progress in sync; until then, no one can truly articulate what a GPU hour is worth.
免责声明:本文章仅代表作者个人观点,不代表本平台的立场和观点。本文章仅供信息分享,不构成对任何人的任何投资建议。用户与作者之间的任何争议,与本平台无关。如网页中刊载的文章或图片涉及侵权,请提供相关的权利证明和身份证明发送邮件到support@aicoin.com,本平台相关工作人员将会进行核查。


