4.21 Solana SOL’s short-term direction is unclear, where is the breakout opportunity after the Bollinger Bands have narrowed?
The current price of Solana is 85.7. Has it been repeatedly oscillating in a tough spot recently? When it rises a bit and you chase in, it falls; when it drops a bit and you short in, it rises. You can’t figure out the direction at all? Today, I will directly break down the market details for the daily and 4-hour charts. Along with the stop-loss levels for both long and short positions, I will lay it all out for you, so after reading, you will know how to operate next without any guesswork!
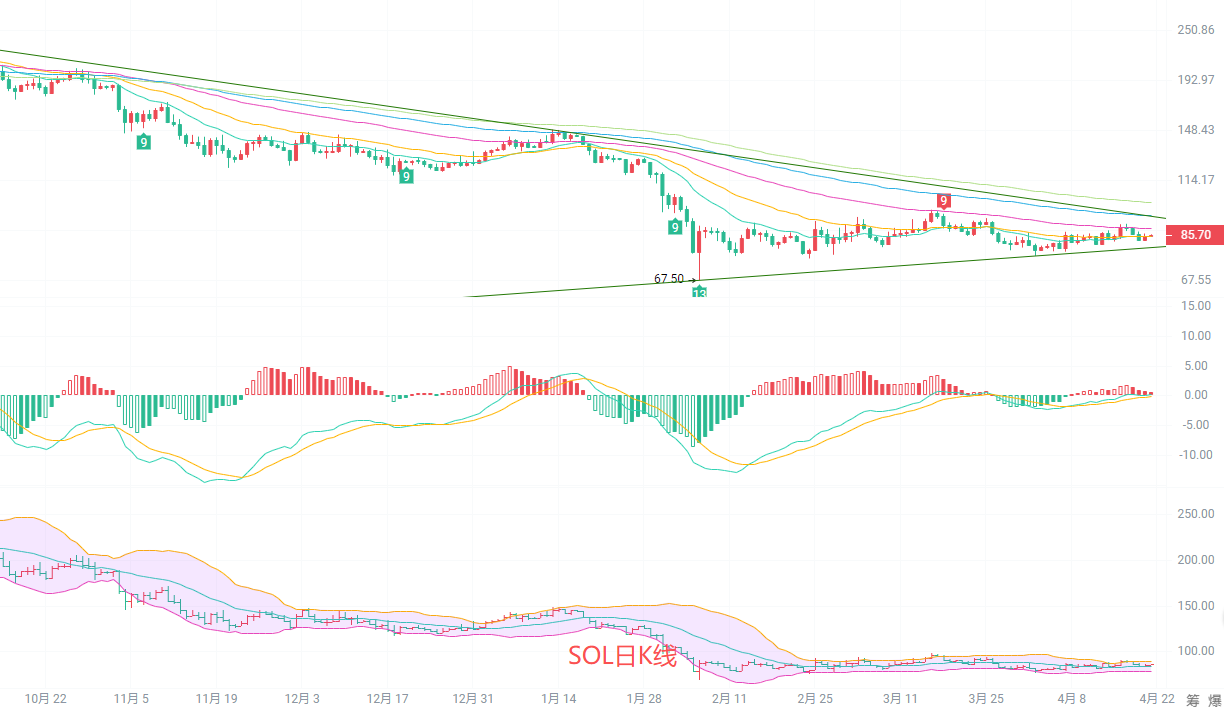
On the daily chart, it is in a weak recovery stage after a decline. The short-term moving averages EMA15 and EMA30 are flat, with prices oscillating near the moving averages, while long-term moving averages are still in a bearish arrangement, and the overall trend has not reversed yet. The MACD indicator shows DIF and DEA crossing near the zero axis, with weak red bars, and bulls and bears are stuck in a tug-of-war; the Bollinger Bands are continuously narrowing, with a range of 78.5-89.3, indicating a high probability of a breakout with increased volume soon.
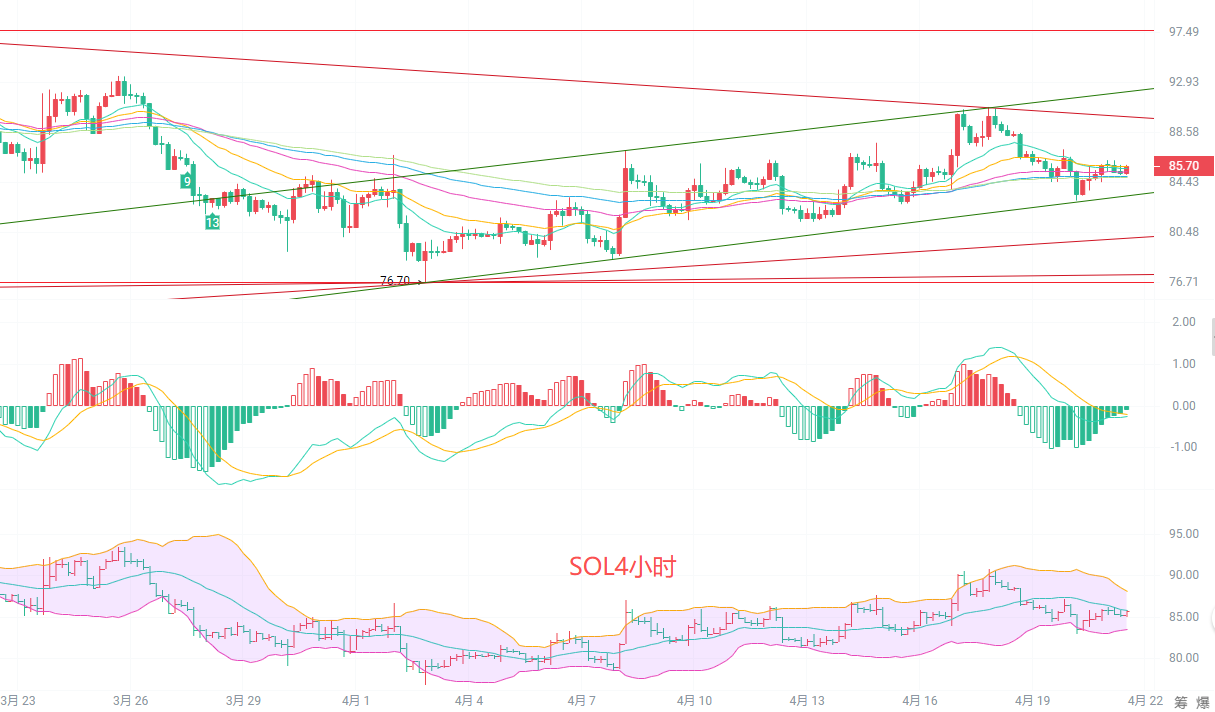
On the 4-hour chart, it has been repeatedly oscillating within the range of 83.5-88, with EMA moving averages overall converging and flattening out, showing clear oscillation characteristics. The MACD indicator shows DIF and DEA below the zero axis, with green bars continuously shortening, indicating a gradual weakening of bearish momentum, with signs of a potential turning point; the middle Bollinger Band at 85.7 nearly coincides with the current price, and the upper and lower bands are continuously narrowing, making the short-term direction unclear, waiting for confirmation of a breakout signal.
Entry points for longs and shorts
Below: Long at 83.5-83, stop-loss at 81.8, target at 87.5-88, breakout target at 90-91
Above: Short at 88-88.5, stop-loss at 89.3, target at 84-85, breakdown target at 82-83
This kind of oscillating market is really exhausting, I've seen too many people getting hurt from chasing rises and falls. Instead of randomly opening positions, it’s better to wait for a breakout and then follow the trend. Right now, market sentiment is cautious, with Bitcoin not moving, thus SOL struggles to trend independently as well. Let’s maintain key positions, not be greedy, and just earn the money we understand. Don’t let the market’s emotions lead us around.

Friendly reminder: The above content is solely created by the author’s public account. The advertisements at the end of the article and in the comments section are unrelated to the author. Please discern carefully, thank you for reading.
免责声明:本文章仅代表作者个人观点,不代表本平台的立场和观点。本文章仅供信息分享,不构成对任何人的任何投资建议。用户与作者之间的任何争议,与本平台无关。如网页中刊载的文章或图片涉及侵权,请提供相关的权利证明和身份证明发送邮件到support@aicoin.com,本平台相关工作人员将会进行核查。