Author: RootData Research
- In Q1 2026, the total amount of financing in the cryptocurrency primary market reached $4.59 billion, a quarter-on-quarter decrease of 46.7%. The total number of financing events was 170, a quarter-on-quarter decrease of 14.2%
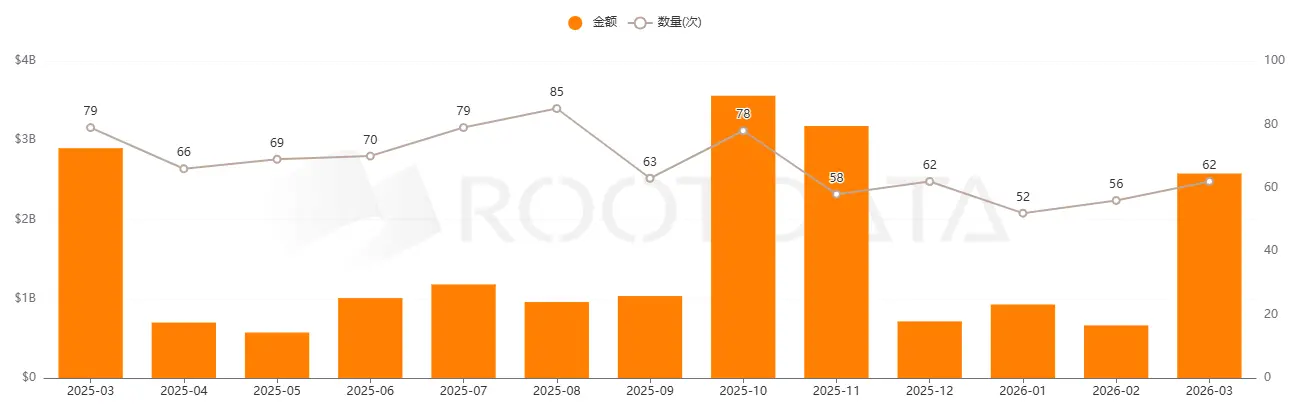
- Monthly funding is highly concentrated, with March’s single month funding amount of $2.58 billion (accounting for 56.2% of Q1), and the median is $8 million, which reflects the core indicator of the true market benchmark.
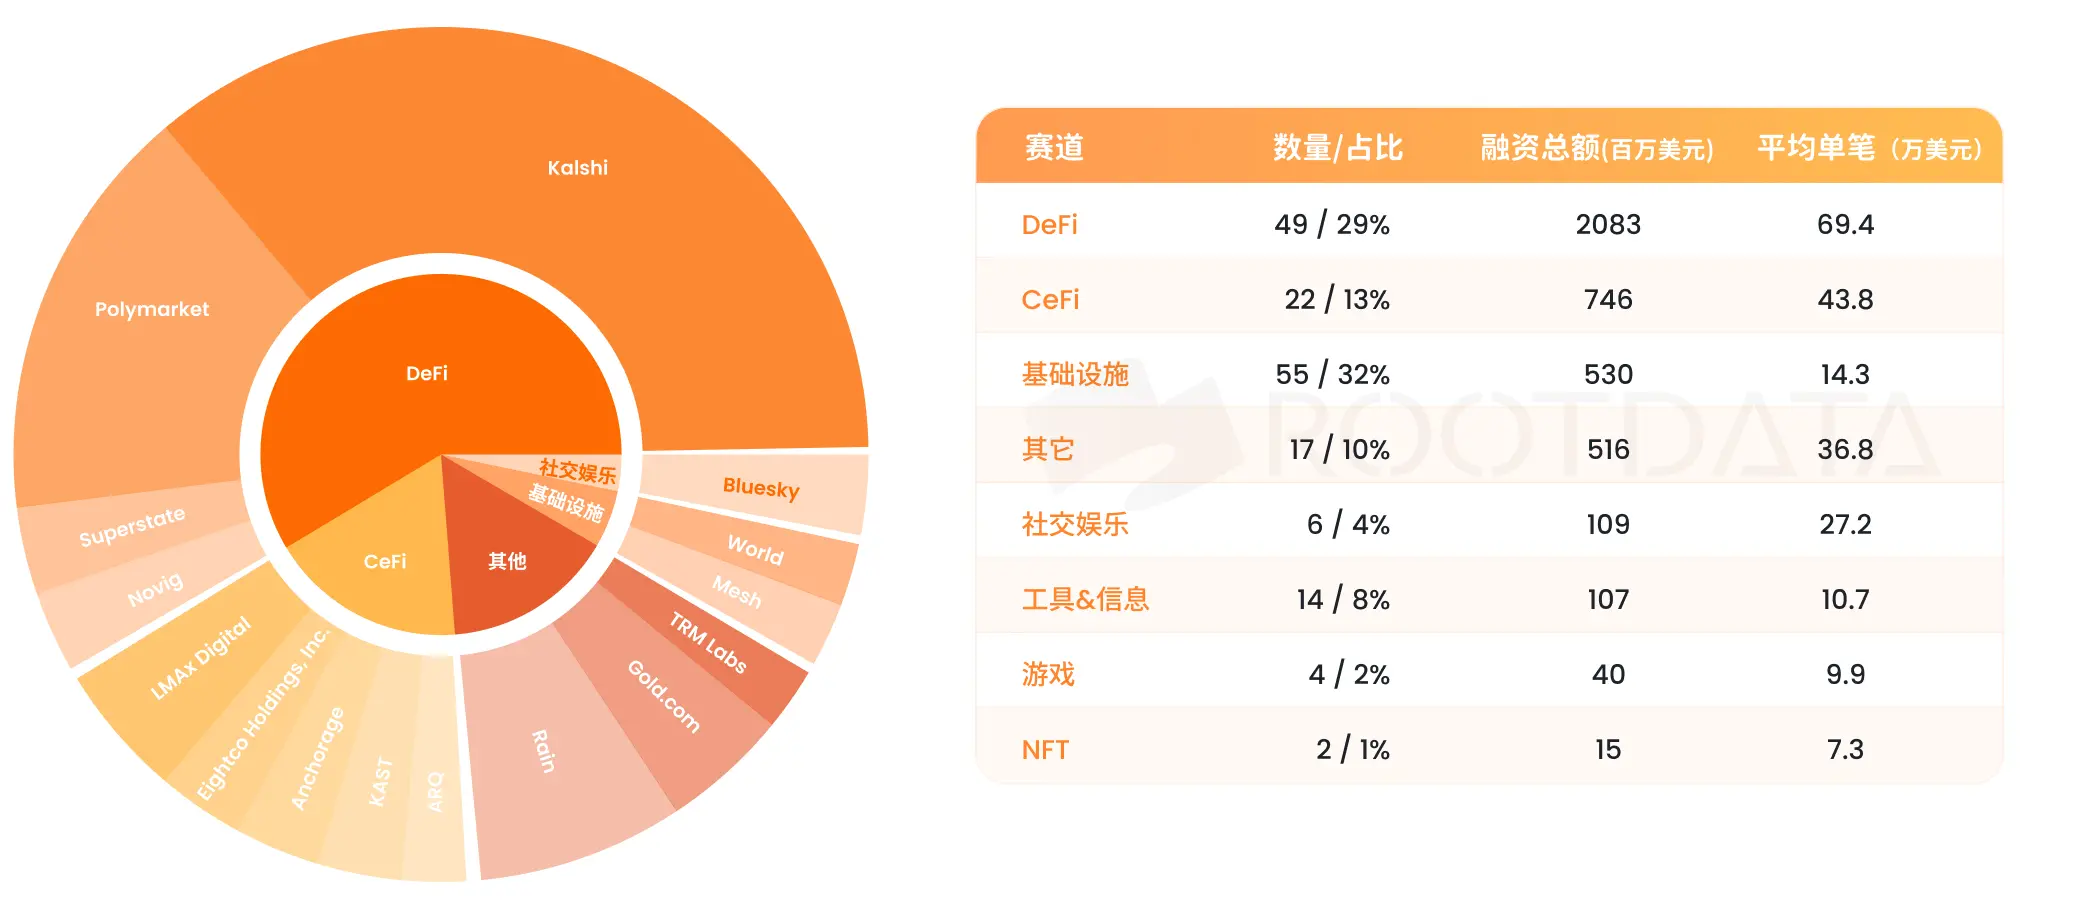
- DeFi surpassed CeFi for the first time with $2.083 billion, accounting for 68.4% of the total; the infrastructure had 55 events leading in quantity but with an average of only $1.431 million.
- This quarter saw a total of 38 merger events, with disclosed amounts of $2.302 billion (dominantly from BVNK at $1.8 billion), and an additional 31 undisclosed amounts.
- Coinbase Ventures led the market with 12 investments; Franklin Templeton (4 times) emerged as a new high-frequency institution this season, signaling traditional asset management giants with clear systemic layout.
- In terms of ecological financing, BNB Chain (17 events), Ethereum (14 events), and Solana (14 events) are in a three-way competition, with Base (9 events) seeing the fastest growth, and Hyperliquid (6 events) being the biggest dark horse in the emerging ecosystem.
Total Financing and Monthly Distribution
Overview of the Web3 Primary Market Financing
In Q1 2026, the total amount of financing in the cryptocurrency primary market was $4.59 billion, totaling 170 financing events, which were quarter-on-quarter decreases of 46.7% and 14.2%.
At the monthly level, the structural characteristic of “steady amount, explosive growth” is very prominent, with a highly balanced number of events in the three months (52→56→62 events), but the total financing amount skyrocketed from $926 million to $644 million, then to $2.58 billion, with a standard deviation of $840 million, reflecting that the super projects in March significantly pulled overall data.
The average financing amount is about $36 million, which is 4.4 times the median financing amount of $8 million, revealing the extreme power law characteristics of this quarter's financing distribution: a few ultra-large projects raised the average financing amount, but the real financing level in the market should be based on the median.
Track Financing Analysis
The track pattern has undergone structural reshaping: DeFi for the first time surpassed CeFi ($746 million) becoming the top track, driven by two large investments led by the predictions market in TradFi. The infrastructure had 55 events (32%) in the first place in terms of the number of events, but the average was only $1.431 million — a 4.9 times difference compared to DeFi's average of $6.945 million, clearly revealing two vastly different capital pricing logics.
DeFi: Prediction Market Leads the Trend towards TradFi
Among the 49 events in DeFi track, Kalshi ($1 billion) and Polymarket ($600 million) accounted for 76.8% of the total DeFi amounts. The financing parties of both are traditional financial institutions (Coatue Management / Intercontinental Exchange ICE), marking a structural shift of the DeFi application layer from VC-driven to TradFi-capital-led.
Among the remaining 47 events, the total financing was $483 million, with an average of about $10.28 million, verifying the dual-peak structure of DeFi ecology: "concentration of top super narratives at the top, dispersion of early projects at the bottom." Superstate ($82 million/B Round) represents a notable trend signal of differentiation within the DeFi sub-track in the Top 10.
CeFi: Mergers and Acquisitions Dominated and Pure Equity Financing Reached $746 million
After excluding mergers and acquisitions, CeFi had 22 events and $746 million in pure primary financing, with an average of $43.88 million, which is 0.63 times that of DeFi's average. Representative projects include: LMAX Digital ($150 million/Ripple investment), Eightco Holdings ($125 million/BTC reserve strategy), Anchorage ($100 million/Tether staking compliance custody), KAST ($80 million/QED + Sequoia Capital + DST Global).
The narrative core of the CeFi track has shifted from "scale" to "compliance quality" — after BitGo set the compliance milestone for the IPO, high transparency and regulated CeFi service providers have become core targets for institutional capital.
Infrastructure: High Frequency, Small Amounts, 55 Events Lead but Lowest Average
The infrastructure track had 55 events (accounting for 32% of all events), which is the highest number of events, but the average was $1.431 million, the lowest. This is not a sign of capital abandonment but an objective reflection of its long commercialization path and verification cycle: VCs tend to participate in multiple small seed rounds rather than make a single high-valuation bet.
Notably, World (WLD) OTC financing ($65 million, the only OTC event this season) and Startale Labs ($63 million/Sony Innovation Fund) are the two largest in this track, raising the overall average; excluding these two events, the median in infrastructure is only about $5 million.
Analysis of Financing Round Structure
After excluding mergers/debt financing/IPO/Post-IPO events, the distribution of rounds for the 170 events reveals a pattern of “early hot, mid-cool, strategic active”: Pre-Seed + Seed total is 52 (30.6%) maintaining the highest frequency; A/B rounds total<|vq_647|>
免责声明:本文章仅代表作者个人观点,不代表本平台的立场和观点。本文章仅供信息分享,不构成对任何人的任何投资建议。用户与作者之间的任何争议,与本平台无关。如网页中刊载的文章或图片涉及侵权,请提供相关的权利证明和身份证明发送邮件到support@aicoin.com,本平台相关工作人员将会进行核查。


