Dear friends, I am Sister Qinglan. Today, the market sentiment is indeed a bit cold, and there are two key news items worth paying attention to. First, Bitcoin ETF funds reversed, and before the Federal Reserve meeting, the market turned cautious, which directly led to a break in the flow of funds and short-term bulls lost support. Second, after BTC fell below 77,000 US dollars, funding rates on both CEX and DEX turned bearish, indicating extremely pessimistic market sentiment, and leveraged bulls are passively exiting. These two negative factors combined set a bearish tone for the current market situation. In Qinglan's crypto classroom, we repeatedly emphasize that macro sentiment and fund flows are leading indicators of trends, and both signals are currently pointing to downward pressure.
Current Price and Time
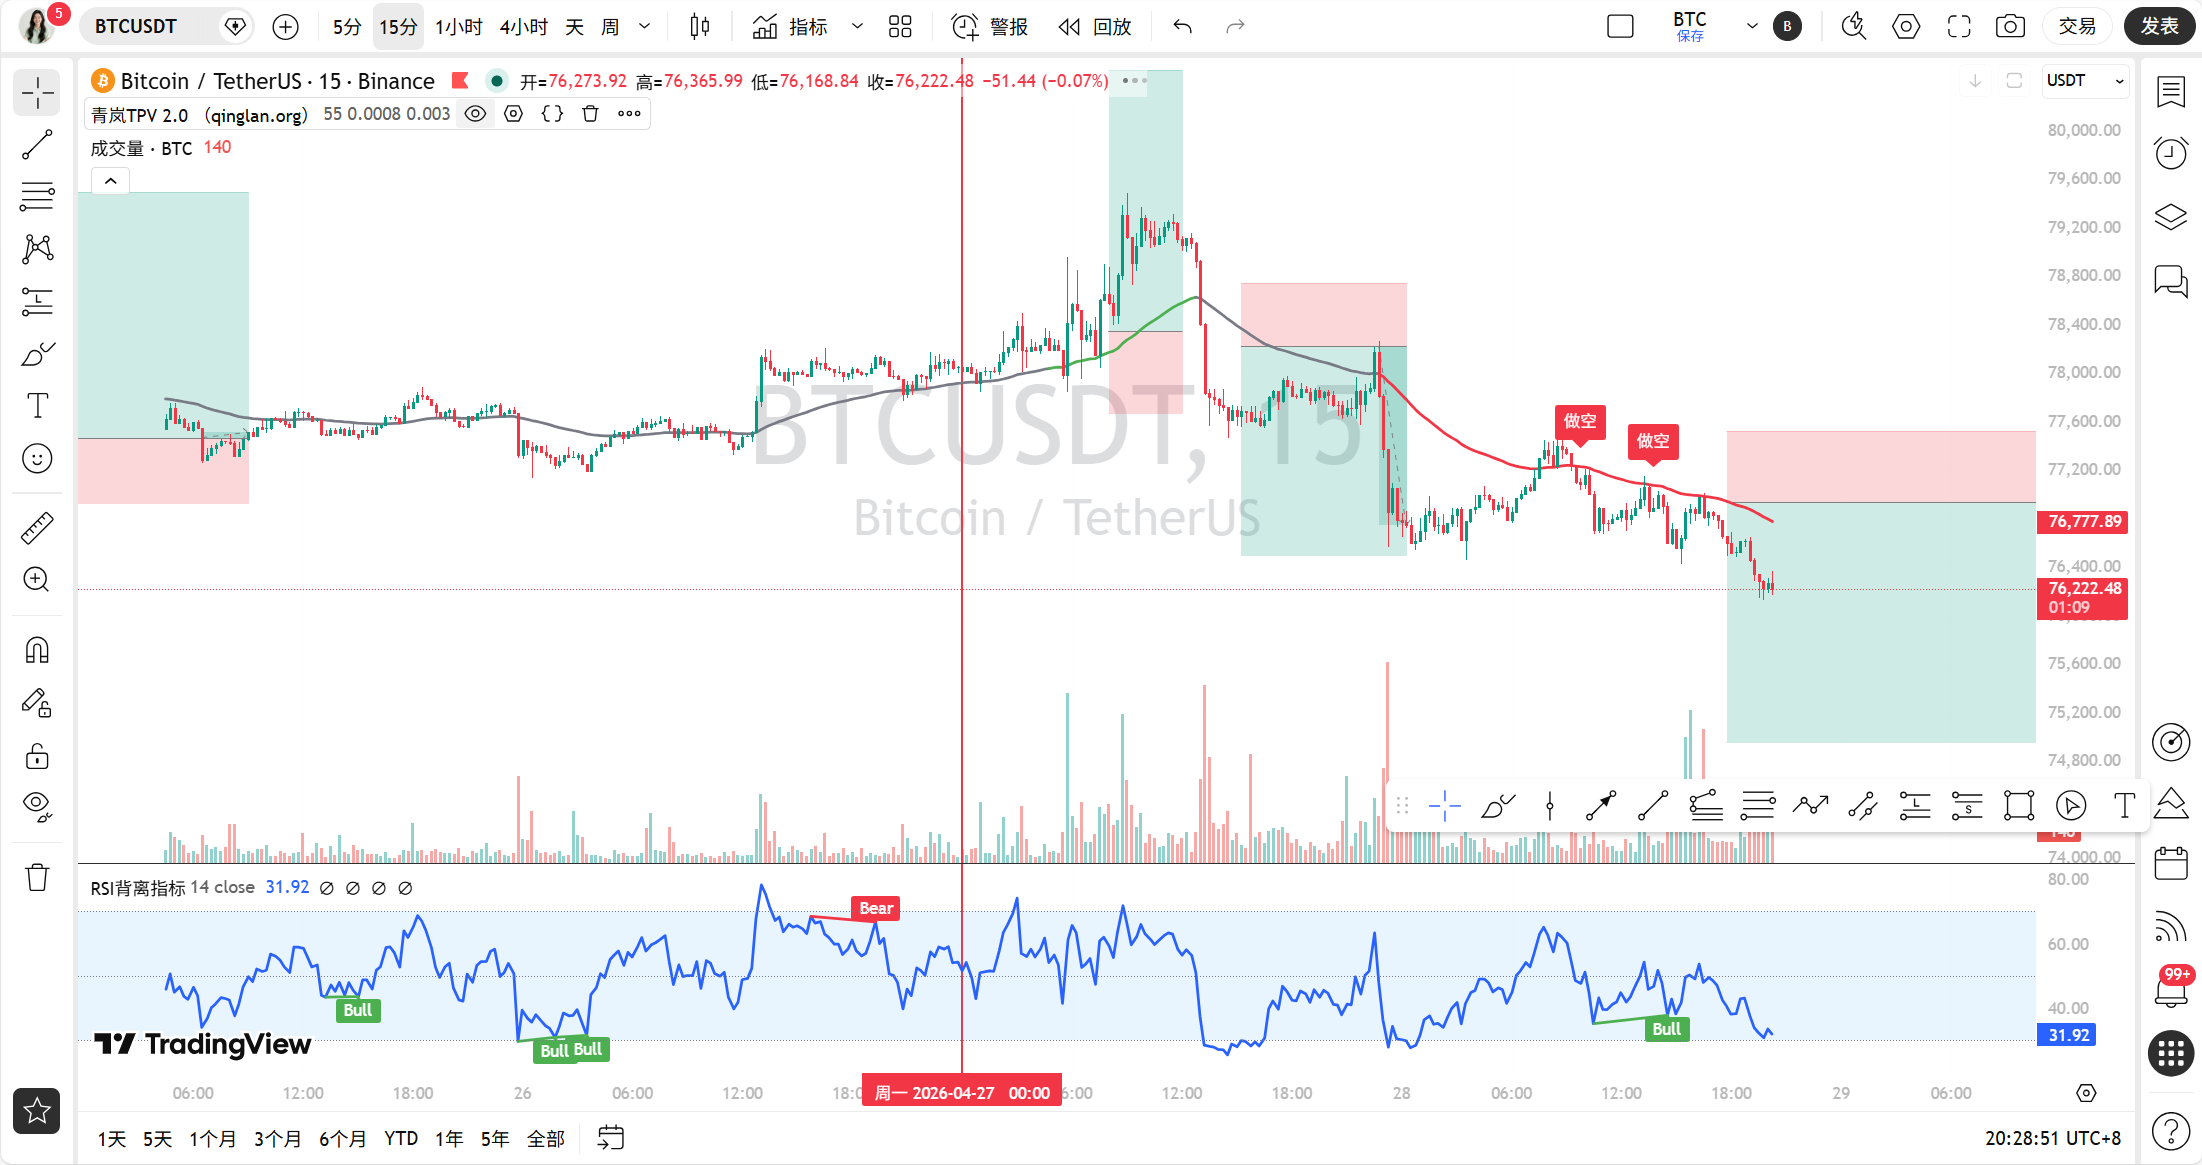
The current time is April 28th, 20:24, with the latest quotation for BTC at 76,234 USDT, a 24-hour decline of 1.94%. The price has fallen below the key level of 77,000 US dollars, entering a recent low area. From the chart, bearish momentum is being released, and we need to use data to verify the next direction.
Multi-Cycle Status Overview
First, let's look at the daily level. Daily MA5=77,464.98, MA10=76,973.95, MA30=73,159.88. The MACD shows a death cross, with DIF=1,859.51, DEA=1,890.57, and a histogram value of -31.06, which is a clear bearish signal. RSI=56.95, although still in the neutral area, has already retreated from the high. The daily chart shows an adjustment pattern after a high-level death cross, with short-term moving averages MA5 and MA10 forming resistance.
At the 4-hour level. 4-hour MA5=76,705.74, MA10=77,175.62, MA30=77,604.93. The MACD DIF=-253.48, DEA=-32.53, with a histogram value of -220.95, showing continued amplification of bearish momentum. RSI=33.75, close to the oversold area, but has not yet formed an effective rebound. The 4-hour moving average system presents a bearish arrangement, with prices operating below all moving averages.
At the 1-hour level. 1-hour MA5=76,507.57, MA10=76,672.64, MA30=77,078.94. The MACD DIF=-311.22, DEA=-275.60, with a histogram value of -35.62, and bearish momentum is still being released. RSI=28.91, which has entered the oversold area. EMA55=77,319.68; the current price of 76,234 is far below this line, with a deviation of 1.40%.
At the 15-minute level. 15-minute MA5=76,273.68, MA10=76,410.68, MA30=76,680.77. The MACD DIF=-156.93, DEA=-117.81, with a histogram value of -39.12, indicating sustained bearish momentum. RSI=15.64, extremely oversold, and a technical rebound may occur in the short term, but the strength is in doubt.
TPV Signal Verification
According to the Qinglan TPV system, we use the 1-hour EMA55=77,319.68 as the demarcation line for bullish and bearish positions. The current price of 76,234 is far below EMA55, and in the past 8 1-hour candlesticks, the number of closing prices greater than EMA55 is 0, and the crossing count is 0, which completely conforms to the determination of a bearish trend area.
Short-selling condition verification: First, the price is under pressure below the 1-hour EMA55, and the closing prices of two consecutive 1-hour candlesticks are below EMA55, which has been met. Second, the pressure resistance pattern, from both the 4-hour and 1-hour candlesticks, shows that the price has encountered resistance and retreated multiple times in the 77,000-77,500 area, forming a clear top formation structure. Third, weak rebound, with MACD bars shortening continuously across multiple cycles, and RSI sluggishly rebounding from 28.91, indicating insufficient rebound momentum. All three conditions are met, and the TPV system gives a clear bearish signal.
Oscillation auxiliary data shows that the current price's absolute distance from EMA55 is 1.40%, which does not meet the oscillation threshold, with the market in a one-sided bearish trend. In Qinglan's crypto classroom, we emphasize that trading in oscillating markets is not recommended, but one-sided trends should be decisively followed.
On-chain/Fundamentals
On-chain data shows the fear and greed index at 33, indicating the market sentiment is extremely pessimistic. BTC market share is 57.98%, still relatively high, but funding rates are completely bearish, showing that leveraged bulls are being forced to liquidate. ETF fund outflows and uncertainties before the Federal Reserve meeting further depress short-term buying interest. In addition, ETH whales face liquidation risks, which could trigger a chain reaction that drags down BTC. The negative factors from soaring oil prices are also fermenting, putting overall pressure on risk assets.
Key Support and Resistance Levels
The current bearish trend is clear, with the key resistance level at 1-hour EMA55=77,319.68, which serves as the demarcation line for bullish and bearish positions. If the price rebounds to this area, it may create new short-selling opportunities. The support level below to watch is the 75,000 key level, which is the previous low area; if it breaks, it may accelerate down to the 73,000-74,000 range. Short-term support is around 76,000, but the strength is relatively weak.
Trading Strategy
Based on the bearish signals from the TPV system, the current focus is on short-selling, not buying.
Direction: Short.
Entry Conditions: Wait for the price to rebound to the 77,000-77,300 area and confirm resistance before entering. Specific Conditions: The price rebounds to around the 1-hour EMA55, showing long upper shadows or top formations, and the MACD bars expand again. If the price breaks directly below 76,000, consider pursuing the shorts, but position must be controlled.
Stop Loss: Set above 77,550, which indicates that if it breaks above EMA55 and stabilizes, the bearish signal is invalidated.
Target Levels: First target at 75,000, second target at 74,000. If it breaks below 75,000, watch for 73,000.
Risk Warning
In a one-sided bearish trend, be wary of technical rebounds after oversold conditions when pursuing shorts, strictly implement stop losses, and control positions to no more than 5% of total funds.
Follow Qinglan's crypto classroom to seize more trading opportunities! Welcome to visit the official website www.qinglan.org
📊 Qinglan TPV Trading Strategy Backtest Reference
🕒 Last Backtest Time April 28th 07:00:02
Total Analysis: 1147 Backtests: 1141 Accuracy Rate: 70% (799/1141)
免责声明:本文章仅代表作者个人观点,不代表本平台的立场和观点。本文章仅供信息分享,不构成对任何人的任何投资建议。用户与作者之间的任何争议,与本平台无关。如网页中刊载的文章或图片涉及侵权,请提供相关的权利证明和身份证明发送邮件到support@aicoin.com,本平台相关工作人员将会进行核查。