Dear friends, I am Sister Qinglan. This morning, two significant news events directly triggered the market's nerves. On one hand, Pump.fun announced the destruction of PUMP tokens valued at 370 million USD and launched a 50% revenue buyback plan, which is a strong supply-side positive, directly boosting market confidence in altcoins and the DeFi ecosystem. On the other hand, the Iranian Revolutionary Guard claimed control of the Strait of Hormuz and demanded passing vessels to pay a toll, suddenly escalating geopolitical risks, dampening sentiment towards risk assets. These two forces, one bullish and one bearish, led to a slight fluctuation in Bitcoin after it broke through 76,000 USD. The current market is at a critical juncture of long and short play, and we need to use data to dissect the real structure.
Current price and time
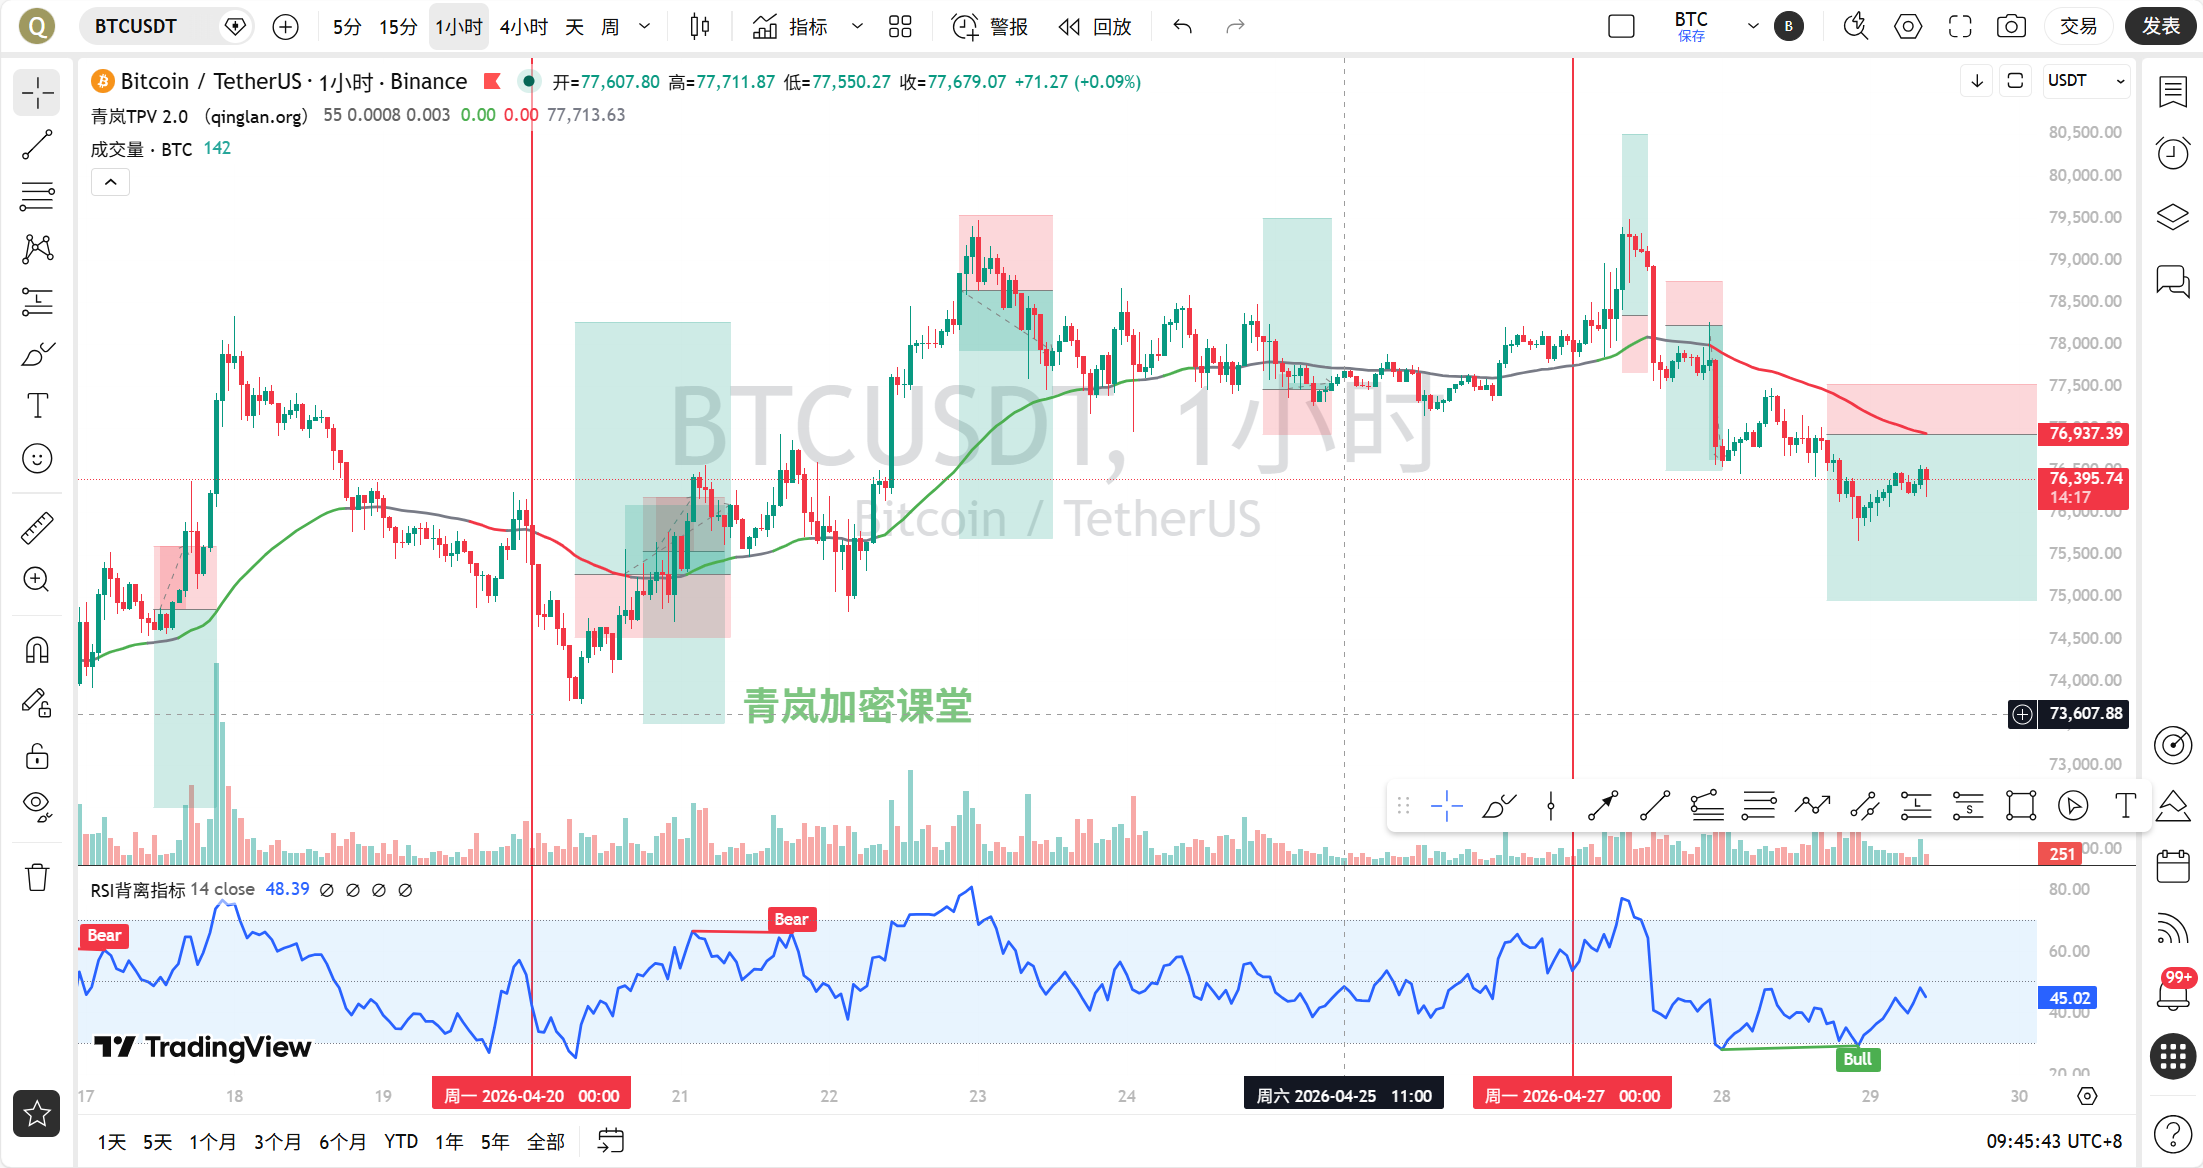
The current time is April 29, 09:36, with the latest Bitcoin quote at 76,310 USDT. The decline within 24 hours is 1.33%, and the fear and greed index is only 33, which is in the fear range. This indicates that market sentiment is cautious, but the price has not shown panic selling, instead gaining support around 76,000 USD. We need to locate the current trend from a multi-cycle perspective.
Multi-cycle status overview
On the daily level, MA5 and MA10 are at 77,261 and 77,235, respectively, with prices clearly under pressure below these two moving averages. The MACD histogram is negative, with the DIF crossing below the DEA and continuing to weaken; RSI is at 55.22, in a neutral to weak area. The daily chart overall exhibits a consolidation pattern after a high retreat, with insufficient bullish momentum, but the bearish side has not formed an overwhelming advantage.
On the 4-hour level, MA5, MA10, and MA30 are arranged in a bearish order, with prices struggling around 76,255. The MACD histogram is -168.57, with the DIF and DEA expanding after a dead cross; RSI is only 34.05, close to the oversold area. The bearish momentum on the 4-hour level is strong, but RSI indicates that short-term overselling may trigger a rebound.
On the 1-hour level, EMA55 is at 76,916, and the current price of 76,310 is clearly below this line. MA5 and MA10 are conjoined around 76,352 and 76,311; the MACD histogram is 59.00, and although DIF and DEA are still negative, the histogram is continuously shortening, indicating that the downward momentum is waning. RSI is at 52.28, returning to a neutral area. The 1-hour level is in a rebound repair phase under a bearish trend.
On the 15-minute level, MA5, MA10, and MA30 are intertwined around 76,363, 76,339, and 76,317; the MACD histogram is -7.54, with DIF and DEA close to the zero axis but not forming a golden cross; RSI is at 47.02, in a neutral to weak area. Short-term long and short forces are balanced, with no clear direction.
TPV signal validation
According to the Qinglan TPV system, we use the 1-hour EMA55 as the dividing line between longs and shorts. The current price of 76,310 is far below the EMA55 of 76,916, and in the last 8 1-hour candlesticks, the number of times the closing price was above EMA55 is 0 and the number of times it crossed is also 0, with the absolute distance from EMA55 being 0.79%, not meeting the volatility threshold. Therefore, the current market is in a clear bearish trend area.
Regarding shorting conditions, the first condition that the price is under pressure below the 1-hour EMA55 has been met. The second condition of pressure meeting resistance needs observation of recent highs. From the 4-hour chart, prices have formed clear resistance in the 76,800-77,000 area, and 1-hour candlesticks have frequently shown long upper shadows in this area, fitting the top distribution characteristic. The third condition of a weak rebound: although the 1-hour MACD histogram has been shortening continuously, DIF and DEA are still negative, and RSI has retreated from 52.28, not forming an effective breakthrough. In summary, the bearish trend is complete, the rebound strength is insufficient, and shorting conditions are established.
Regarding long conditions, the first condition that the price remains above EMA55 is not met. The current price is far below this line and shows no signs of stabilizing. Therefore, long conditions are not established, and proactive long positions are not recommended.
On-chain/fundamental analysis
In terms of on-chain data, a fear and greed index of 33 indicates that market sentiment is extremely fearful, which is often a window period for large funds to accumulate. Bitcoin's market share is 57.97%, at a relatively high position, indicating that funds are still seeking refuge in Bitcoin, but altcoin positive events may trigger capital outflows. In key news, the Matrixport whale leveraged 15 times to go long on 30,000 ETH and is floating a profit of 59 million USD, showing institutional confidence in ETH, but Fidelity has deposited nearly 20,000 ETH into Coinbase, bringing selling pressure. Overall, the on-chain capital landscape is mixed, with no collective force formed.
Key attack and defense levels
The first resistance level above is at 76,916, where the 1-hour EMA55 is located; this is the lifeline of the bearish trend. If the price rebounds to this level and meets resistance, it will be an ideal entry point for shorting. The second resistance levels are at 76,601, where the 4-hour MA10 is located, and at 77,261, where the daily MA5 is. The first support level below is at the 76,000 integer level, the low point of the 4-hour chart, and the second support level is at 73,480, where the daily MA30 is located. The current price is fluctuating in the range of 76,000-76,916; the breakthrough direction will determine the short-term trend.
Trading thoughts
Direction: Bearish preference, waiting for a rebound to short opportunities.
Entry conditions: Wait for the price to rebound near the 1-hour EMA55, around the 76,900-77,000 area, while observing whether the 1-hour candlestick shows a long upper shadow or top distribution pattern. If the MACD histogram begins to shorten during the rebound, and RSI falls back from above 50, it confirms the weakness of the rebound and can enter a short position.
Stop-loss position: Set above 77,200, near the daily MA5. If the price breaks through 77,200, the bearish structure may be disrupted, requiring reassessment.
Target levels: The first target level is 76,000, which is the support of the previous lows. If it breaks, the second target looks at 75,000, and the third target looks at 73,480, where the daily MA30 support is located.
Risk warning
Escalating geopolitical risks may trigger risk aversion, causing Bitcoin and gold to decline simultaneously; caution is needed for sudden drops.
Follow Qinglan Crypto Classroom to seize more trading opportunities! Entry reminder: www.qinglan.org
📊 Qinglan TPV trading strategy backtesting reference
🕒 Last backtesting time April 29, 07:00:02
Total analysis: 1170 Backtests: 1164 Accuracy: 70.3% (818/1164)
免责声明:本文章仅代表作者个人观点,不代表本平台的立场和观点。本文章仅供信息分享,不构成对任何人的任何投资建议。用户与作者之间的任何争议,与本平台无关。如网页中刊载的文章或图片涉及侵权,请提供相关的权利证明和身份证明发送邮件到support@aicoin.com,本平台相关工作人员将会进行核查。