Crypto Circle Academician: 4.30 Bitcoin Short-term Break Warning: Can the lower Bollinger Band support hold? This rebound is not a reversal! Latest market analysis and trading suggestions
Bitcoin is currently at 75400, this pullback is really fierce, plunging directly to 74868 at the lowest point, and now hovering around 75400! Now is not a good time to bottom fish, the risks outweigh the opportunities, it is recommended to wait and see, patiently wait for stabilization signals before planning, do not think about moving north in the short term, the focus has shifted from north to south, with resistance points for the pullback primarily to the south
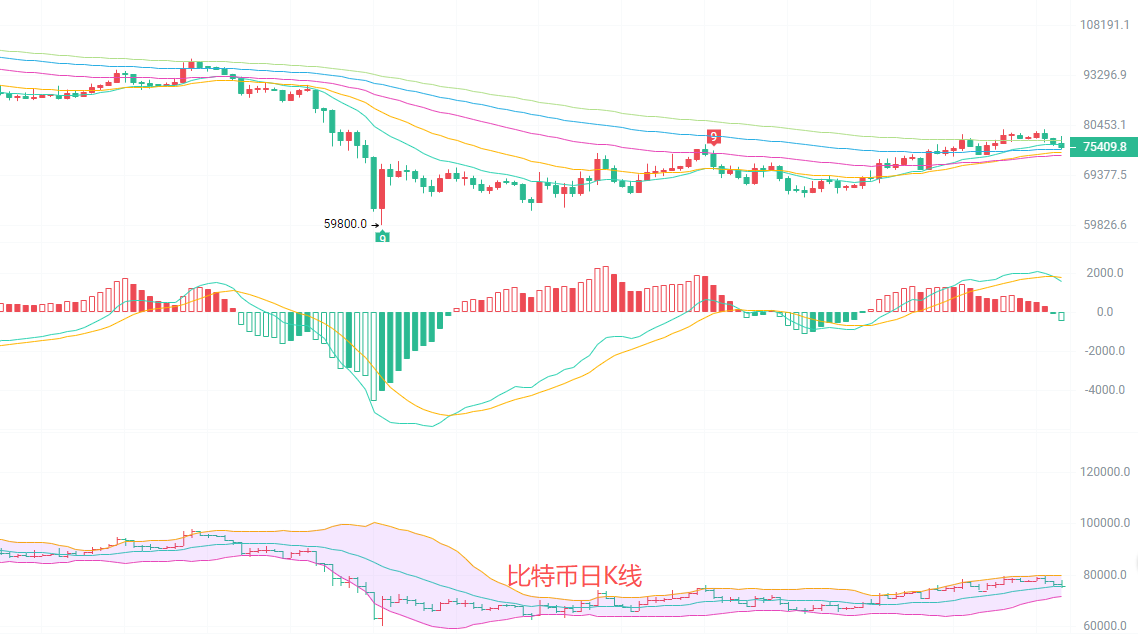
The daily K-line has broken below the EMA15 moving average, with the support from the EMA30 and EMA60 moving averages being precarious, and the upward trend has clearly weakened. The MACD green bars continue to shorten, with upward momentum fading, and the DIF and DEA crossing downward, confirming the downward signal. The middle track of the Bollinger Band at 75617 is exhibiting significant resistance, with the price currently operating below this middle track, and short-term support located near the lower Bollinger Band at 71580. If it breaks below 74000, the downward space will further expand
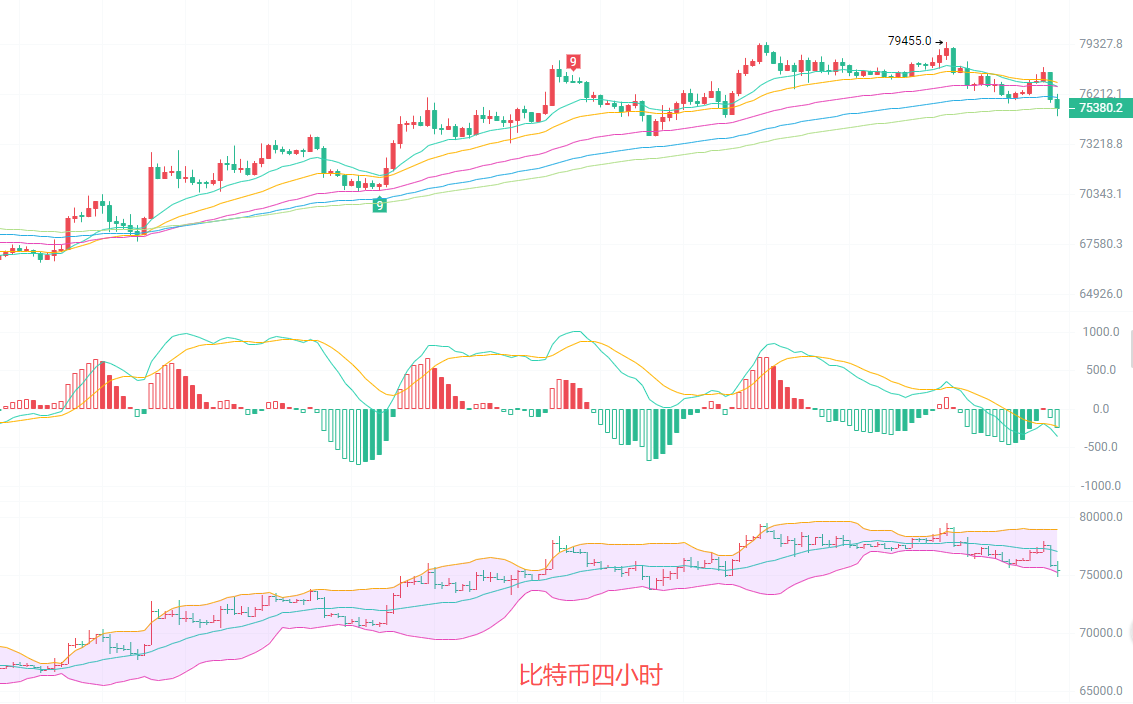
The 4-hour K-line price has broken down key moving average support, forming a short-term downward trend, with the moving average system arranged downward. The MACD green bars continue to enlarge, with the DIF and DEA crossing downward, and downward momentum continues to be released. The Bollinger Band is opening downwards, with the price running along the lower track, and short-term rebound resistance is located around the middle track of the Bollinger Band at 77060. If it cannot return to this position, the rebound is likely a fake rally, with further risks to explore 74500 in the follow-up, so before that, it’s better to be cautious, set a good stop-loss, and take it slow; as long as the principal is there, opportunities will always exist, do not let a moment of impulse ruin everything.
Short-term trading thoughts reference: Follow the trend of the larger cycle, small stop-loss quick in and out
Upwards from 73800 to 74100, stop-loss at 73300, target at 75500 to 76300
Downwards from 76300 to 76800, stop-loss at 77500, target at 74800 to 74000, breaking point at 72800
Current market trend is biased towards the south, prioritize considering short positions on rebounds, long positions are only suitable for short-term quick in and out, strictly set stop-losses to avoid being swept by volatile markets, control positions within thirty percent.

Warm reminder: The above content is solely created by the author of the public account, the advertisements at the end of the article and in the comments section are unrelated to the author, please discern carefully, thank you for reading
免责声明:本文章仅代表作者个人观点,不代表本平台的立场和观点。本文章仅供信息分享,不构成对任何人的任何投资建议。用户与作者之间的任何争议,与本平台无关。如网页中刊载的文章或图片涉及侵权,请提供相关的权利证明和身份证明发送邮件到support@aicoin.com,本平台相关工作人员将会进行核查。