Crypto Academy: On April 30, Ethereum fluctuated weakly, and the EMA60 moving average was broken! The MACD bearish momentum was released, and any rebound is an opportunity to short! Latest market analysis and operating suggestions
Ethereum's current price is 2230. Has this wave of corrections shaken off how many? The position at 2225 is neither high nor low, and both bulls and bears are fighting. Many cryptocurrency friends ask me if they can buy the dip and whether it will continue to fall. Today I’ll explain it with two charts! I've marked the key signals on the daily candlestick and the 4-hour chart. The upcoming points for bulls and bears to enter, stop-loss and take-profit levels, as well as the probable trends, will all be explained clearly. After reading this, you will know how to position next without looking for chaotic analyses everywhere!
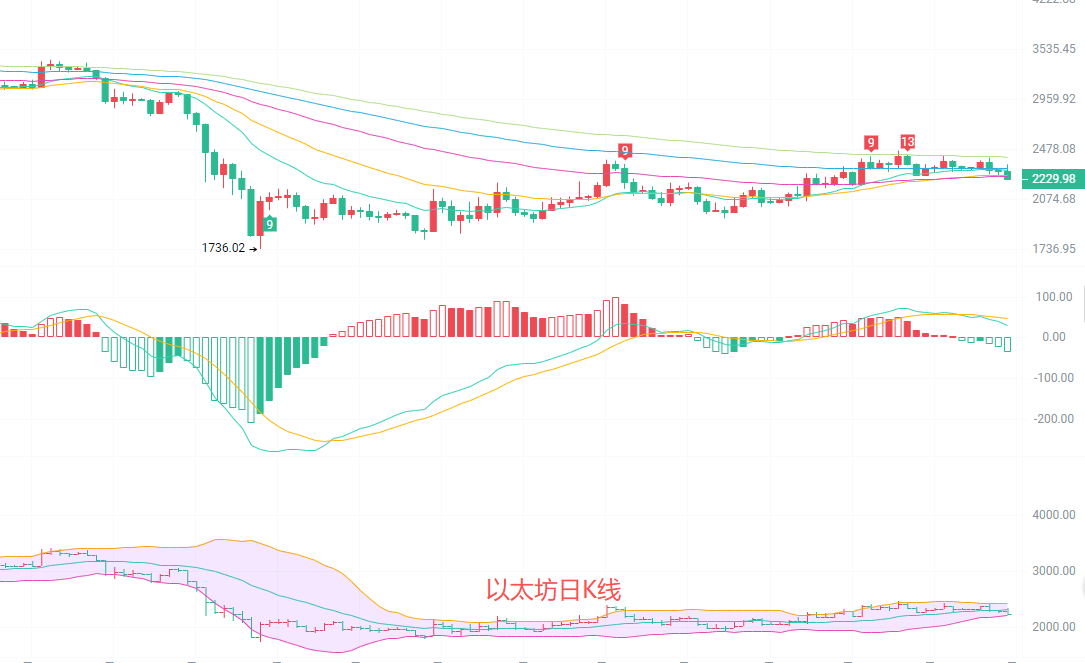
The current closing price on the daily candlestick is 2231, having fallen below the EMA15 moving average of 2297. The support at EMA30 of 2260 and EMA60 of 2249 below is also precarious, indicating a weak short-term trend. The MACD red bars continue to shorten, and the DIF has turned downward, approaching the DEA line, with obvious weakening of upward momentum. The mid-Bollinger Band at 2315 has significant pressure, and the price is currently operating below the mid-band. There is short-term support at the lower band of 2209; if this breaks, there is a high probability of a pullback to the level of 2150.
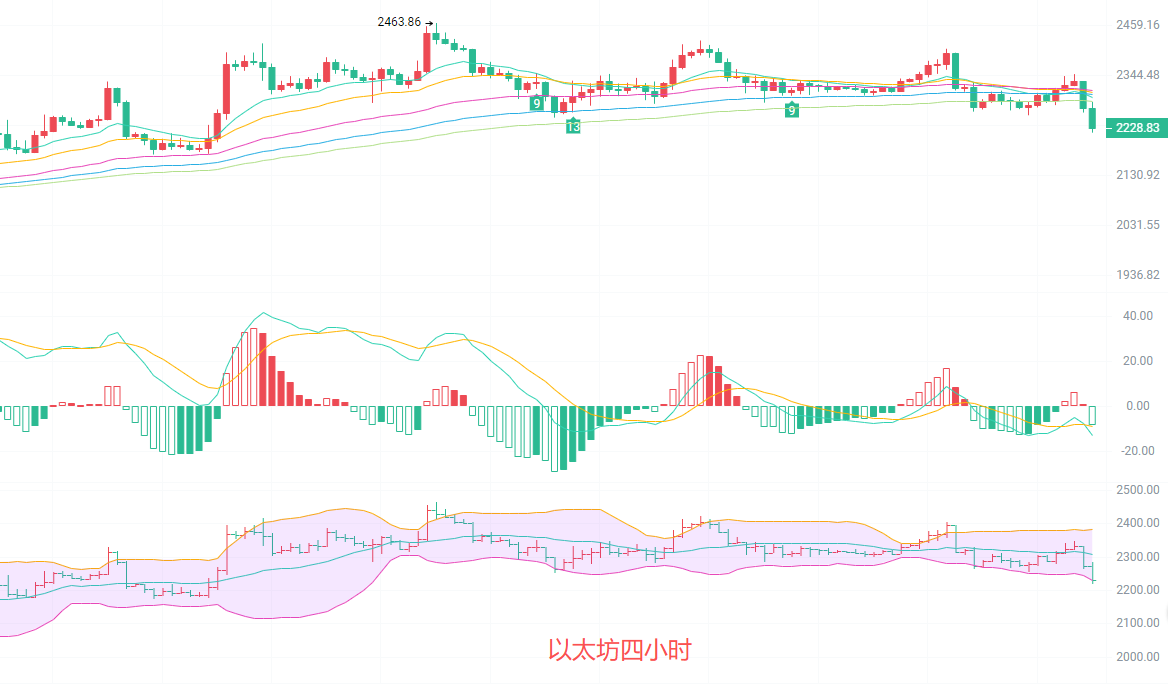
The four-hour candlestick has fallen below the EMA15, 30, and 60 moving averages, forming a short-term downward arrangement. The EMA120 support at 2288 has been broken, signaling a bearish outlook from the moving average system. The MACD green bars continue to expand, with the DIF and DEA crossing downwards and continuing to decline, releasing downward momentum. There is short-term support near the lower Bollinger Band around 2232, with the opening directed downward; the price is operating along the lower band, and the short-term rebound pressure is near the mid-band at 2307. If it cannot return to this position, the downward trend will continue.
Short-term reference: (Actual trading data has been updated, please consult the author for details)
Buy with target at 2265 to 2285 if moving upwards from 2200 to 2210, with a stop-loss at 2170
Sell with target at 2225 to 2200, breaking below 2170 if moving downwards from 2275 to 2285, with a stop-loss at 2315

The current market is bearish; it is advisable to prioritize short positions on rebounds. Long positions are only suitable for short-term speculation, and it is essential to use stop-loss orders, control position sizes, and avoid blind over-leveraging.
Warm reminder: The above content is solely created by the author for the public account. The advertisements at the end of the article and in the comments section are not related to the author; please discern carefully. Thank you for reading.
免责声明:本文章仅代表作者个人观点,不代表本平台的立场和观点。本文章仅供信息分享,不构成对任何人的任何投资建议。用户与作者之间的任何争议,与本平台无关。如网页中刊载的文章或图片涉及侵权,请提供相关的权利证明和身份证明发送邮件到support@aicoin.com,本平台相关工作人员将会进行核查。