Is Bitcoin back on the bullish track? 82,000 options hedging clusters amplify volatility, as bulls and bears confront each other.
Written by: Glassnode
Translated by: Aididiao JP, Foresight News
Bitcoin has broken through $80,000, advancing towards key resistance near $85,000, with bulls in control. ETF demand is picking up, bearish positions still exist, but supply overhead may limit upward movement unless spot demand strengthens further.
Summary
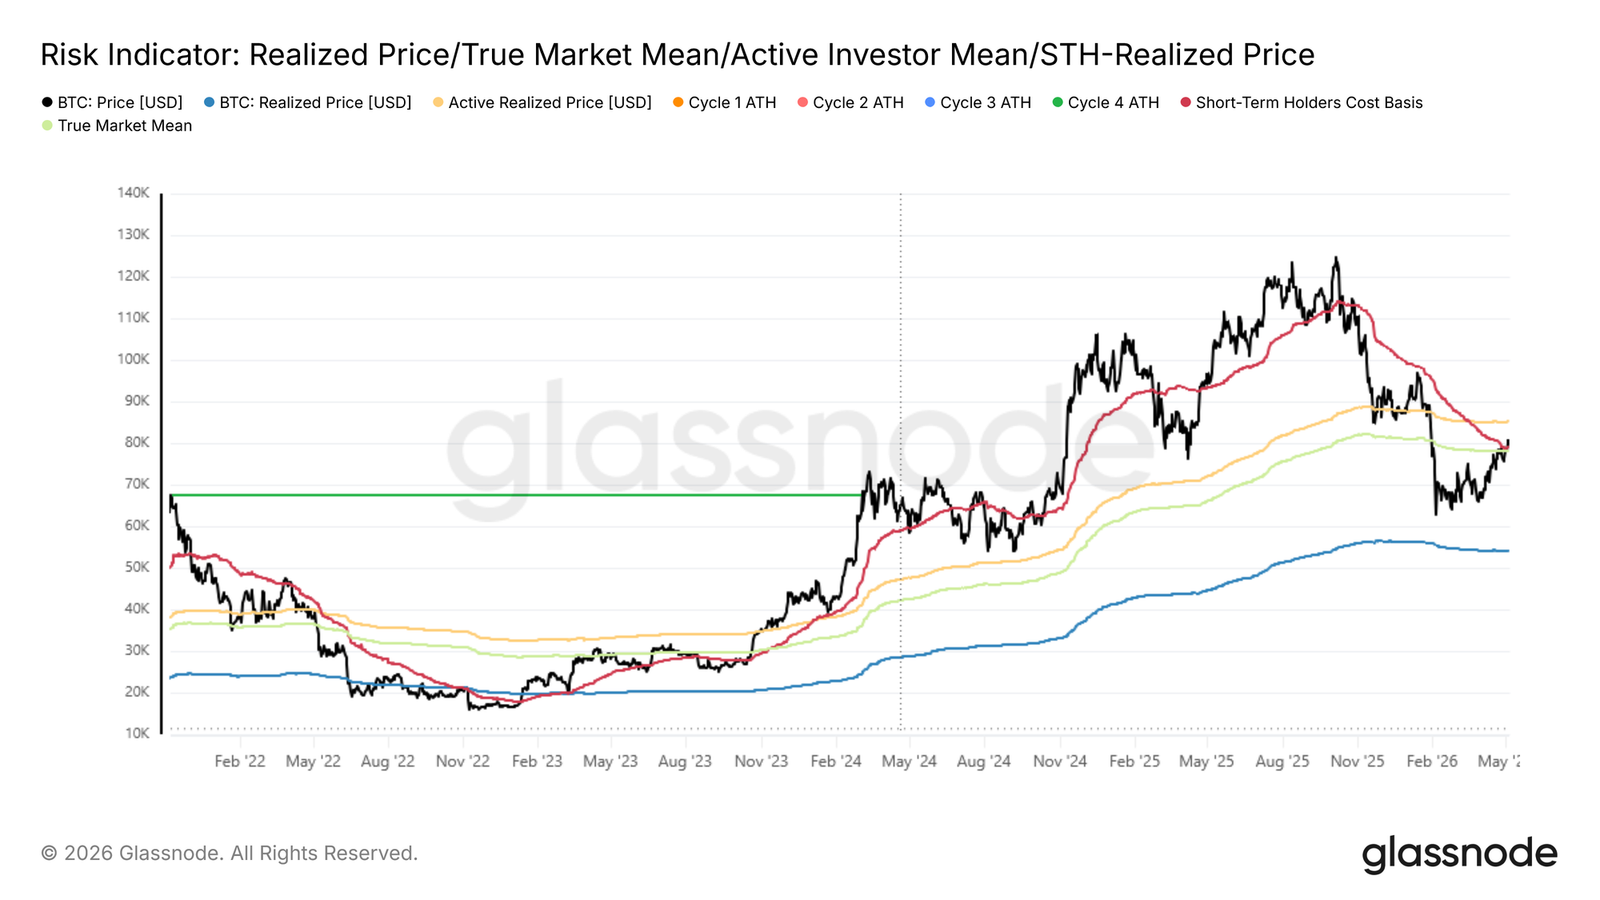
- Bitcoin has surpassed the real market average of $78,200 and the short-term holder cost basis of $79,100; holding these levels indicates that the previous deep value phase was relatively short-lived, with the next key resistance at $85,200.
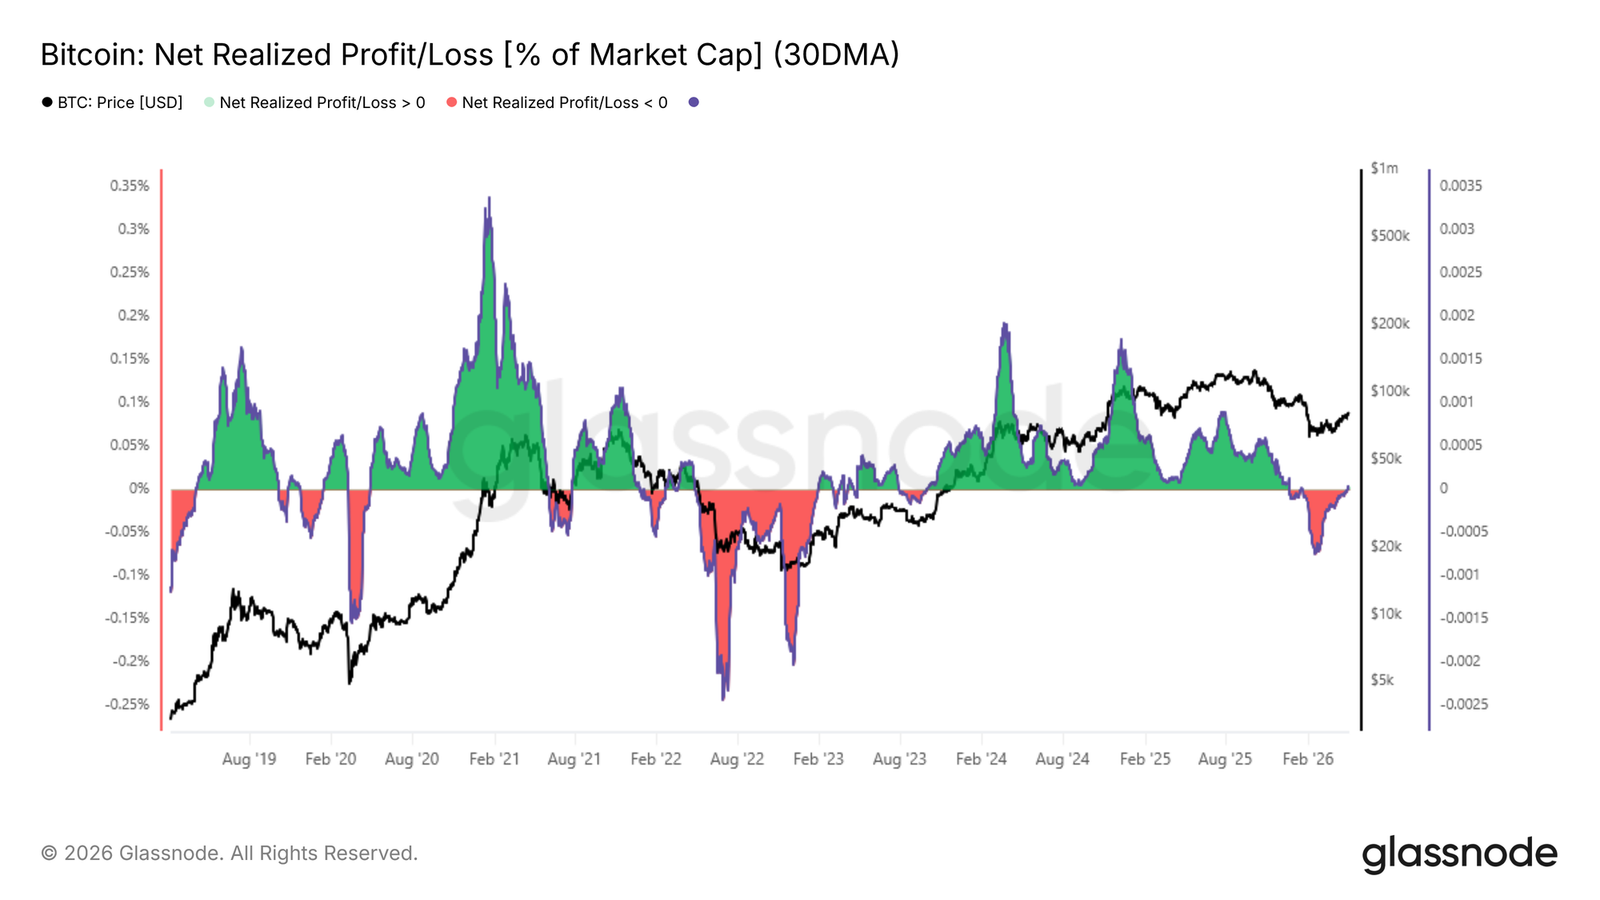
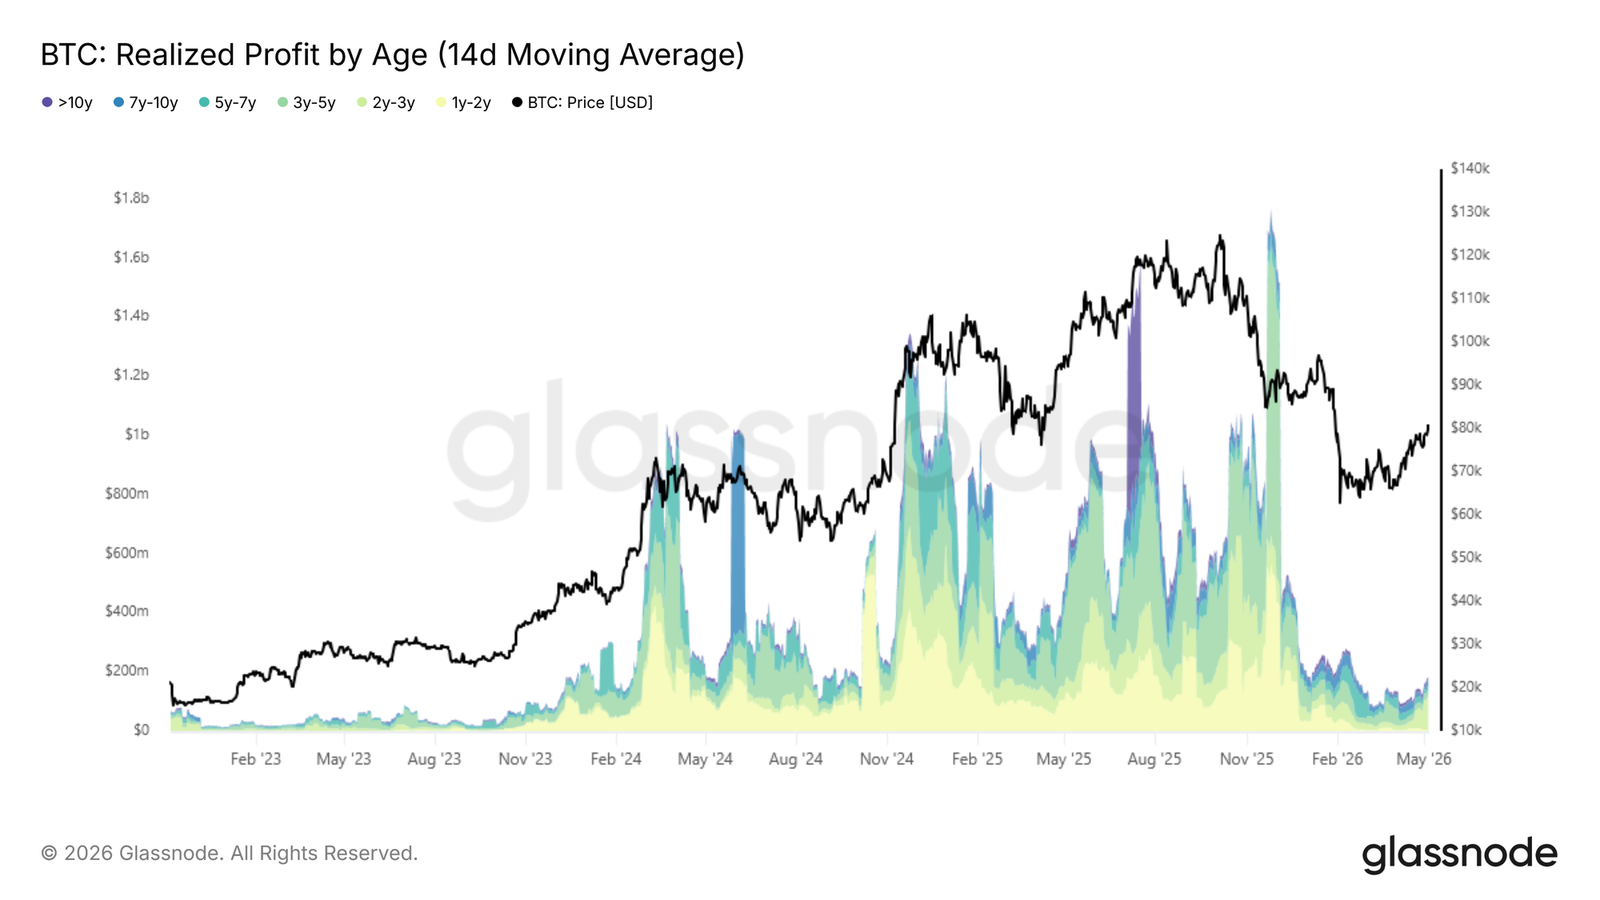
- The 30-day simple moving average net realized profit and loss has turned positive, accounting for 0.003% of the market cap, while long-term holders' profit-taking has risen to $180 million daily, still far below the cycle peak of over $1 billion per day.
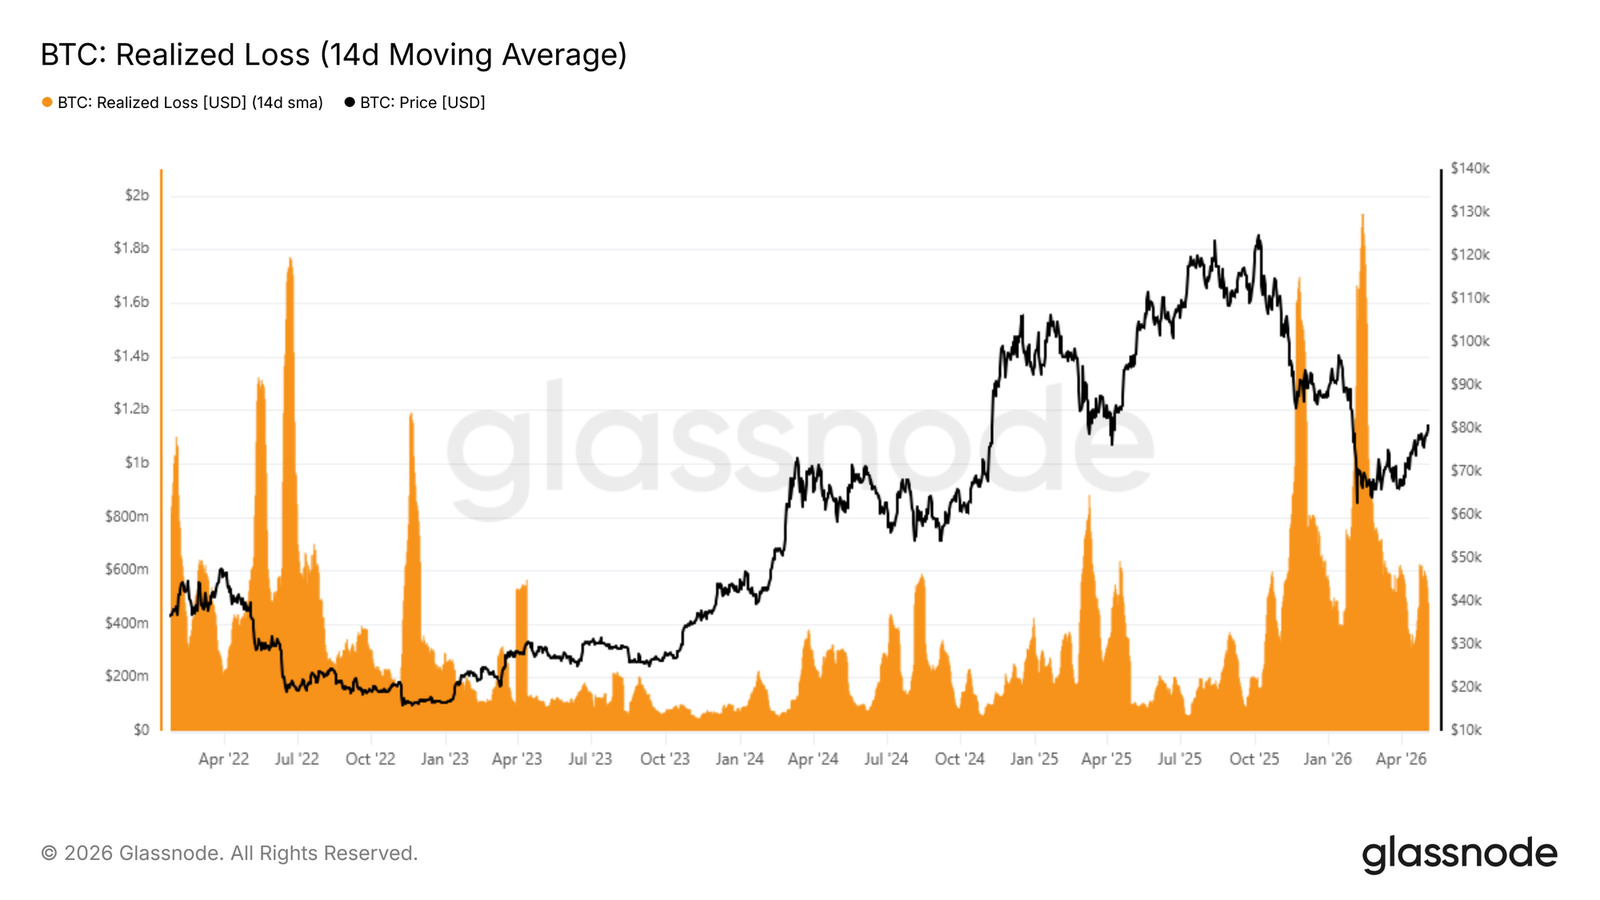
- Realized losses remain high at $479 million daily, 140% above the cycle baseline, and need to be continuously compressed below $200 million per day to confirm a more sustainable recovery pattern.
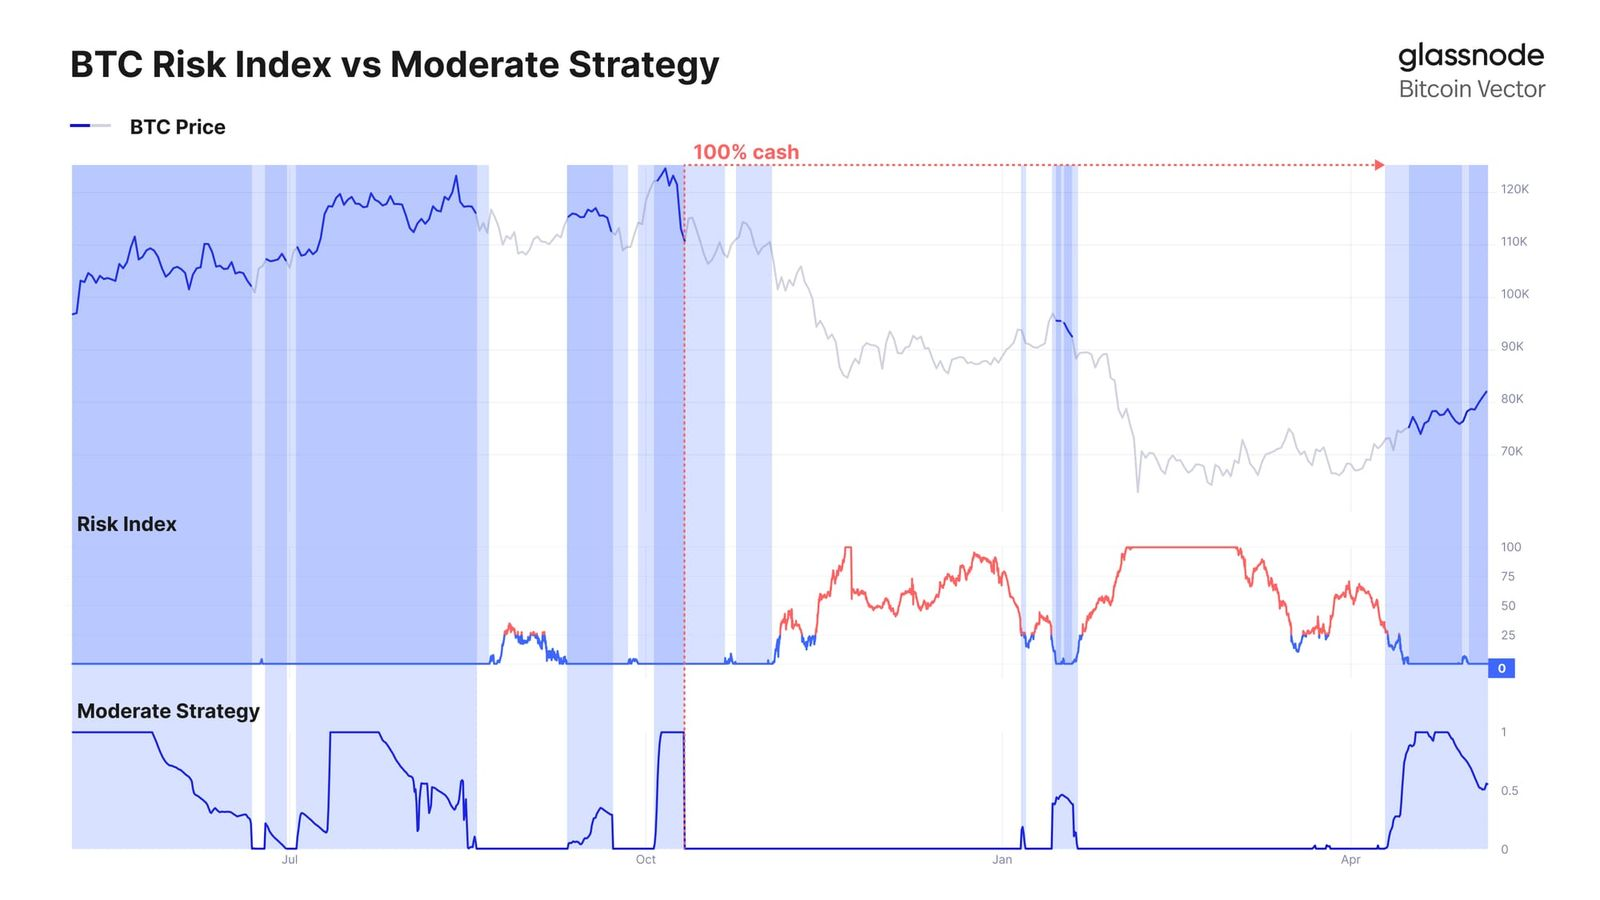
- Glassnode's neutral strategy re-entered allocation after Bitcoin recaptured around $76,000, capturing recent gains while maintaining focus on downward protection.
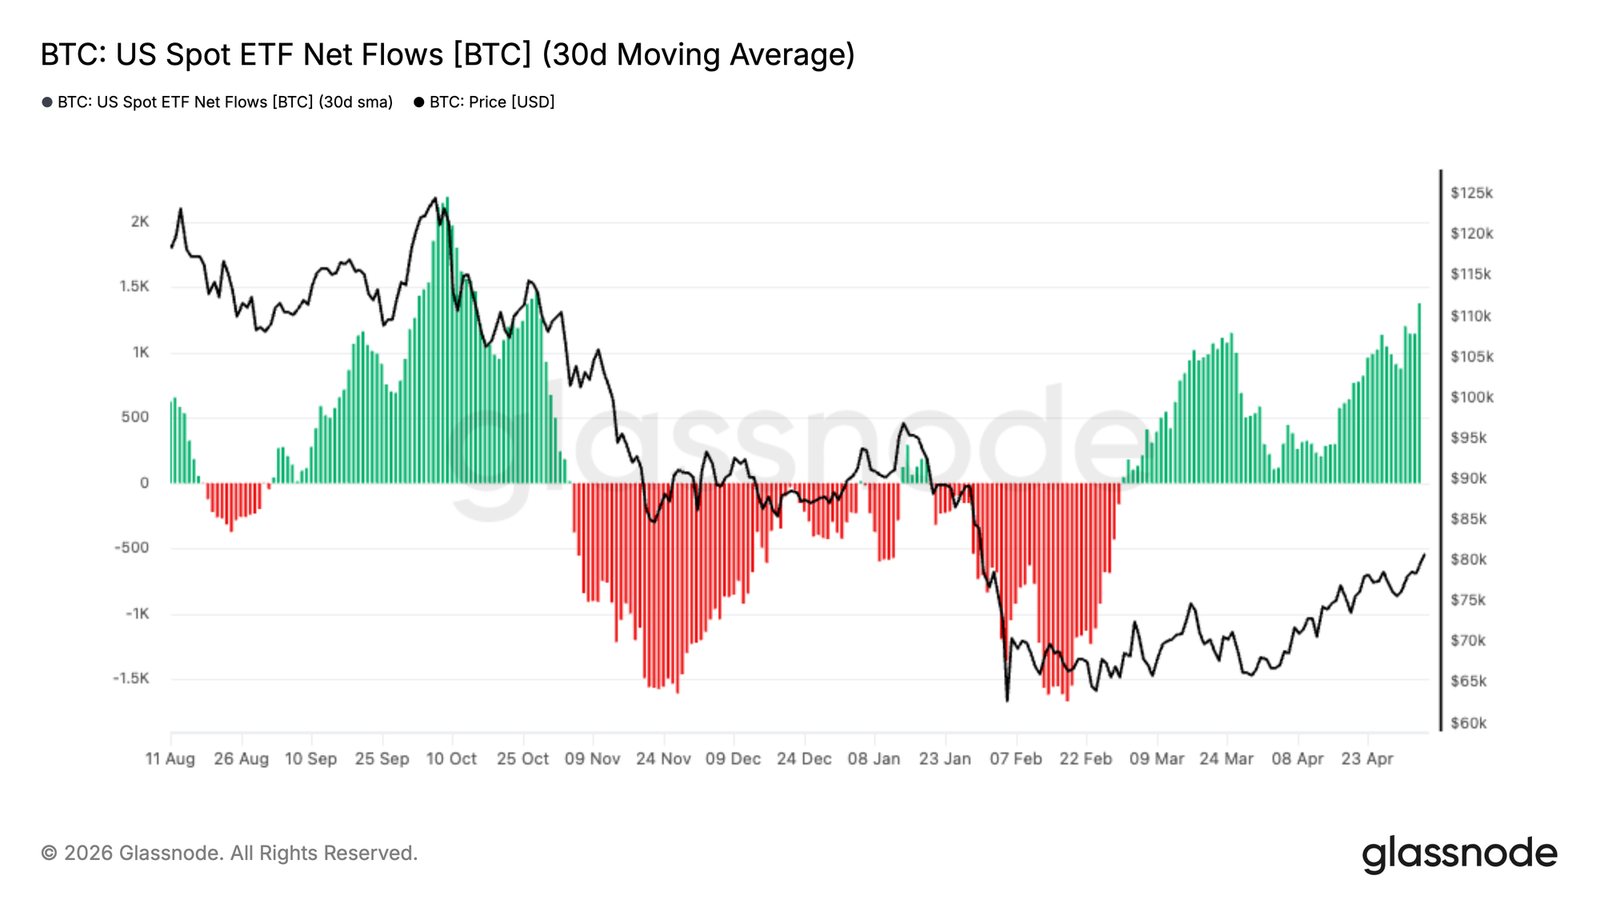
- The U.S. spot ETF fund flows have turned positive on a 30-day basis, indicating institutional demand is recovering, supporting the price's return to the $80,000 area.
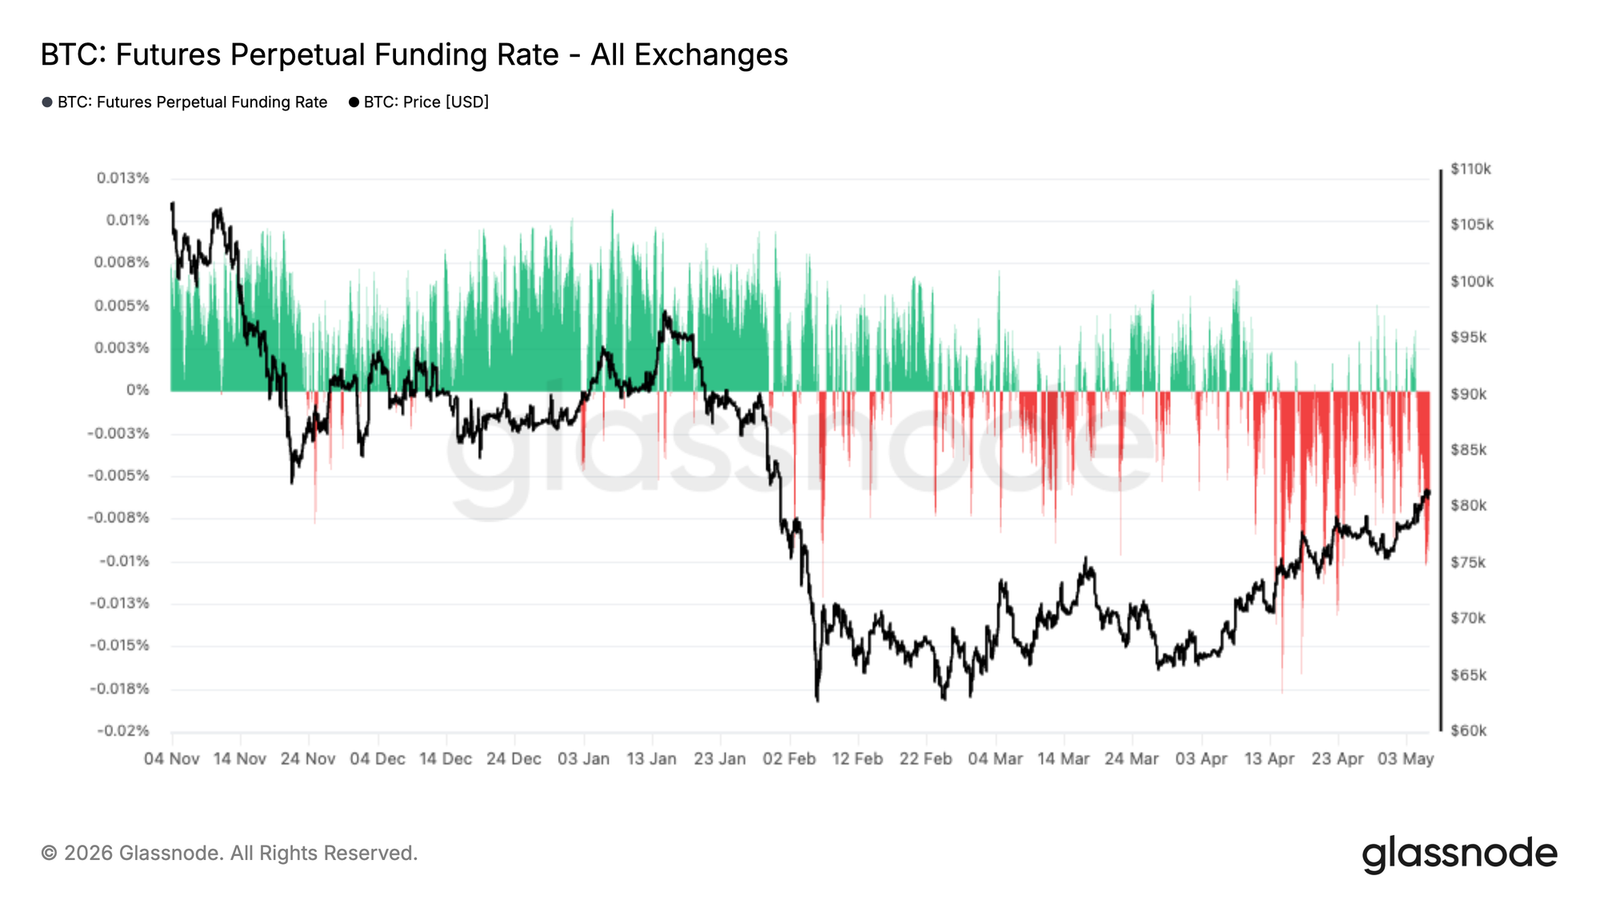
- Despite the rebound, perpetual contract funding rates remain predominantly negative, indicating ongoing bearish positions, which may drive further upward movement through short squeezes.
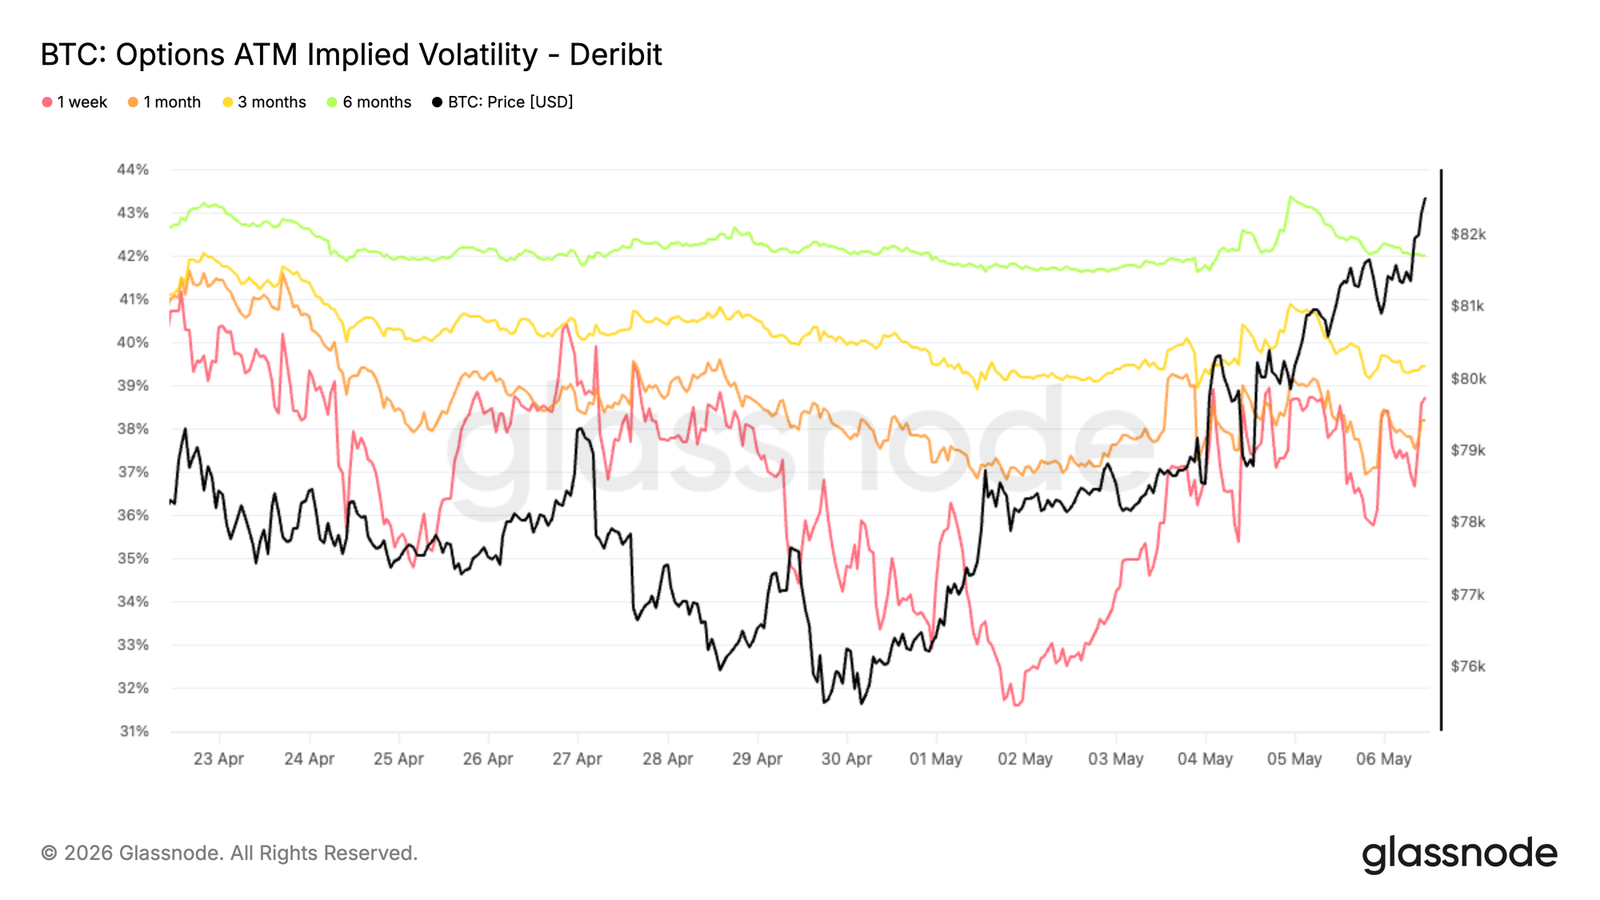
- Front-end implied volatility has been repriced upward after breaking out, while realized volatility lags behind, with positive volatility risk premium being rebuilt.
- Options skew is compressing towards a neutral position, indicating reduced demand for downside hedging and a shift towards a more balanced stance.
- A significant cluster of short-term options hedging exists around $82,000, increasing price sensitivity; market makers hedging liquidity when spot is in this range could amplify volatility.
On-chain Insights
Breaking Above the Mean
Last week, this report indicated that the rejection at the real market average and short-term holder cost basis confirmed short-term resistance above, while the dense accumulation cluster between $65,000 and $70,000 could support a rally to the $84,000 supply area. This rally has now materialized: Bitcoin surged to $81,000, breaking through the real market average of $78,200 and the short-term holder cost basis of $79,100, clearing all active trading supply and the average purchase price of recent buyers over the past 155 days.
If the price can hold above these levels in the coming week, the deep value phase from early February 2026 to now will become one of the shortest such phases in Bitcoin market history. Attention now turns to the next major resistance - the actively realized price near $85,200, which tracks the cost basis of all non-sleeping supply and is the next structural hurdle the market must face.
Profitability Turns Positive
With the breakthrough of the real market average, the improved price structure is now reflected in profitability indicators. The 30-day simple moving average net realized profit and loss (the difference between on-chain realized profits and losses divided by market cap) has turned positive, currently at 0.003% of market cap.
This indicator measures whether the spending investors as a whole are exiting in profit or loss; returning to a positive region after being dominated by long-term losses is a constructive signal. This indicator reached a market cap of -0.027% at the mid-February low, which is a significantly negative value, but in comparison to the extreme loss realization phases observed during the 2022-2023 bear market, the depth was relatively limited. In hindsight, this limited negative depth aligns with the previously mentioned recent deep value phase's historically short duration.
Long-term Holders Start Acting
As net realized profits turn positive, the key question shifts to whether buyer liquidity can withstand the wave of increasing distribution from long-term holders. The 14-day simple moving average of realized profits from addresses holding for over a year has recently risen to about $180 million daily, comparable to levels in September 2024 and December 2022.
This group has experienced the entire recent bear market phase, and now, with prices rising to more favorable levels, faces increasing incentives to take profits. If the current expansion continues, this distribution pressure is likely to intensify. Importantly, this indicator has not yet approached the early cycle peak conditions of over $1 billion per day, indicating that selling by long-term holders remains moderate rather than aggressive at this stage. Whether the market can absorb this gradually increasing supply while maintaining prices above the real market average will be a decisive test of whether the current recovery has genuine structural support.
Realized Losses Remain High
While profit-taking by long-term holders is still below concerning levels in the early stages of a potential pattern shift, the realized loss amounts in the broader market pose a more direct drag on momentum. The total realized losses' 14-day simple moving average currently stands at $479 million daily, about 140% higher than the daily baseline of $200 million from more stable periods of this cycle, reflecting investors' eagerness to exit at now smaller loss margins as prices recover.
This sustained compression back below $200 million daily will serve as a strong signal for on-chain confirmation that selling pressure has exhausted, and that the market is truly transitioning to a healthier demand pattern. Before reaching this threshold, the dual pressure of long-term holders taking profits and top buyers distributing at slight losses may anchor the current rebound, especially in the absence of substantial catalysts for new buyers to participate in the short term.
Off-chain Insights
After recovering from a low point of about $66,000 and solidly breaking through the $76,000 area, systematic strategies began to reintroduce risk. Glassnode's neutral strategy (using off-chain market data to manage exposure) has reallocated, participating in the recent move towards the $80,000 area.
This strategy is designed with a focus on downward protection, typically lagging in sharp rebounds but seeking to avoid deeper pullbacks and re-enter when conditions improve. This recent shift reflects a more constructive market backdrop, with prices recapturing key levels and directional momentum being rebuilt.
ETF Demand Recovers Momentum
Demand for U.S. spot Bitcoin ETFs has seen significant recovery, with the 30-day moving average net inflows turning positive after long-term outflows. This shift marks a clear turning point in institutional appetite, following substantial outflows during the pullback from late 2025 to early 2026.
The recent acceleration of inflows aligns closely with Bitcoin's rebound from the low of about $66,000 back to the $80,000 area, indicating that traditional investors are regaining confidence. If this trend continues, ETF demand could become a structural tailwind again, strengthening spot market intensity and supporting further upward movement.
Bearish Pressure Continues
Despite the price rising from a low of about $66,000 and retesting the $80,000 area, perpetual contract funding rates remain predominantly negative. This ongoing negative funding rate indicates that bearish positions continue to dominate, with traders willing to pay to maintain downward exposure, despite the recent upward trend.
Historically, such situations often occur during skepticism phases, where rebounds are met with profit-taking rather than aggressive buying. The coexistence of negative funding rates and rising prices suggests that the market is possibly climbing the "wall of worry," and if bearish positions continue to be pressured, there is potential for further upward movement.
Short-term Volatility Repricing After Local Lows
Implied volatility hit a bottom over the weekend, with levels across maturities reaching their lowest since October 2025, just prior to the 10/10 event.
Subsequently, Bitcoin broke resistance and brought volatility back into the market. The 1-week term has rebounded about 6 volatility points from its lows, driven by upward demand and position adjustments.
This trend has been amplified by gamma sellers rolling exposure, who repurchase short-term options and sell further out on the curve. Thus, the front end has been sharply repriced, while longer maturities only moved moderately, rising by 1 to 2 volatility points.
This reflects renewed demand for short-term options, but long-term volatility expectations have not undergone broader change.
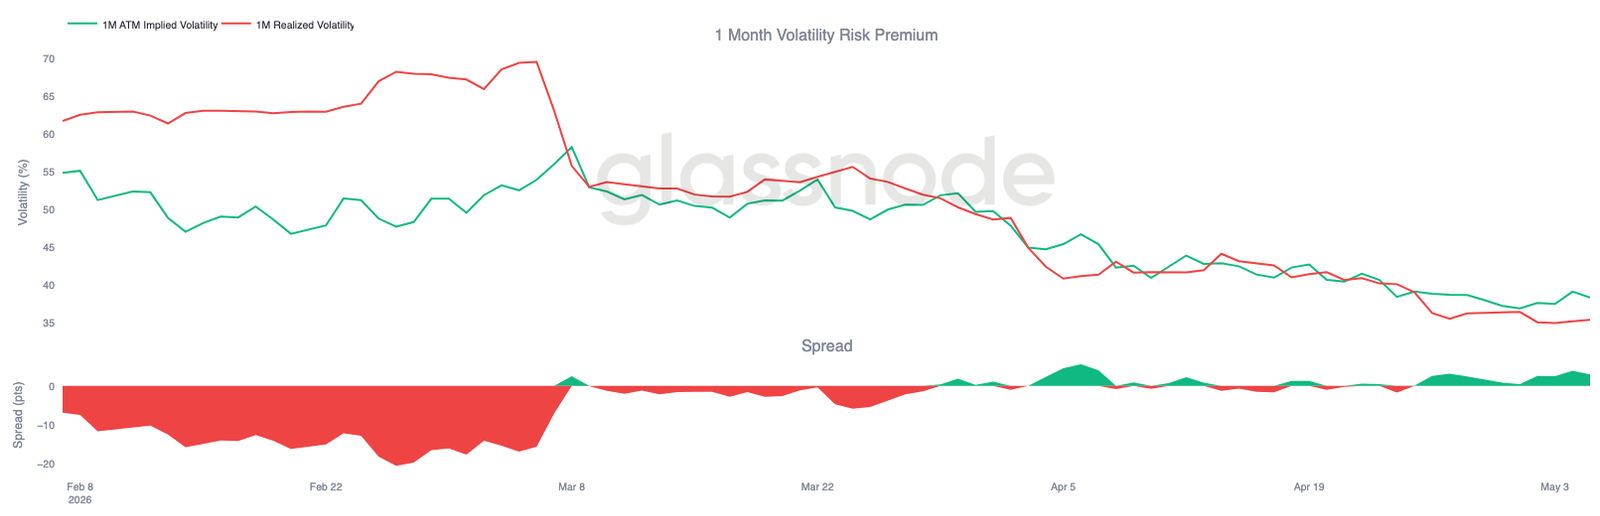
Volatility Risk Premium Rebuilt as Implied Volatility Leads
Bitcoin's realized volatility continues to slowly decline, with the 1-month RV currently at 35.38%, even as prices surged significantly over the past week.
This creates a clear divergence, with implied volatility's repricing speed surpassing that of realized volatility. The volatility risk premium has again turned positive, with the spread approaching 3 volatility points, reflecting renewed demand for short-term options. This indicates that realized volatility has not kept pace with recent price movements. Implied volatility leads, driven by positioning and front-end demand, while realized volatility remains relatively controlled.
This setup continues to support a market rally, but the expanding spread indicates that the market is beginning to price in more volatility to come than has occurred thus far.
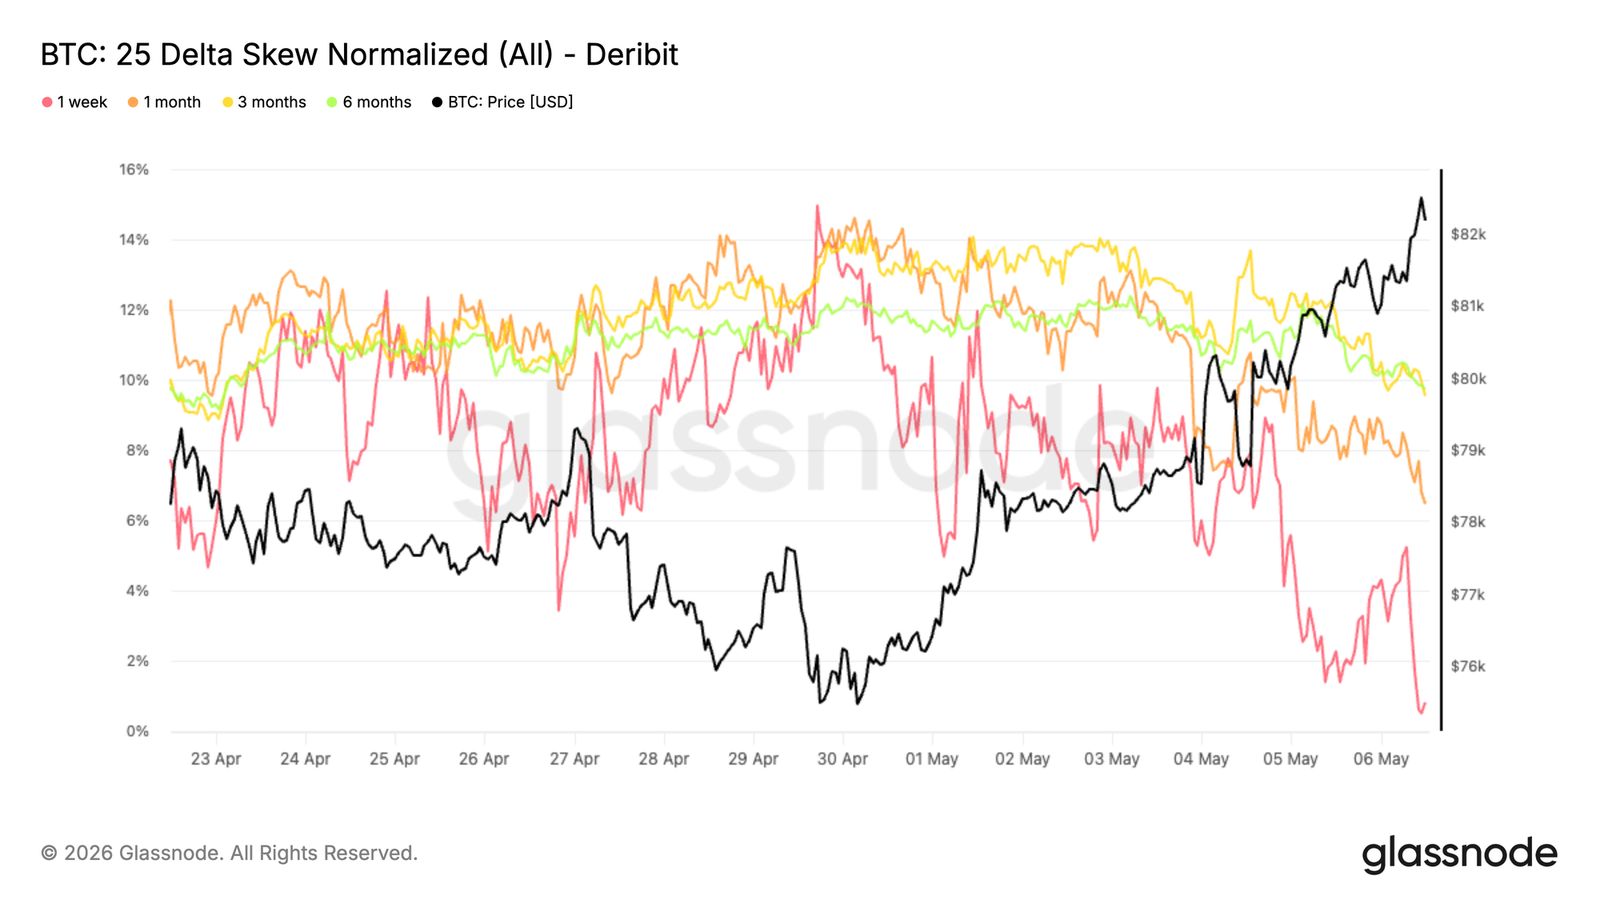
Skew Normalizing, Downside Demand Fading
Skew across maturities is shifting positively towards neutral, reflecting a clear change in positioning. After maintaining a premium on put options, the 25D skew is now compressing, but still resides in bearish territory.
This trend is most evident in the front end, where the 1-week skew is now approaching zero, as downside demand fades. Since the skew is calculated as put options minus call options, this downward move indicates that the premium for put options is losing relative strength against call options. Longer maturities are also moving downward, but more gradually, maintaining put premiums despite the compression.
This indicates that protection is being unwound rather than increased, especially in the short term. As prices have recently broken through, traders are reducing hedges and shifting more towards directional exposure. The skew no longer shows strong demand for downside protection.
Large Short-term Gamma Cluster Drives Spot Sensitivity
Gamma positions indicate a noticeable short-term gamma concentration around the $82,000 strike price, with nearly $2 billion in exposure currently at the present spot levels.
Short-term gamma means that market makers' positions force them to hedge against the direction of price movements—buying when the price rises and selling when it falls. This creates a feedback loop that could accelerate price action, helping to explain the recent push towards $83,000.
This effect is reinforced by strong bullish option buying, which accounted for about 40% over the past 24 hours, increasing pressure to enter this area.
As the spot price is above this large short-term gamma cluster, the market enters a highly sensitive area where small fluctuations can trigger exaggerated responses. Prices may remain highly reactive here, with severe volatility potentials in either direction as hedging flows intensify.
Conclusion
Bitcoin is showing early signs of structural recovery as it recaptures key on-chain cost basis levels, pushing towards resistance near $85,000. Spot demand and ETF inflows are rebuilding, indicating that bulls remain in control, but the market is now nearing a critical ceiling, where overhead supply may begin to reappear.
Meanwhile, derivative positions still lean towards bearish, creating conditions where further upward movement could be driven by bearish pressure. The options market is resetting, with short-term gamma present near current price levels, increasing the likelihood that volatility could be amplified when testing resistance.
In summary, the trend looks constructive, and bullish momentum is intact, but the market is now entering a more reactive phase. Continued breakthroughs through resistance, supported by sustained spot demand and easing selling pressure, are needed to confirm a more durable upward continuation.
免责声明:本文章仅代表作者个人观点,不代表本平台的立场和观点。本文章仅供信息分享,不构成对任何人的任何投资建议。用户与作者之间的任何争议,与本平台无关。如网页中刊载的文章或图片涉及侵权,请提供相关的权利证明和身份证明发送邮件到support@aicoin.com,本平台相关工作人员将会进行核查。


