Spot demand has improved, but rebuilding confidence is slow, with 87,000 being a key resistance.
Written by: Glassnode
Translated by: AididiaoJP, Foresight News
Bitcoin has returned above $80,000, with improvements in ETF inflows, spot demand, and positions. However, weak capital inflow intensity and heavy supply near $86,000 keep market sentiment below that of the previous bull market phase.
Summary
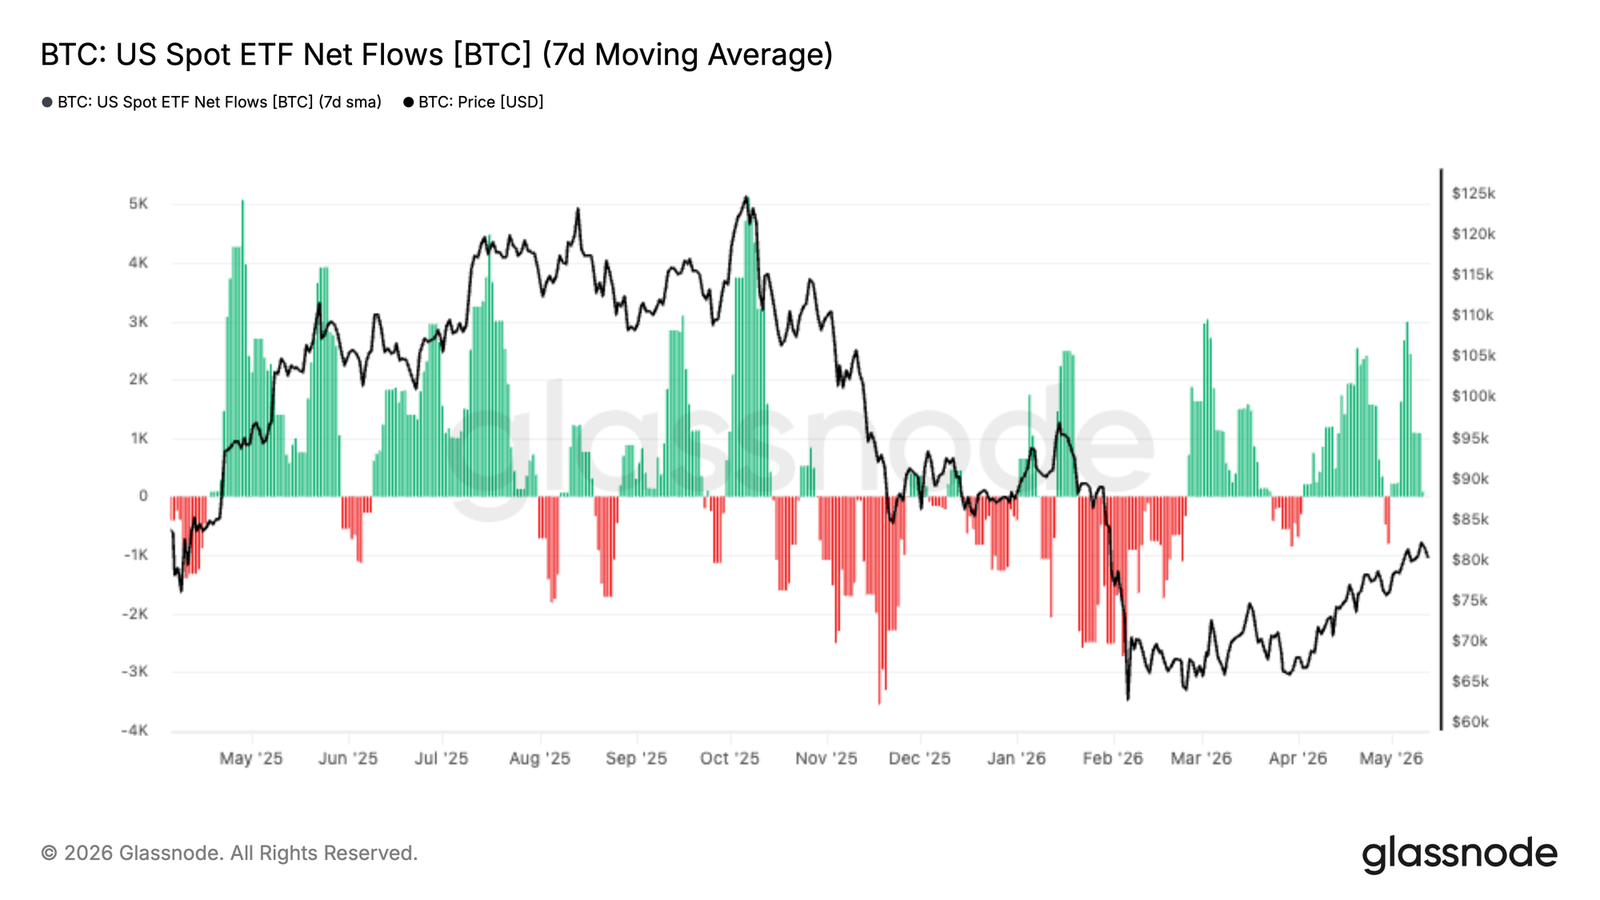
- U.S. spot Bitcoin ETF inflows have turned clearly positive again, as Bitcoin rebounded from the mid-$60,000 range to the low $80,000s, with institutional demand reignited.
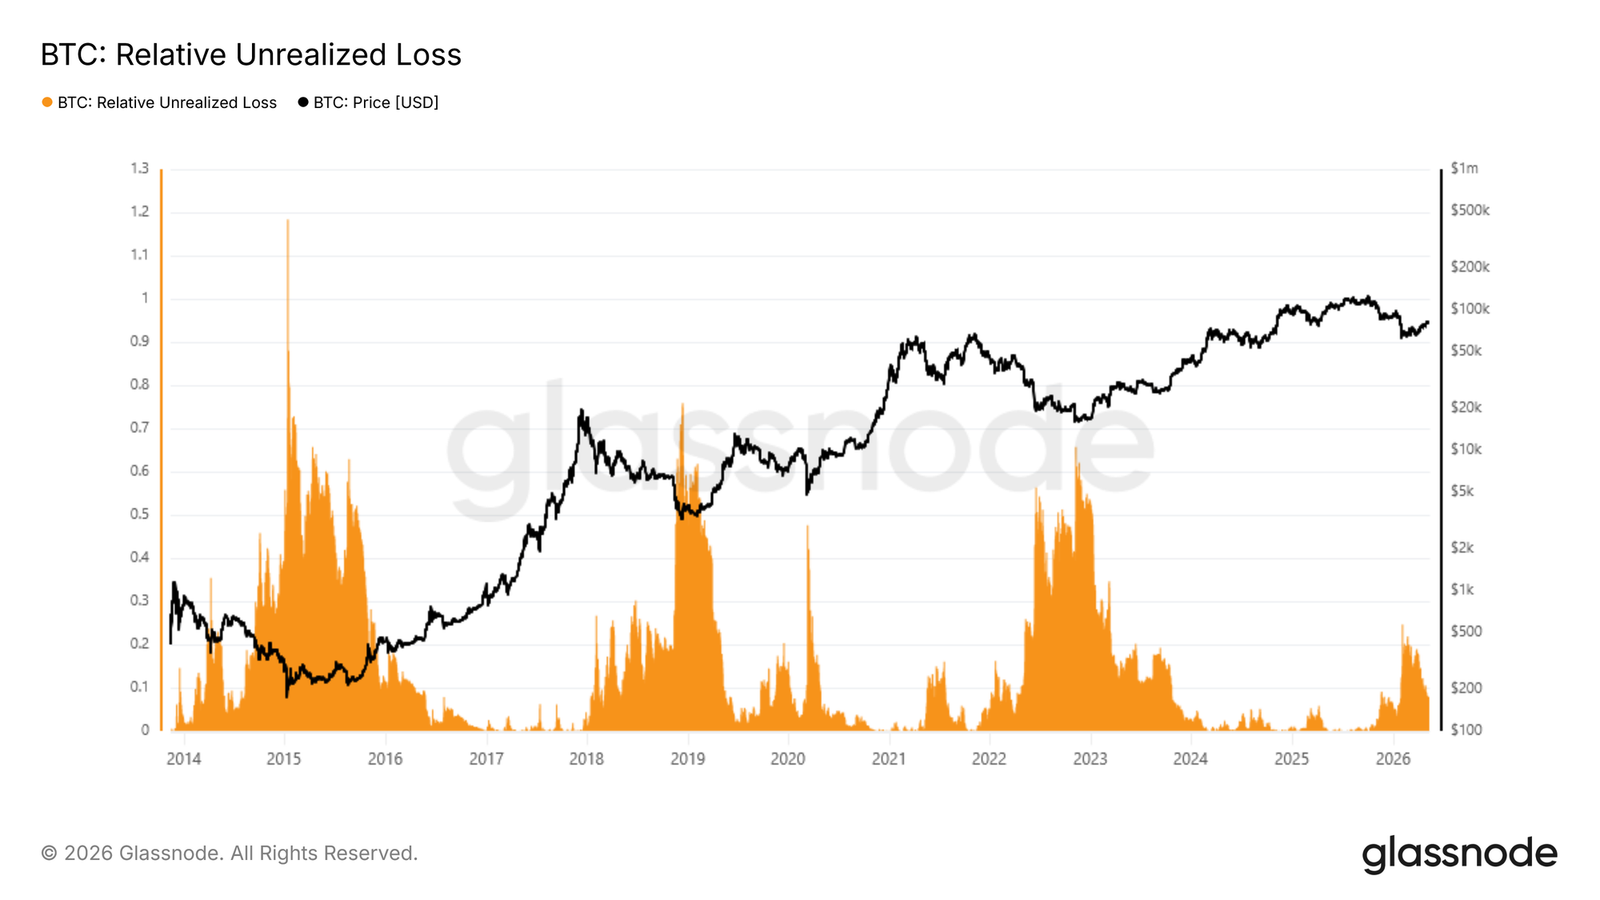
- The relative unrealized losses in Bitcoin peaked at 25% of market capitalization during the sell-off in February, then compressed to 8% after reclaiming $80,000, supporting the view that if $60,000 holds, this round is still a shallow bear pattern.
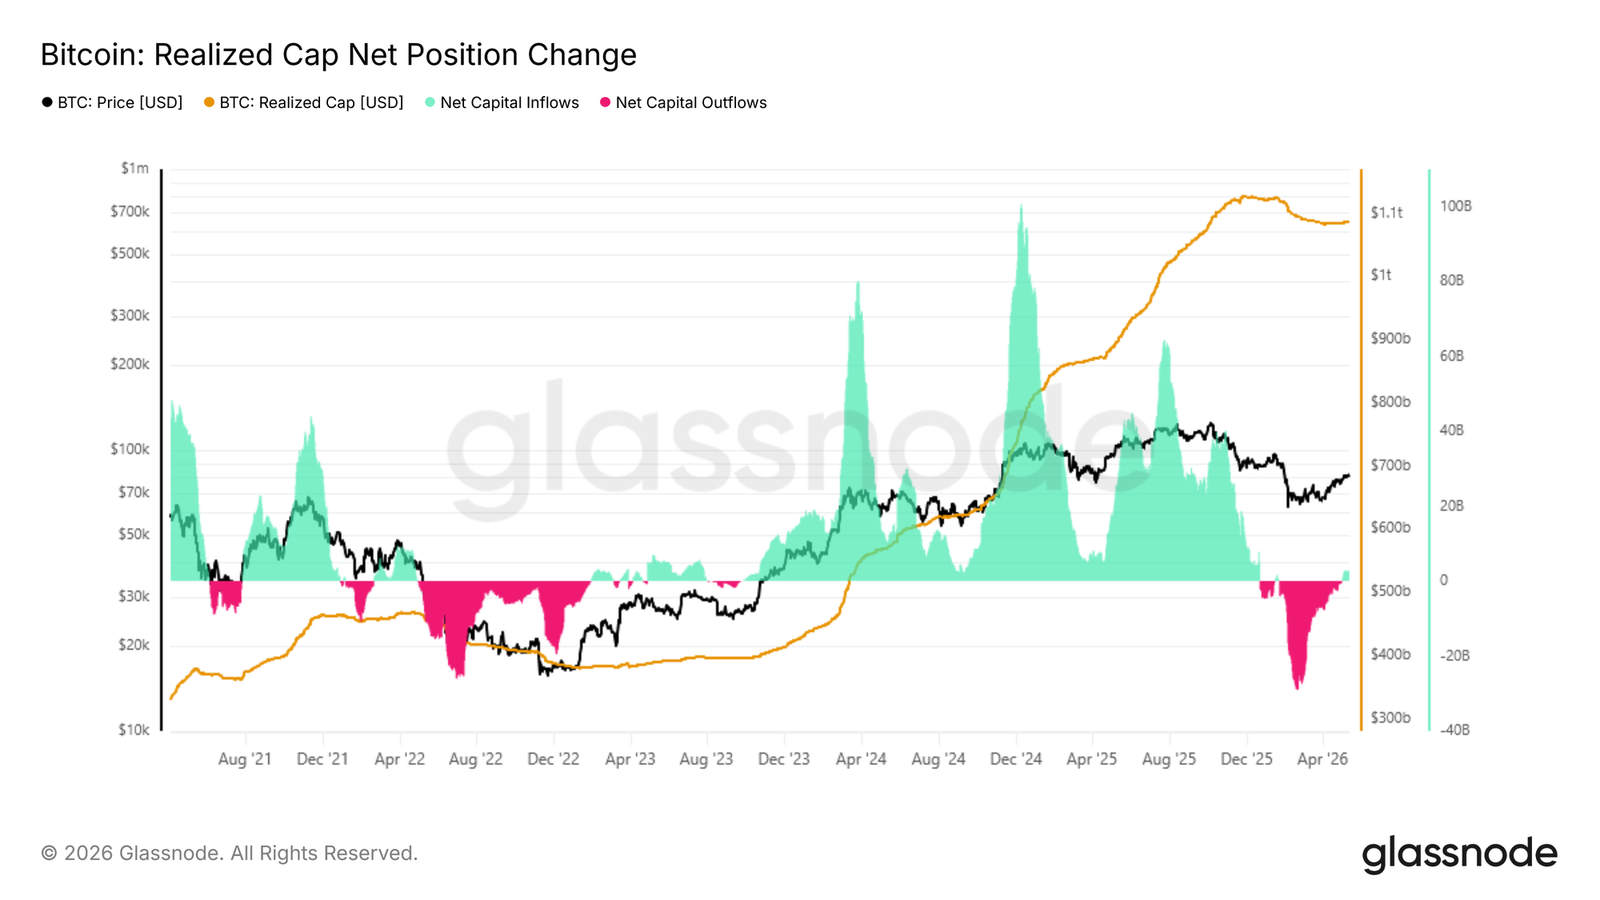
- The 30-day net position change of realized market capitalization has rebounded to $2.8 billion per month, indicating that capital inflow is improving, but still far below the over $10 billion level during the previous bull market expansion.
- The 30-day cost basis is at $76,900, providing short-term immediate support, while the $86,900 accumulation range from November to February remains a key resistance level for the recent recovery.
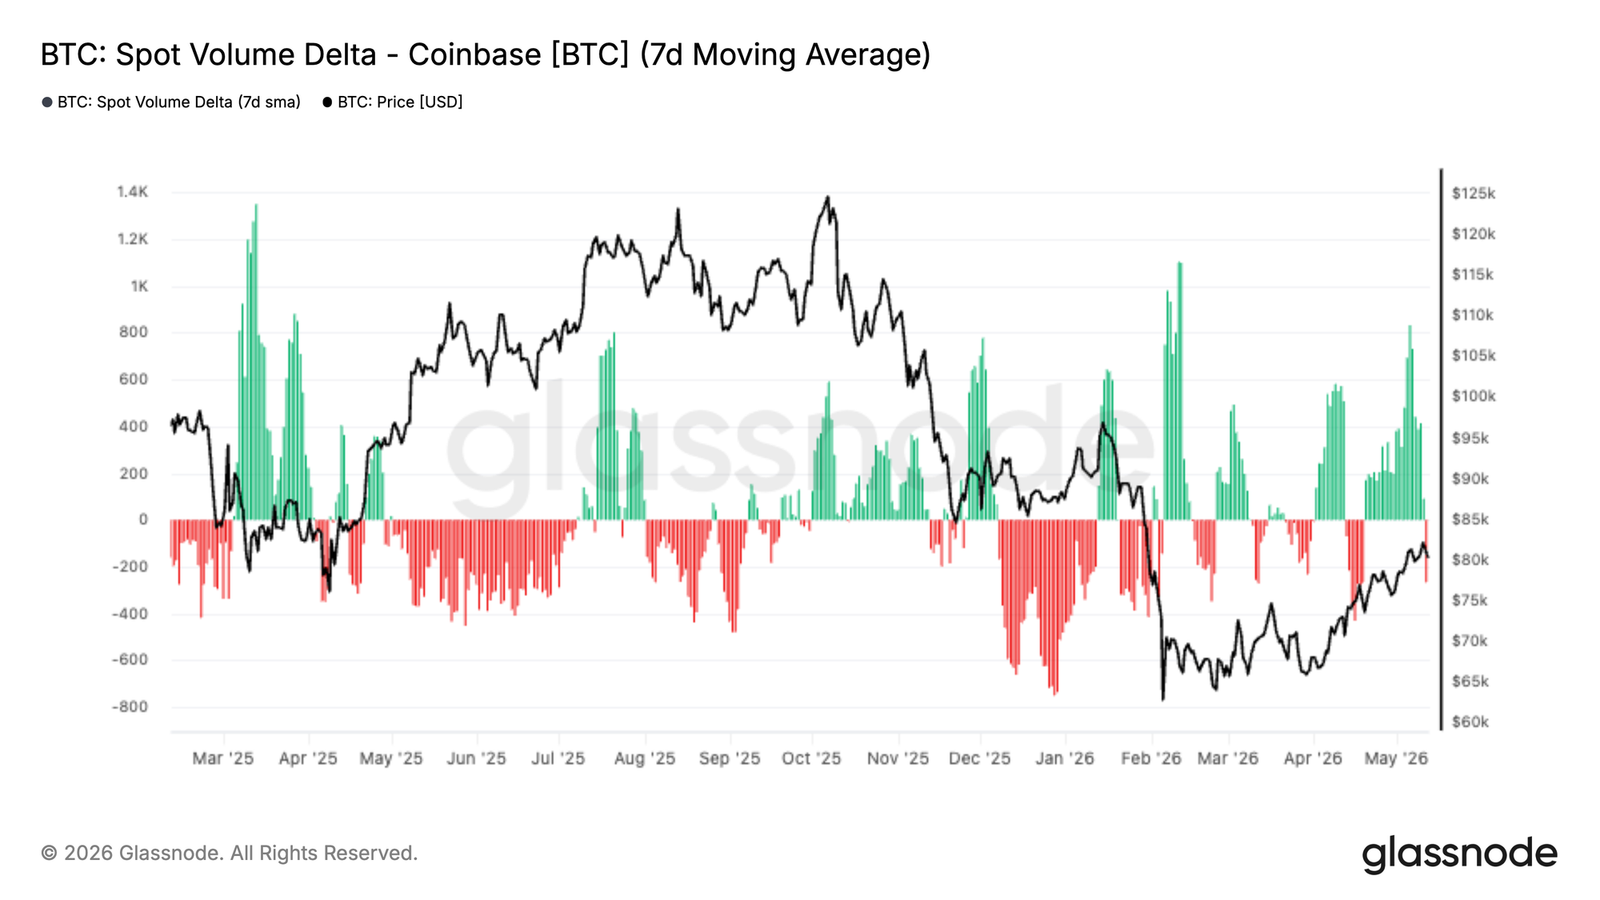
- Coinbase’s spot volume Delta has sharply turned positive in the past two weeks, indicating that buyer activity is becoming more aggressive, and spot market demand is strengthening.
- Hyperliquid traders are steadily rebuilding long positions as prices rise, reflecting improved speculative sentiment and increased confidence in a continued upward trend.
- Implied volatility has persistently compressed across the curve, led by the front end, while realized volatility trends downward, with the market pricing in a calmer short-term pattern.
- Skew compression indicates a decrease in downside hedge demand, and the options structure around $80,000 is becoming more balanced.
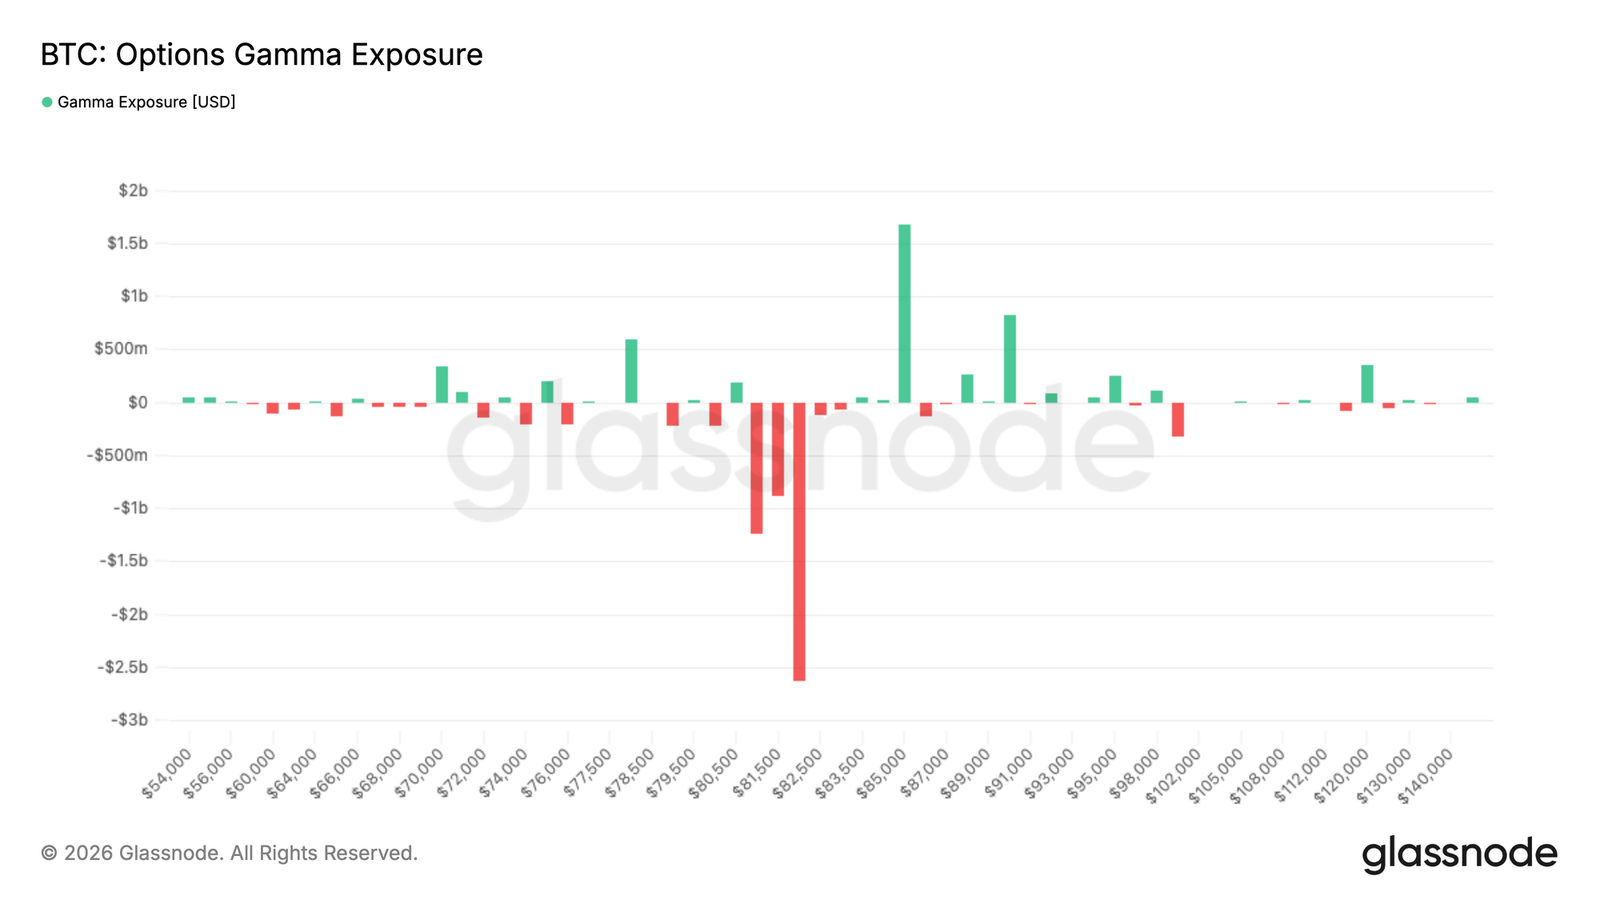
- Market maker positions are still a key driver of short-term dynamics; a large negative Gamma cluster near $82,000 could amplify price moves if spot re-enters that area.
Macro Insights
The macro background remains a tug-of-war between slowing economic growth and stubborn inflation. Recent U.S. inflation data has been stronger than expected, and the labor market is also proving more resilient than many anticipated. As a result, the market has pushed back interest rate cut expectations, with bond yields remaining high and financial conditions relatively tight.
Liquidity remains a critical driver for risk assets. The stock market continues to slowly rise, but the underlying environment remains fragile as the market adjusts to the reality of higher interest rates for longer. Meanwhile, the strength of oil and commodities continues to raise inflation expectations, especially against a backdrop of ongoing geopolitical tensions.
For digital assets, the outlook remains constructive but selective. Despite tightening liquidity conditions and a strong dollar, Bitcoin is showing resilience, indicating that underlying demand remains intact. However, soft ETF inflows and high real yields suggest that sustained upward movement may require looser financial conditions or new catalysts to reignite broader risk appetite.
On-Chain Insights
From Fear to Uncertainty
Against a macro backdrop of sticky inflation, high government bond yields, and tighter financial conditions, Bitcoin continues to demonstrate relative resilience, indicating that even when the broader risk environment remains unsettled, underlying demand remains strong. To assess the current cycle's position from a structural perspective, relative unrealized losses (measuring the total dollar value of all investors’ unrealized losses as a percentage of total market capitalization) provide an accurate barometer of the cycle. This metric peaked at 25% of market cap during the February flash crash, indicating significant pressure but still well below the extreme levels seen during previous bear cycles. Since reclaiming $80,000, this indicator has compressed to about 8%, a shift that transitions mainstream sentiment from fear to uncertainty rather than a complete collapse.
If $60,000 proves to be the low of this cycle, this round of the bear market will be the shallowest on record—reflecting fear but not reaching the broad washout typically marking a historically significant cycle bottom.
Capital Inflow Scale
As sentiment shifts from fear to uncertainty, a key question is whether the current rebound is a typical bear market bounce or an early stage of a genuine bull market transition. The most direct measure is to observe net capital inflow, specifically the 30-day net position change of realized market capitalization, which tracks monthly changes in total on-chain stored capital. With the recent rebound to $82,000, this metric has reached $2.8 billion per month, which explains the constructive momentum in recent weeks.
However, context is crucial: during the early stages of each major rise in the 2023-2025 bull market, this metric rapidly accelerated from around $2 billion to over $10 billion monthly. Current readings, while encouraging, still fall far below this threshold, indicating a lack of belief in the capital inflows supporting this recovery compared to similar turning points in prior cycles.
Support and Resistance Through Cost Basis Perspective
Although there has been a 37% rebound from $60,000 to $82,000, capital inflow remains moderate, and uncertainty persists. The realized price metric segmented by holding period provides a granular framework for identifying the most direct support and resistance levels. This model tracks the average purchase price of coins segmented by holding period, mapping behavioral anchor points of different investor groups onto price charts.
The current rebound momentum is primarily driven by the accumulation wave over the past 30 days, with this group’s cost basis currently around $76,900, forming the most direct short-term support floor. Above, the cost basis of investors accumulated during the market consolidation from November to February is concentrated around $86,900, representing the recently most likely resistance zone as these holders approach breakeven and face increasingly strong distribution incentives.
Off-Chain Insights
ETF Demand Reconstruction
U.S. spot Bitcoin ETF inflows have clearly turned positive in recent weeks, as Bitcoin returns above $80,000, with ongoing inflows. After several months of unstable demand and significant outflows in the first quarter, the latest shift indicates that institutional demand is beginning to reemerge in a more meaningful way.
Importantly, the recovery of ETF demand has maintained its persistence and is not driven by a single allocation surge, indicating that institutions are steadily accumulating as market conditions improve. The intensity of inflows has also accelerated with price, reinforcing the view that traditional capital is again supporting momentum rather than exiting during the rebound.
The current structure shows a significant improvement in market structure compared to earlier this year. ETF inflows are now a tailwind rather than a source of ongoing selling pressure, reducing one of the key resistances that previously limited recovery attempts. If sustained, ongoing institutional accumulation could provide the demand foundation needed for Bitcoin to challenge higher supply areas in the coming weeks.
Coinbase Spot Buying Accelerates Again
Coinbase spot volume has sharply turned positive in the past two weeks, as aggressive buyer activity returns with Bitcoin reclaiming the low $80,000s. This latest shift contrasts sharply with most of the first quarter, which experienced persistent selling pressure that reinforced downward momentum.
Importantly, the latest rise is accompanied by a repeated increase in positive spot buying volume rather than isolated spikes, indicating that sustained demand is beginning to absorb the upper supply. The increased activity on Coinbase is also highly consistent with the recovery of ETF inflows, suggesting that both domestic and institutional buyers in the U.S. are reengaging.
The current structure indicates that spot demand is once again becoming a support force for prices rather than a source of distribution. The continuous strength of Coinbase buyer flows, especially in conjunction with rising ETF inflows, indicates that market confidence is improving and that the underlying demand situation of the latest rebound is healthier.
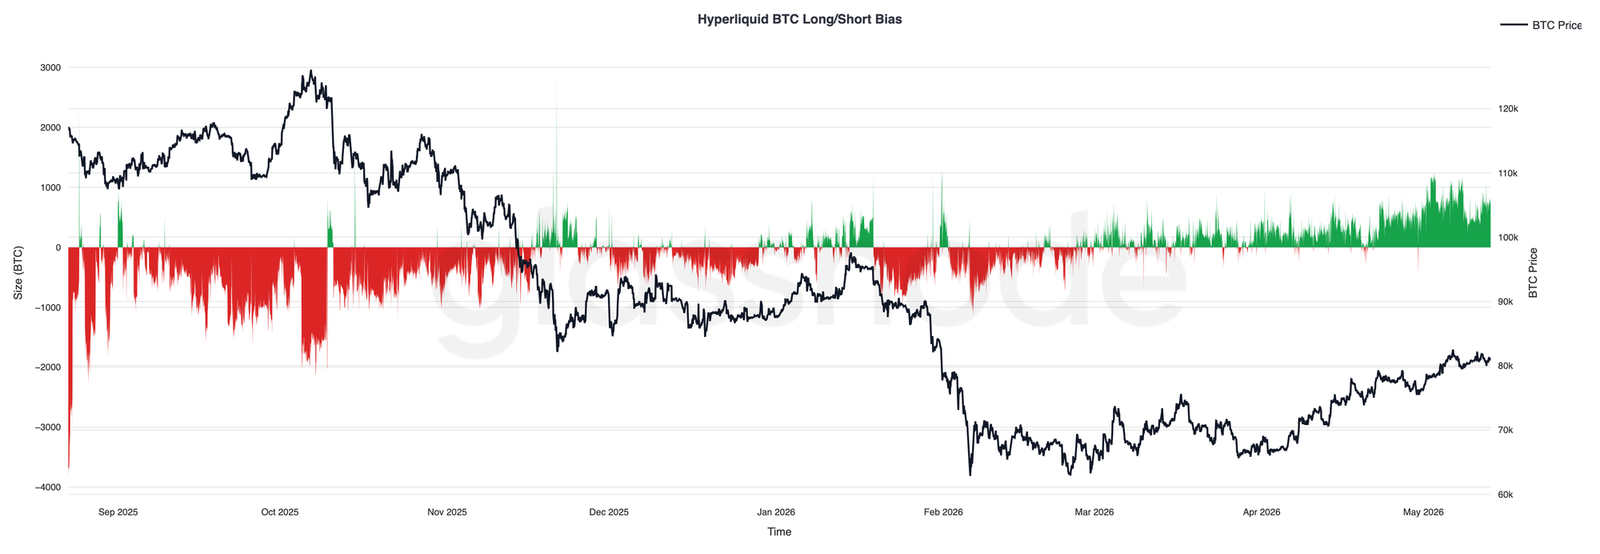
Hyperliquid Traders Increasingly Bullish
In recent weeks, positions on Hyperliquid have increasingly tilted towards bullish as Bitcoin rebounds to the low $80,000s, and BTC net positions are steadily rising. This shift marks a significant reversal from the predominant bearish bias that characterized much of the first quarter when the market fell to the low $60,000s.
Importantly, the recent increase in long exposure has developed gradually rather than through a single crowded position surge, indicating that traders are steadily rebuilding directional long exposure as market conditions improve. Net positions are currently approaching the strongest bullish tilt since late 2025, reflecting increased confidence in continued upward momentum.
With price action rising along with sustained long positions, this indicates improving trader sentiment and a more constructive speculative backdrop, although increasingly crowded long positions may make the market more sensitive to short-term volatility and liquidation-driven pullbacks.
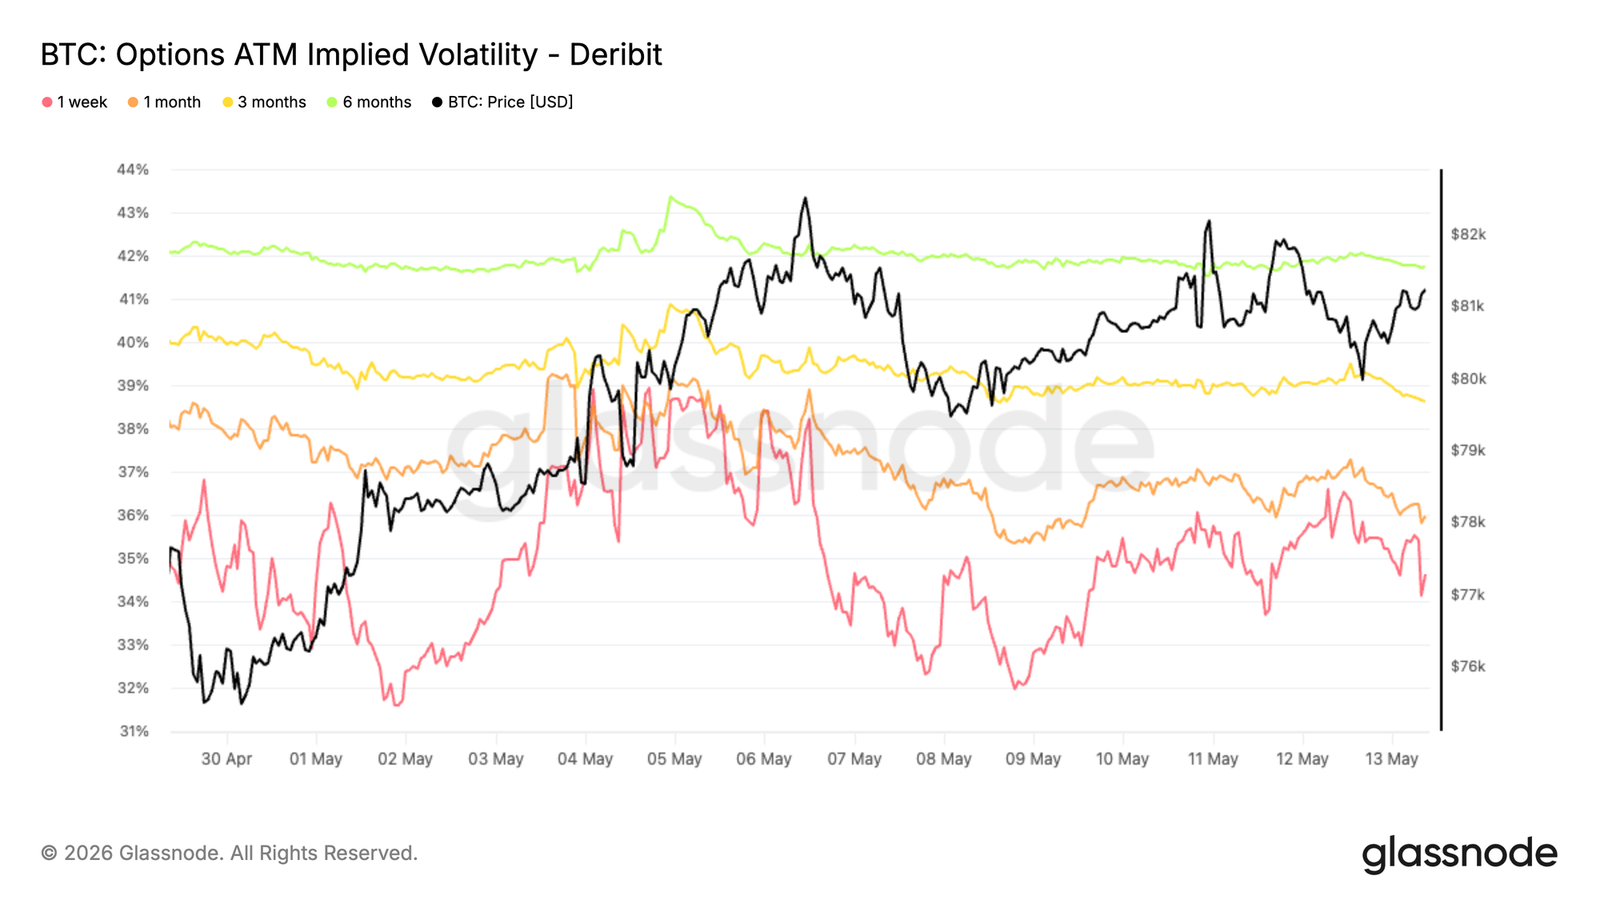
Implied Volatility Declines
In the past week, Bitcoin implied volatility has turned downward, dropping from 39% to 34.6%. Longer durations have also decreased, with the curve dropping about 1 to 2 volatility points across all terms.
This trend reflects an overall repricing of the term structure downward as traders reduce expectations for short-term realized volatility. The decline follows a recent volatility rebound and is accompanied by more controlled spot action, reinforcing the view that the market is returning to a calmer pattern.
As implied volatility compresses, option costs across various terms decrease, especially at the front end, which is most sensitive to short-term position and demand changes.
The current structure reflects a reduction in the market’s pricing for significant moves ahead, with volatility supply continuing to outpace demand across the curve’s various terms.
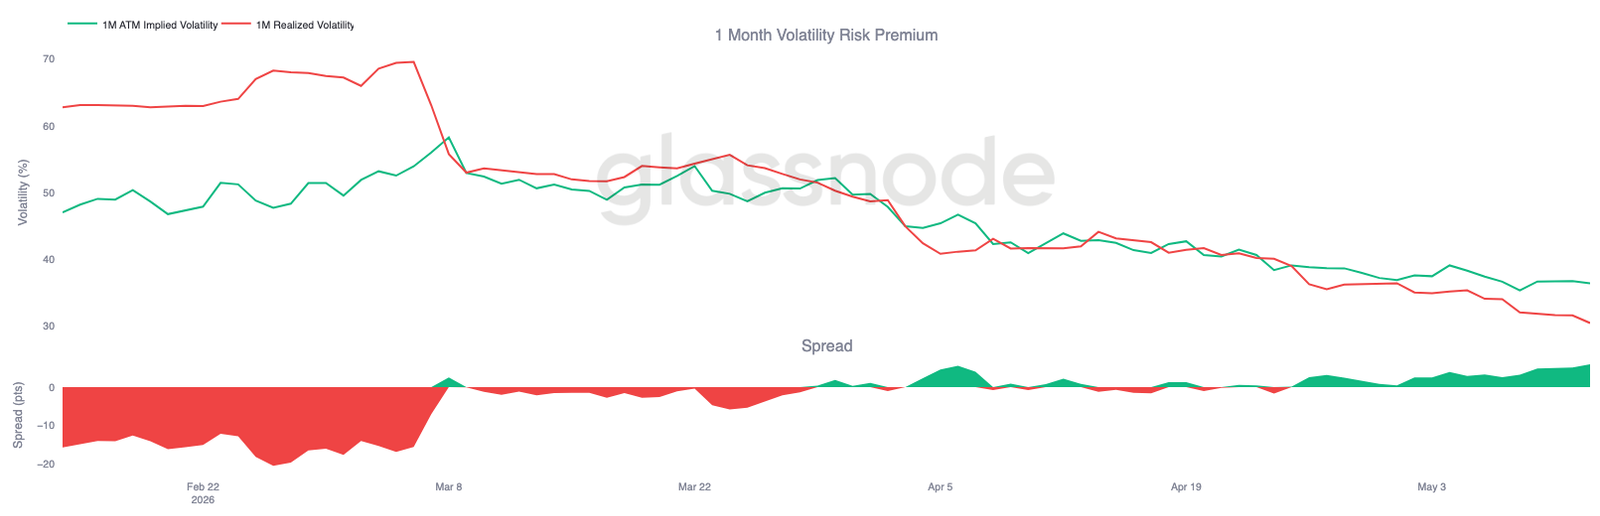
Volatility Risk Premium Remains Positive
Although implied volatility continues to compress across all terms, realized volatility is declining faster. Bitcoin’s 30-day realized volatility is currently at 30.48%, continuing to decline steadily over the past few weeks as spot action remains relatively controlled.
Meanwhile, the previous month’s implied volatility remains around 36.4%, still higher than realized and maintaining a positive volatility risk premium. In other words, options continue to price in more volatility for upcoming Bitcoin spot volatility deliveries than recently observed.
The spread between implied and realized volatility has also been rebuilding over the past two to three weeks, rising back to near 6 volatility points after briefly compressing to parity in April. This suggests that although overall volatility resets downwards, option demand remains high relative to realized volatility.
Thus, even though overall volatility continues to soften along both the implied and realized dimensions, hedging conditions still favor volatility sellers.
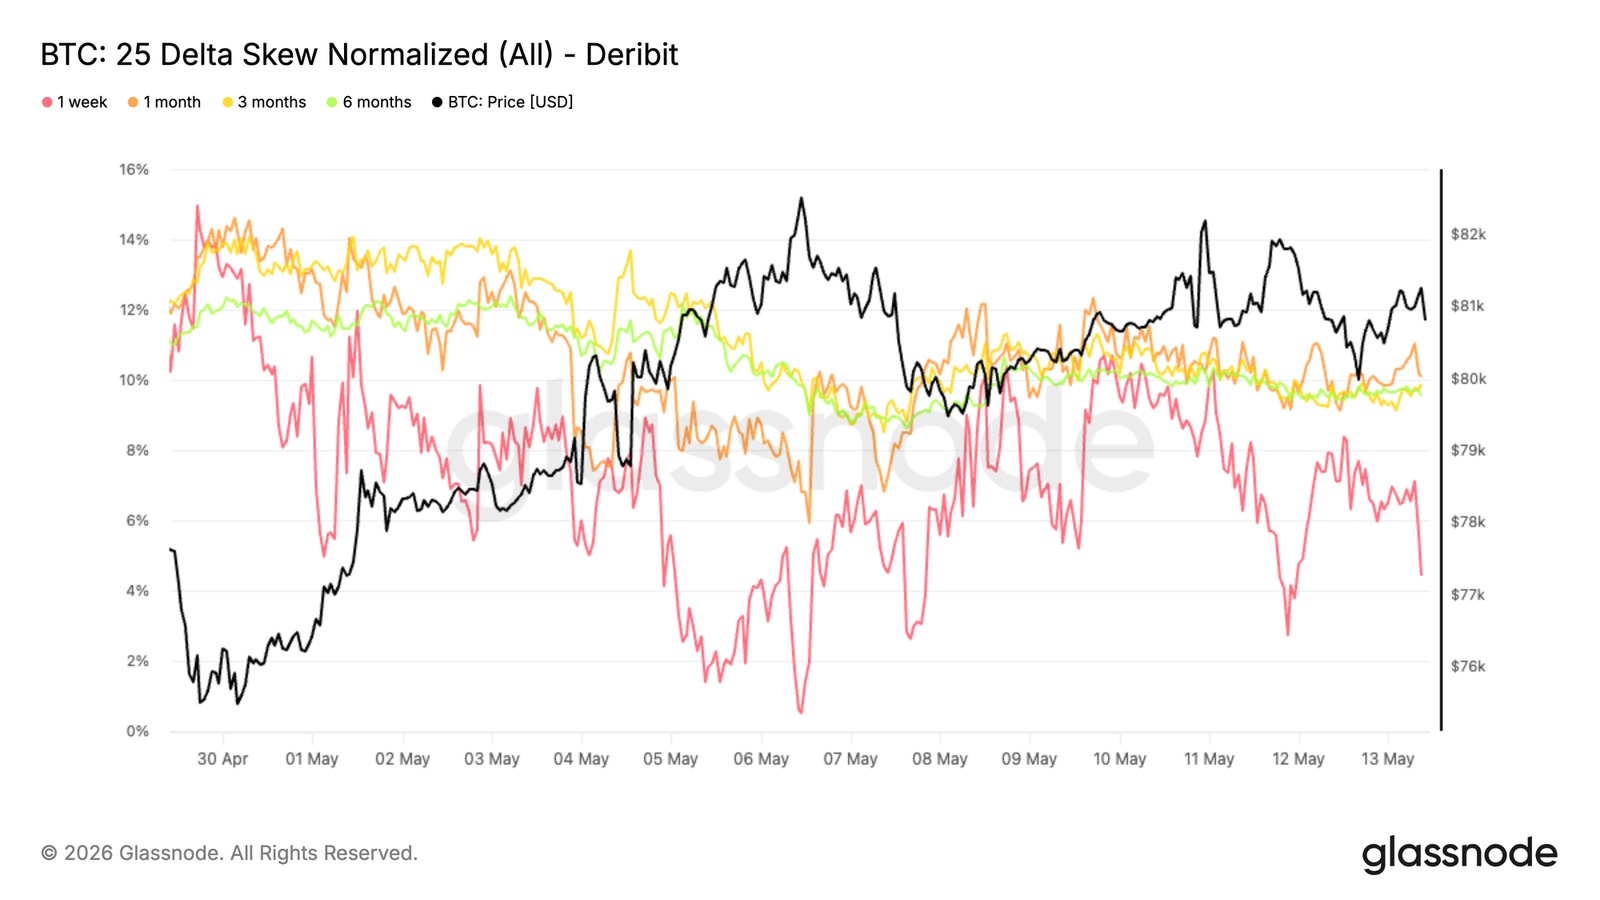
Skew Compression Indicates Decreased Downside Hedge Demand
As volatility expectations continue to reset downward, skew is also normalizing across all terms. This trend is most evident at the front end, where the 1-week 25 delta skew has compressed from about -10% to -4% over the past week. Longer terms have also softened, with 1-month, 3-month, and 6-month terms losing about 1 to 2 points of bearish premium.
It is noteworthy that this compression occurs in the context of Bitcoin consolidating around the $80,000 range with weak macro support. The option surface does not indicate increased demand for downside protection, but rather continues to reprice towards a more balanced structure.
This upward trend reflects a steady decrease in premium for put options relative to call options, suggesting that downside protection demand across all terms is gradually weakening rather than strengthening.
Although the skew remains in bearish territory across all terms, the ongoing compression indicates that downside hedge demand is gradually easing rather than intensifying.
Market Maker Gamma Keeps Spot Sensitive Around $82,000
Market maker positions continue to create responsive structures around current price levels. The largest concentration of negative Gamma is at the $82,000 strike price, with an exposure of about $2.6 billion, while positive Gamma accumulates near $85,000, close to $1.8 billion.
As spot remains below the negative Gamma cluster at $82,000, a return to that area could trigger responsive market maker hedging flows, enhancing momentum and amplifying price movements. Higher up, the positive Gamma concentration near $85,000 could suppress volatility.
Capital flows also reflect a shift in positions. In the past week, put options purchasing accounted for 71% of premium flow, reflecting high demand for downside protection during the recent consolidation period. In the last 24 hours, 58% of flow came from put option selling, indicating that some hedges are being unwound.
This structure increases sensitivity to amplifying hedge flows if spot re-enters the large negative Gamma cluster around $82,000.
Conclusion
In summary, Bitcoin's recovery continues to strengthen beneath the surface, driven by spot-led demand, renewed ETF inflows, and improved speculative positions, contributing to a more constructive market structure. The sharp compression of relative unrealized losses, along with the stabilization of key on-chain profitability and liquidity metrics, suggests that the decline from February is increasingly viewed as a periodic reset rather than the start of a deeper bear market.
At the same time, the characteristics of this rebound are distinctly different from the aggressive expansions seen during the 2023-2025 period. Capital inflows are recovering, but still well below prior breakout thresholds, while volatility compression and calmer derivatives positions indicate that the market is gradually rebuilding confidence rather than entering a phase of euphoria. This makes the current rise appear more like a recovery with structural support rather than a fully confirmed momentum breakout.
As Bitcoin now re-enters the densely packed upper supply area between $82,000 and $87,000, the market is entering a region where price discovery becomes increasingly important. To sustain this area, stronger spot participation and deeper capital rotation may be necessary to absorb the remaining upper supply. Until then, broader structures continue to improve, but confidence appears to still be in the process of rebuilding rather than having fully returned.
免责声明:本文章仅代表作者个人观点,不代表本平台的立场和观点。本文章仅供信息分享,不构成对任何人的任何投资建议。用户与作者之间的任何争议,与本平台无关。如网页中刊载的文章或图片涉及侵权,请提供相关的权利证明和身份证明发送邮件到support@aicoin.com,本平台相关工作人员将会进行核查。


