Realized price 53400 as a potential bottom, can Coinbase's buying pressure turn the situation around?
Written by: Glassnode
Translated by: AididiaoJP, Foresight News
Bitcoin has fallen below $60,000, as profit-taking, ETF outflows, and defensive option positions continue to suppress market sentiment. Although signs of value realization and selective accumulation are increasing, widespread demand has yet to emerge.
Summary
- Bitcoin is currently trading at $62,300, a 19% discount compared to the true market average of $77,000. The cost basis for short-term holders has dropped to $71,400, indicating new buyers are accumulating for the first time below the cycle average price, which is a constructive early step towards forming a bottom. (As of the time of writing, Bitcoin has dropped to $60,800)
- The 90-day moving average of net realized profit and loss is at -$205 million per day, confirming that the market is deeply embedded in a loss-dominated environment, with the focus leaning towards the realized price of $53,400 rather than the true market average.
- The intense supply cluster of short-term holders is located in the $66,800-$70,700 range, forming the most immediate resistance above. Before reclaiming that area and opening the path to the short-term holders' cost basis, upward space is limited.
- ETF outflows continue: institutional demand remains weak, with GBTC accounting for the largest share of recent redemptions.
- Coinbase buyers are returning: U.S. investors are showing buying activity, while Binance traders are still maintaining a defensive posture.
- Spot market dominates sell pressure: the selling pressure comes from the spot market, with derivatives mainly following rather than driving.
- Implied volatility stabilizes near recent lows, while realized volatility remains high, with volatility risk premium maintaining a negative value.
- Demand for downside protection across various maturities is rebuilding, with skew markedly rising, despite the overall volatility pricing being relatively restrained.
- Recent capital flow has shifted towards selling premiums, while market maker positions remain predominantly long gamma in the $60K-$64K range, helping to keep volatility contained near current spot levels.
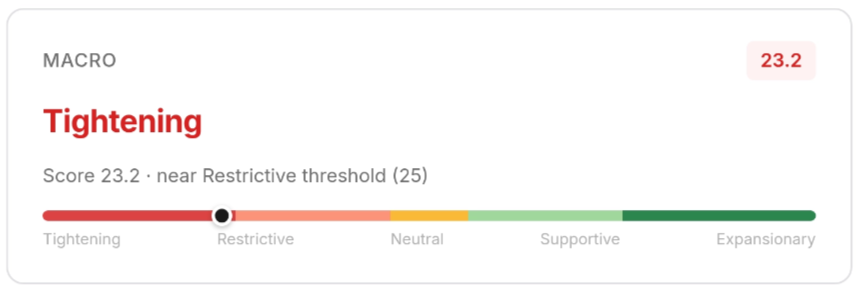
Macro Insights
The U.S. dollar index has returned above its 200-day moving average. On June 23, DXY reported 101.37, a substantial rebound from 99.24 30 days ago, and for the first time since the "liberation day" spike in April, it stood above the 200-day moving average of 98.72. The bullish sequence has not materialized.
The 10-year U.S. Treasury yield is holding at 4.50% with no signs of a decrease. VIX has risen from an intra-week low of 16.2 to a Friday close of 19.49, which, while not at panic levels, indicates a directional change worth noting. The stock market has digested the spring pullback, with the S&P 500 index at 7,365 points, up 14% from its April low and comfortably above its own 200-day moving average of 7,007 points.
Bitcoin has not participated in this recovery. Currently, BTC is priced at $62,651, 18% lower than its 200-day moving average of $76,466. The macro recovery remains a stock market story, supported by the resilience of U.S. corporate earnings. For Bitcoin, the renewed strength of DXY is a dominant signal, which is not favorable for BTC.
On-chain Insights
Deep Discount Area
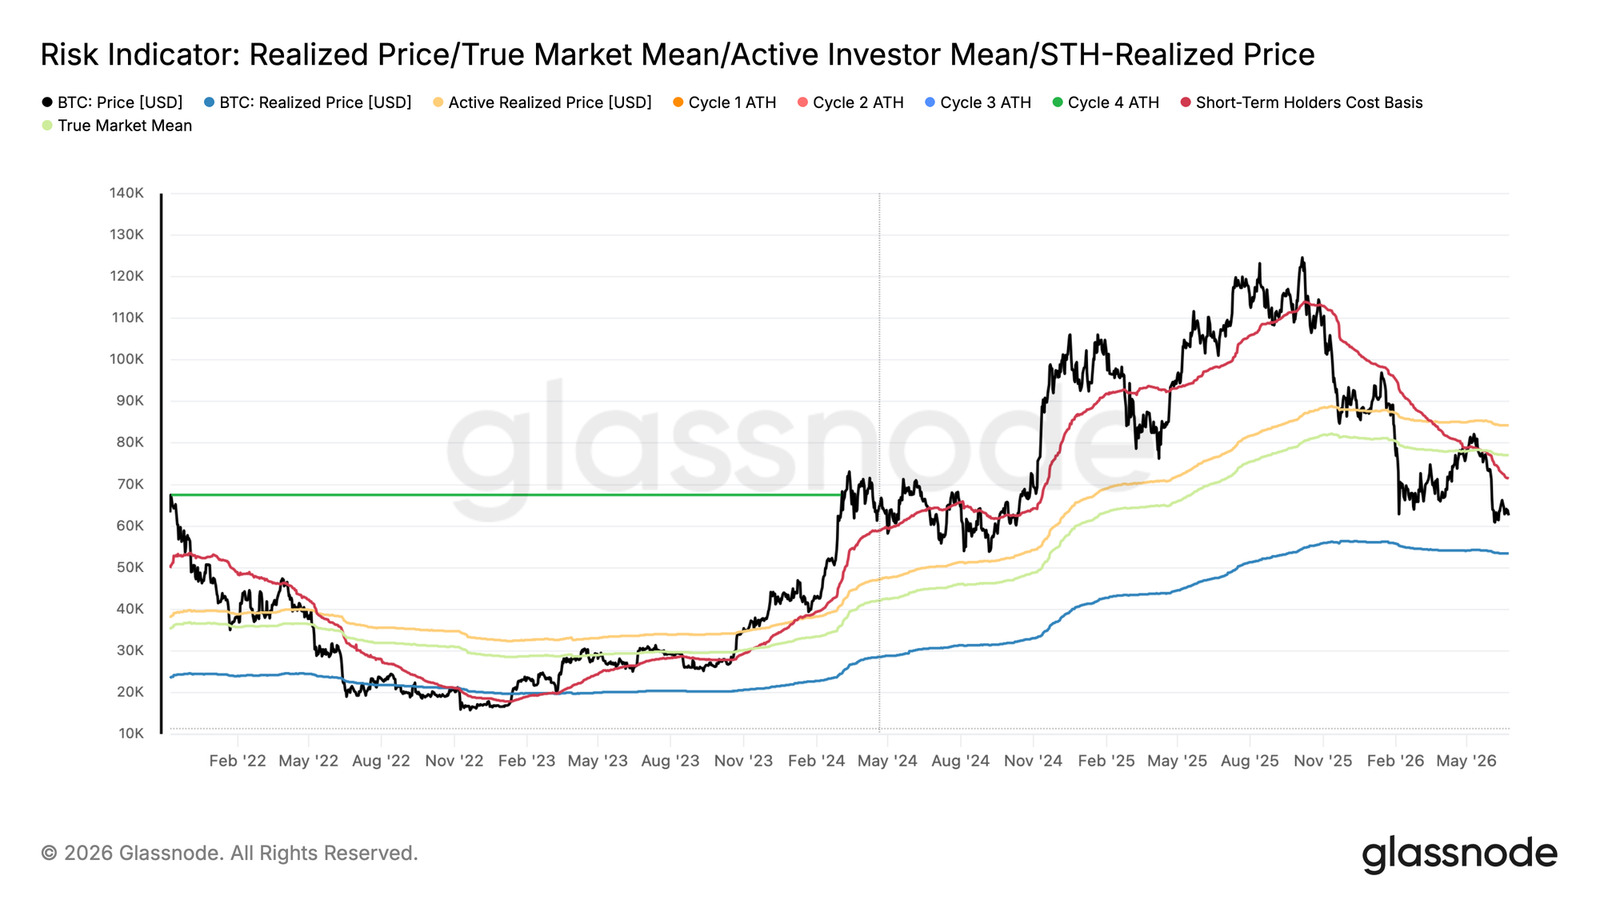
Bitcoin's current price is $62,300, far below the true market average of $77,000. The true market average is the average cost basis of active non-miner investors and is a key threshold for distinguishing between bear and bull markets. Currently, a 19% discount indicates that prices are still deeply trapped within a structural bear market range.
It is worth noting that the cost basis for short-term holders has dropped to $71,400, reflecting significant accumulation by new buyers below the true market average. From a cyclical perspective, this is a constructive development, marking a key step in the formation of a bottom—new capital is being deployed at a price increasingly decoupled from the recently overheated levels.
Supply bought during this bear market stage has a smaller loss magnitude compared to the broader cycle's hanging supply, suggesting that it will exhibit greater resilience to further pullbacks. If a macro-driven downturn occurs in the coming weeks, the realized price of $53,400 could become a reasonable lower limit for the short- to medium-term bear market range.
Gravity Pulling Downward Range
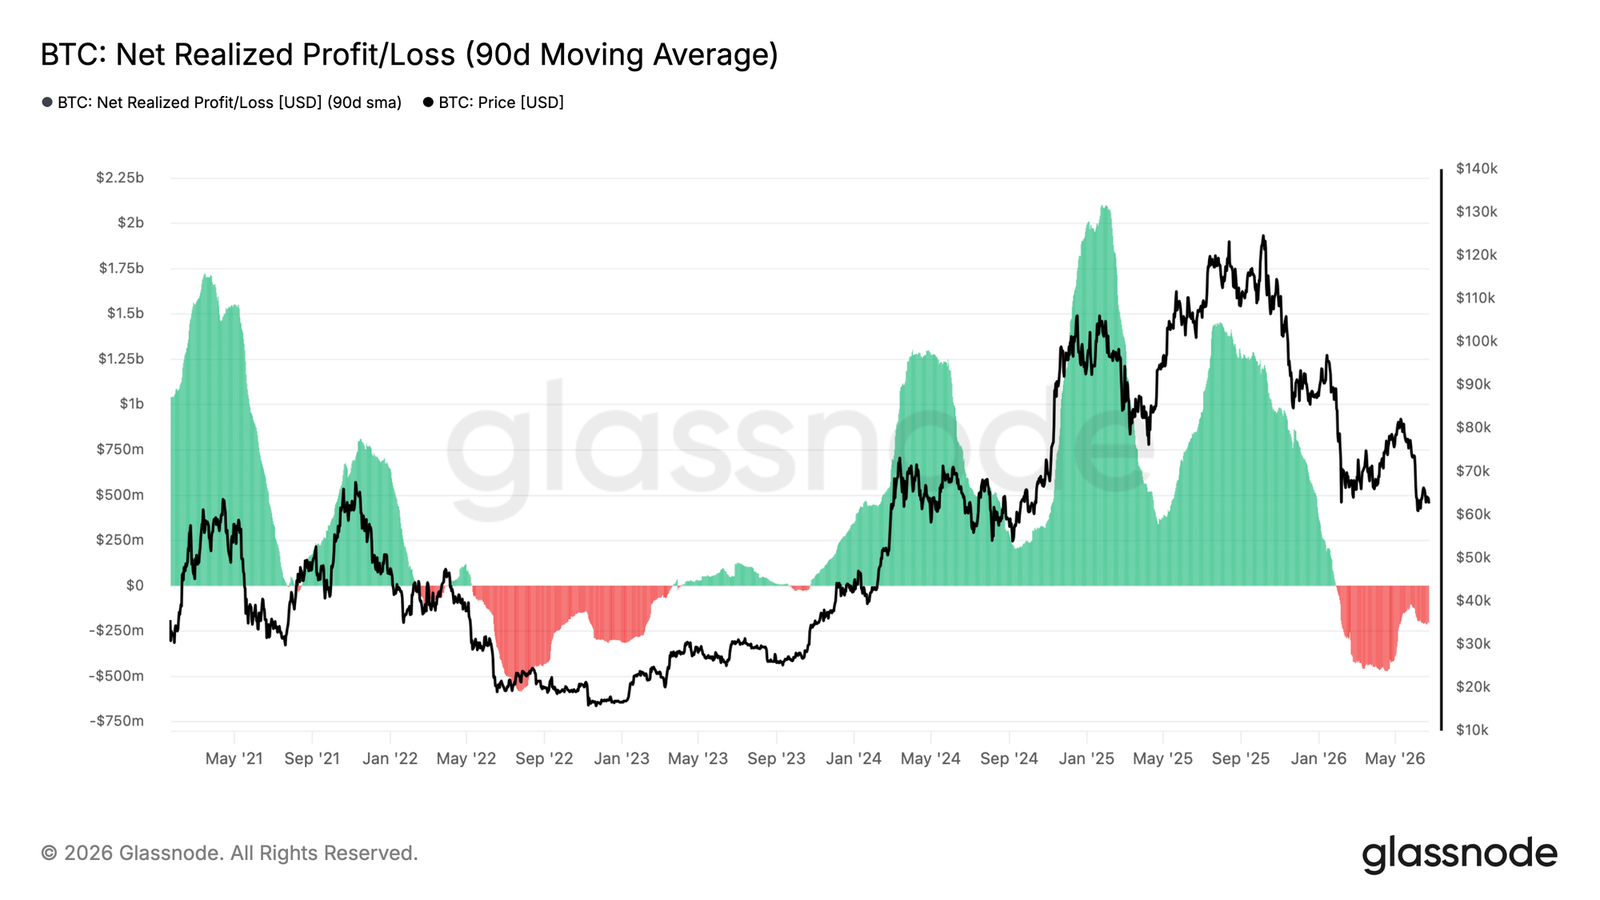
After establishing a bear market range of $53,400-$77,000, the next question is which end of the price range is more likely to converge. The net realized profit and loss metric measures the net balance of crystallized profits and losses in the market (in USD), effectively capturing whether predominant spending behavior is profit-taking or capitulation.
The 90-day moving average of this metric is currently at -$205 million per day, confirming that loss realization has become the dominant force of a broader trend, indicating that the market's focus still leans towards the lower end of the current range (closer to the realized price).
As this is a slowly moving average, this reading reflects a deeply embedded loss-dominated environment rather than a singular pressure event. If this metric rebounds to neutral levels (close to zero), it would be a strong signal indicating that seller exhaustion is forming, with pre-bull market transition conditions beginning to emerge.
Upper Supply Limits Short-term Movement
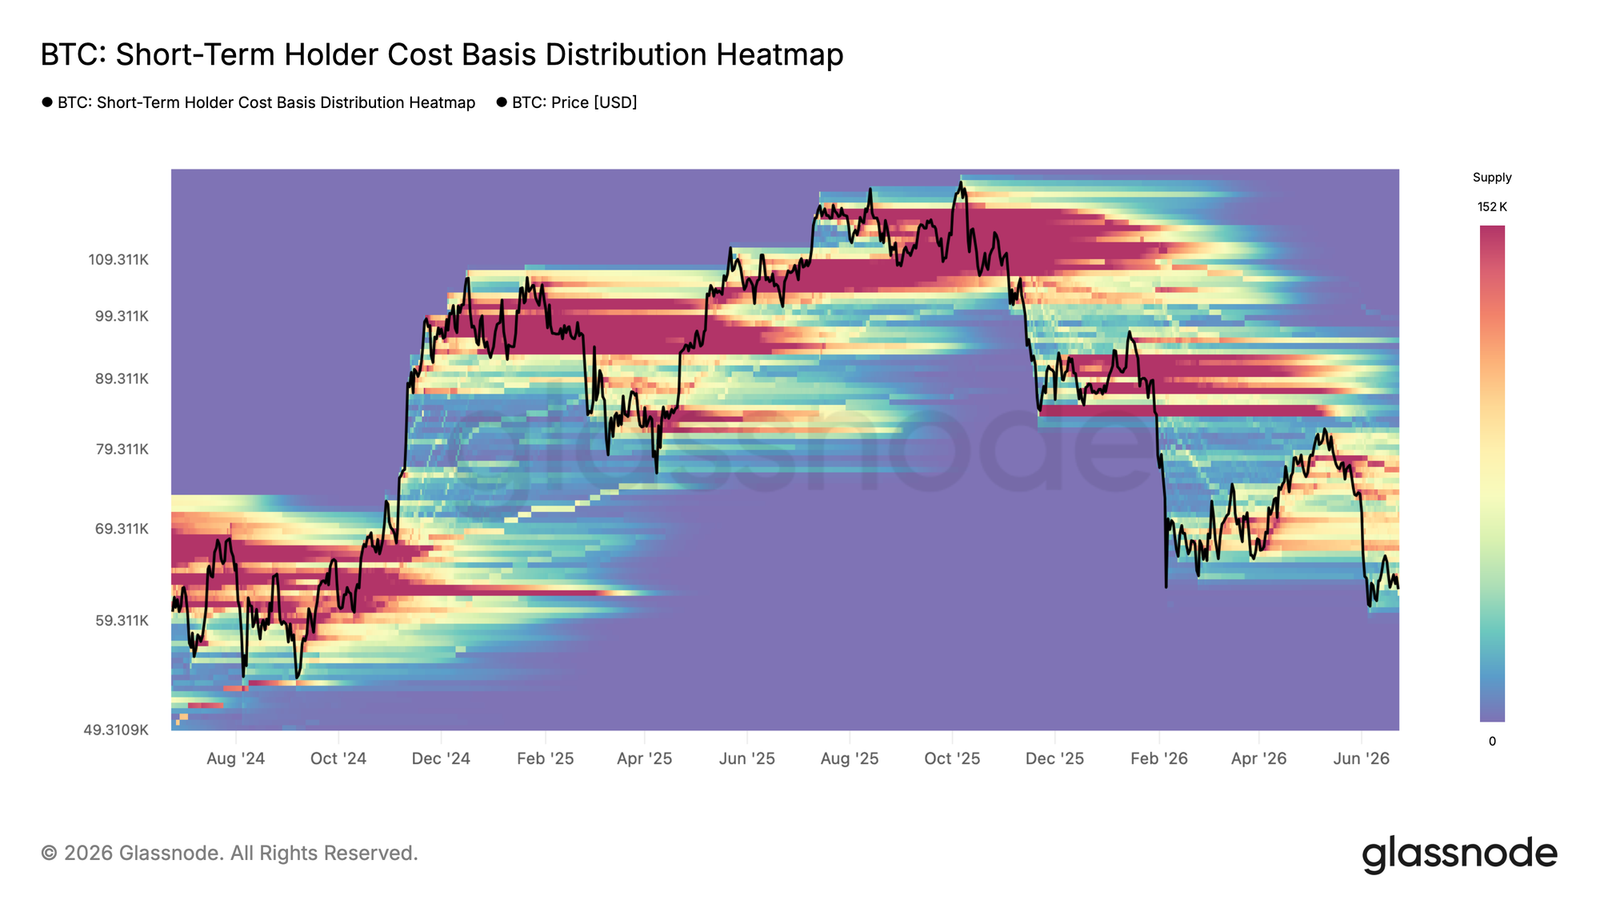
In addition to a broader negative capital flow environment, the localized concentration of short-term holder supply above the current spot further drags down prices. The most significant cluster is located in the $66,800-$70,700 range, representing tokens accumulated recently that are now at a loss, likely generating sell pressure during any rebound attempts.
This area effectively defines the most likely ceiling for short-term consolidation or relief bounces, as holders within the range tend to exit near their breakeven point when prices approach their entry cost. If it can consistently reclaim above $66,800, it will significantly alleviate upward pressure and increase the probability of extending towards the short-term holders' cost basis of $71,400. Until then, this localized hanging supply remains an active anchor to suppress upward momentum.
Off-chain Insights
ETF Outflows Continue
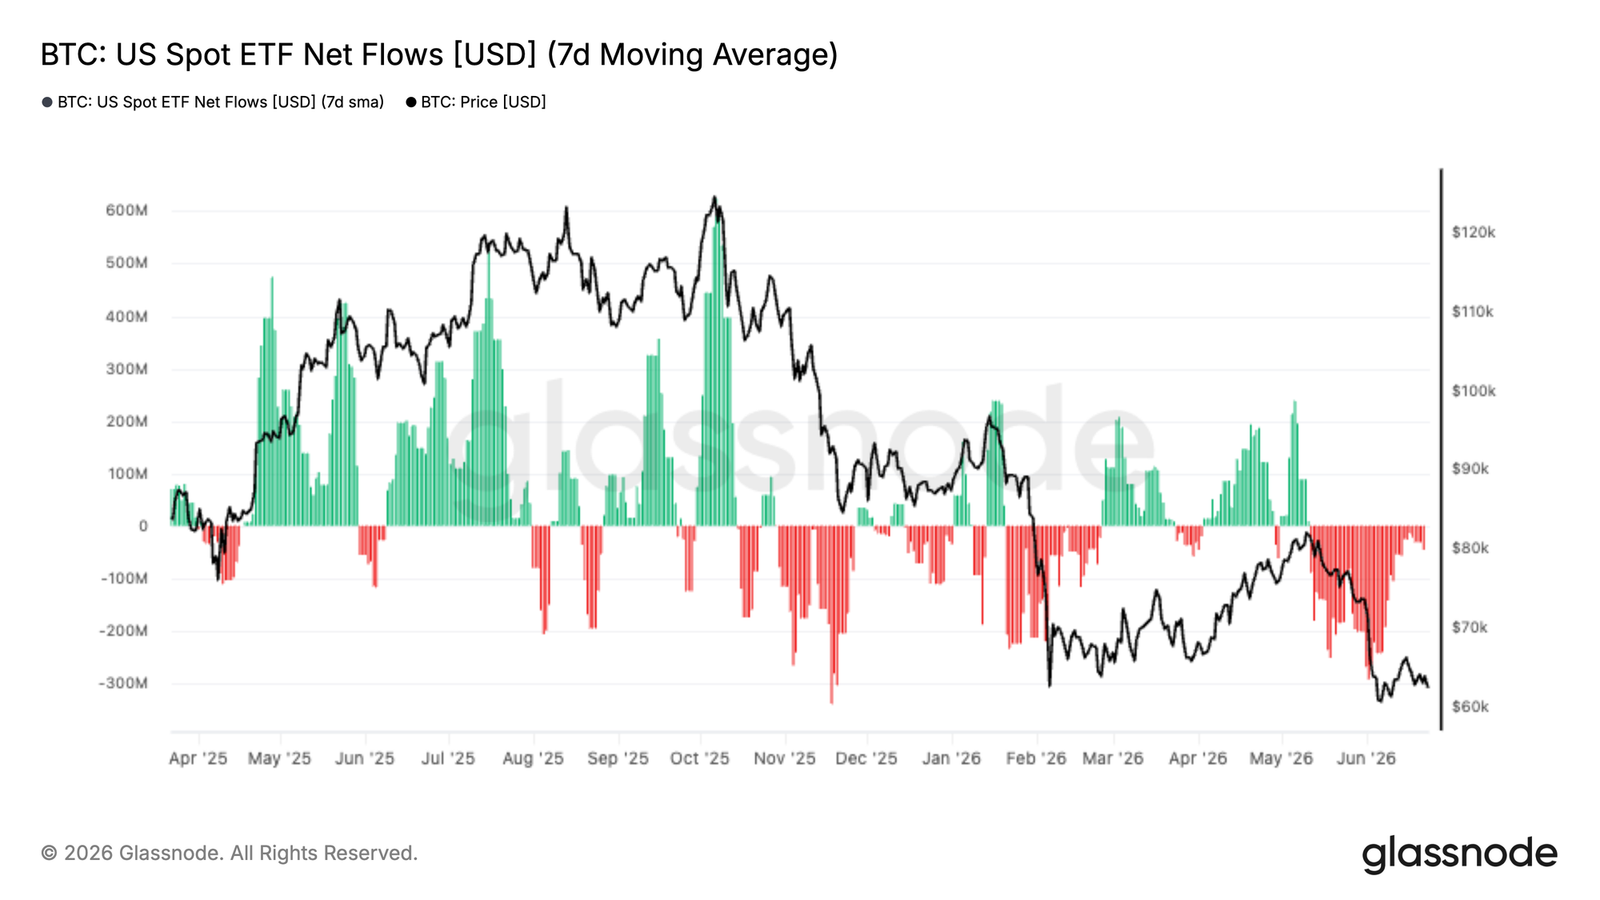
This week, institutional demand continues to be under pressure, with the average net outflow from U.S. spot ETFs nearing -$300 million per day over the past seven days, one of the most sustained periods of fund withdrawal since the ETF's launch. The scale of outflow and the duration indicate that, despite Bitcoin trading at the lower end of recent ranges (around $60,000-$65,000), traditional investors remain in a defensive posture.
It is notable that past corrections often attracted ETF buying, providing an important source of demand during weak periods. However, this sustained redemption shows that many investors are opting to reduce exposure rather than accumulate during pullbacks.
Although overall ETF outflows are negative, the redemption distribution is uneven. Grayscale's GBTC continues to account for the largest redemption share, with over 16,000 BTC flowing out in the past 90 days. This indicates that weakness is primarily driven by legacy holders liquidating and rebalancing portfolios, rather than a unified retreat from the entire ETF sector.
Spot Buyers Begin to Return
After experiencing prolonged aggressive selling pressure, spot market positions are starting to improve. While the overall spot CVD deviation remains negative, recent rebounds indicate that net selling intensity is easing, helping Bitcoin stabilize at the lower edge of the trading range.
The most significant development is the differentiation between exchanges. Coinbase's spot CVD deviation has rebounded significantly and returned to positive territory, indicating that the platform's buying pressure, usually associated with U.S. institutional participants, is returning. Meanwhile, Binance remains in negative territory, suggesting that overseas traders continue to maintain a defensive posture.
This behavioral differentiation points to an increasingly uneven market structure. Institutional investors seem to be absorbing supply during weakness, while speculative participants remain cautious. Although the broader spot market has not yet returned to sustained accumulation, the improvement in Coinbase demand indicates that some investors are starting to view the current prices as attractive entry levels.

Futures Follow Spot Drop
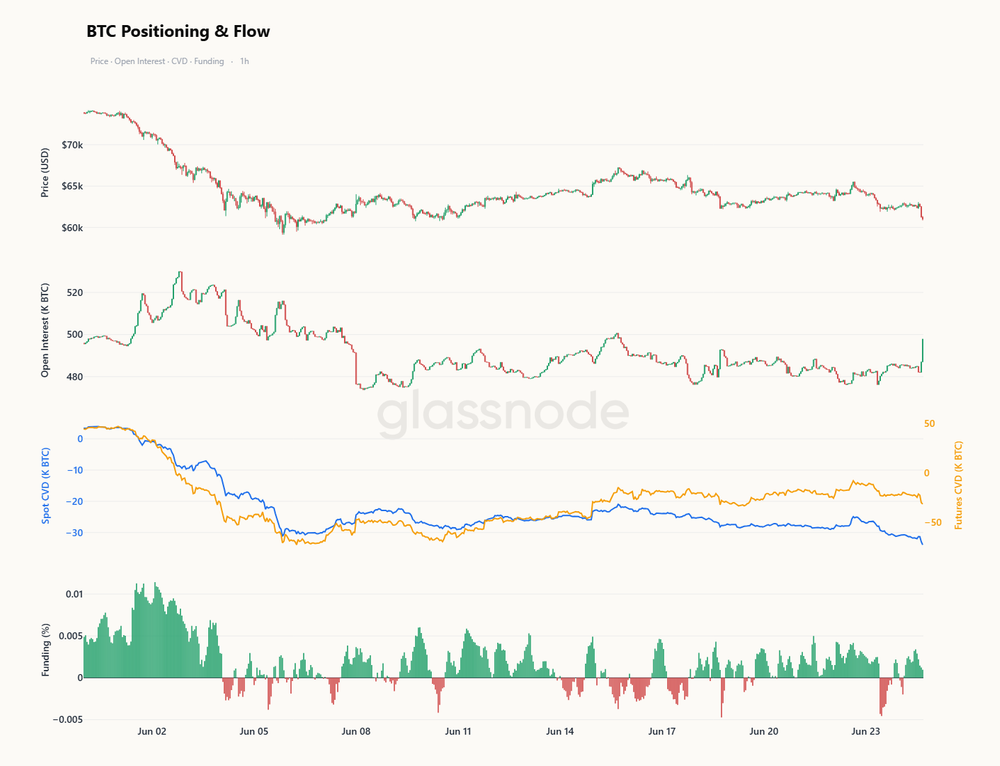
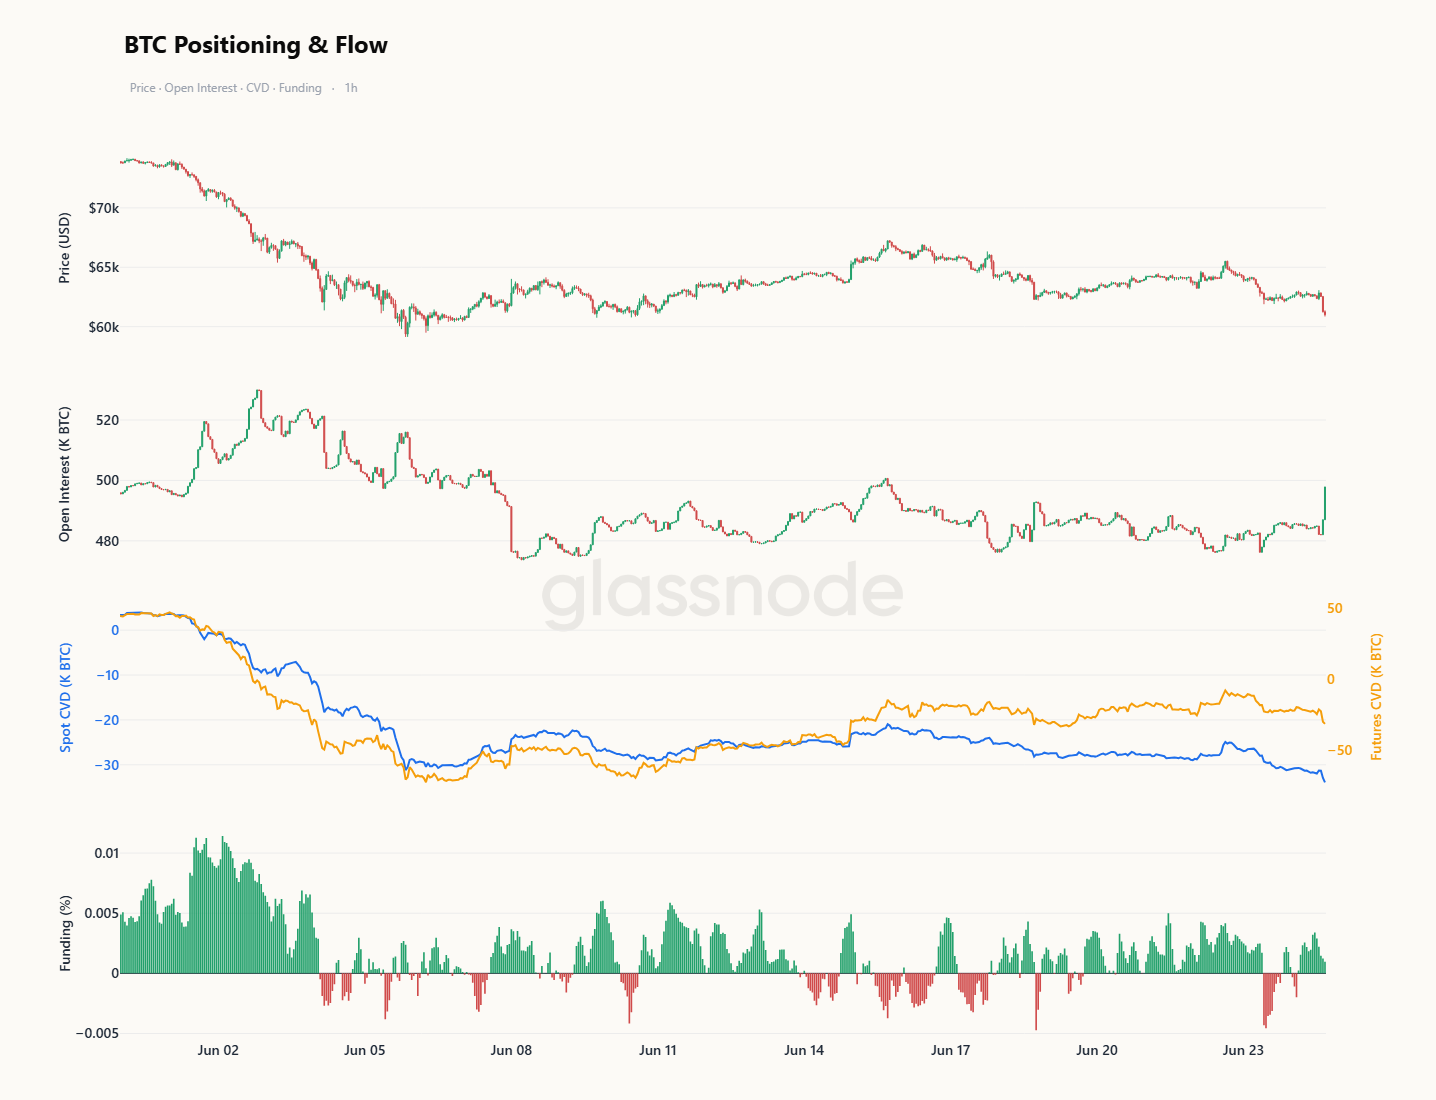
Over a shorter time frame, the pullback to the low $60,000 range is driven by spot dominance. Over the past ten days, the spot CVD has dropped much faster than the futures CVD, with this divergence indicating that aggressive selling pressure originates from the spot arena, rather than from leveraged liquidations. Open interest has remained low for most of this drop, and funding rates have stubbornly maintained positive values even as prices fell, showing that perpetual longs are reluctant to capitulate, implying that the pressure is not coming from the derivative books.
This situation is beginning to change. As Bitcoin retests lower levels, open interest has surged significantly, with futures CVD now turning negative alongside spot, indicating that leveraged participants are finally joining the trend rather than resisting it. At the same time, funding rates have retreated from high levels, easing the long bias that had become increasingly disconnected from price movements.
Spot has borne the primary burden during the decline, with derivatives now following rather than leading. If open interest continues to increase while futures CVD drops, and funding rates soften, it will confirm that leverage is conceding to the sell-offs in spot—that broad participation often signals a more intense and often more thorough liquidation phase.
Implied Volatility Stabilizes After Recent Repricing
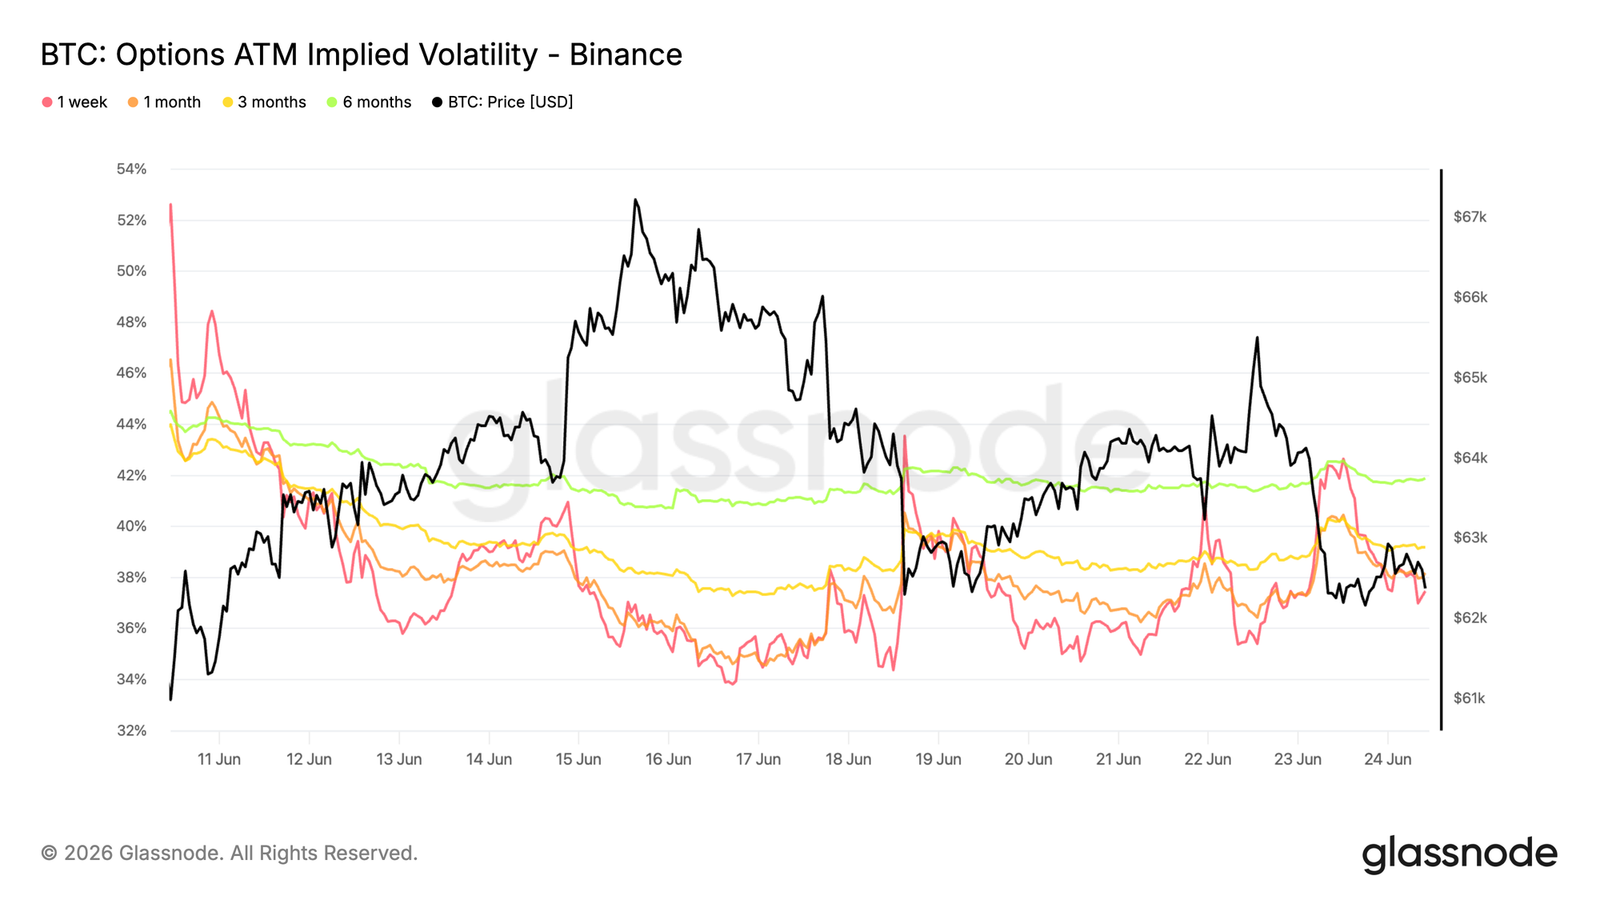
The options market has entered a calmer range after the sharp repricing triggered by Bitcoin's fall towards June lows.
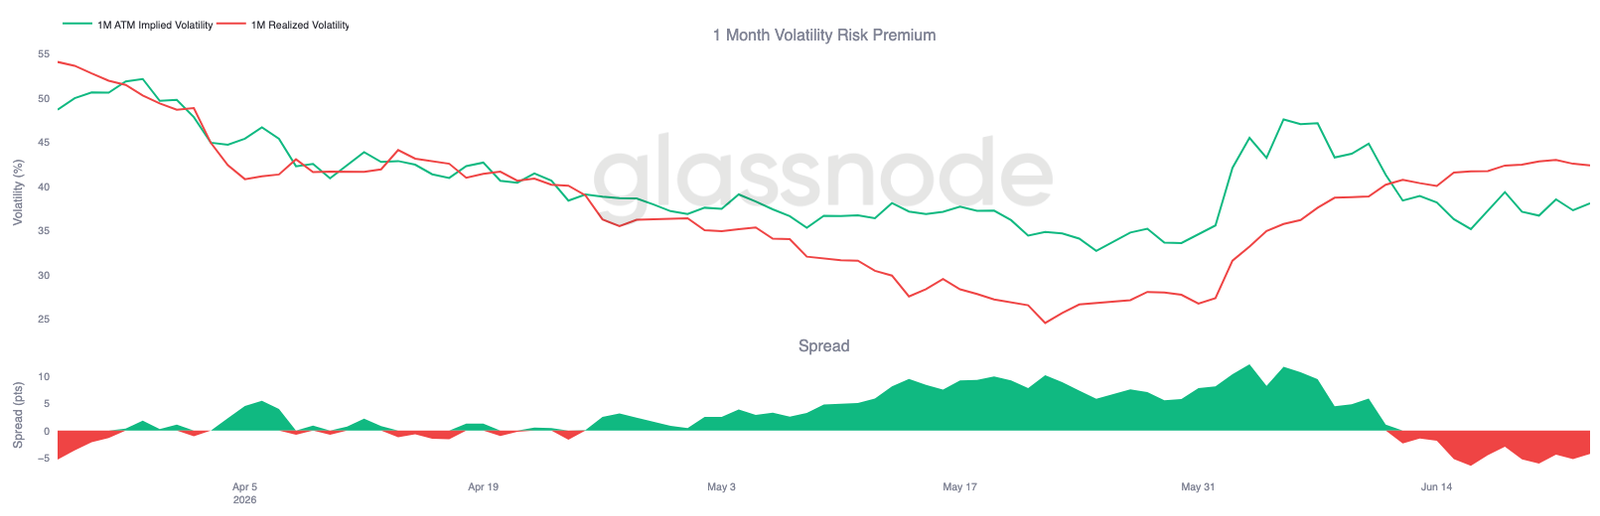
The front end of the curve remains the most sensitive part. The one-week ATM implied volatility briefly exceeded 42% during the recent sell-off, then fell back to around 37%. The one-month maturity dropped from about 40% to 38%, while longer maturities remained relatively stable, with three-month and six-month implied volatility nearing 39% and 42%, respectively.
Despite Bitcoin continuing to trade near major support around $60K-$63K, this stability has emerged. The lack of sustained volatility buying indicates traders are no longer aggressively repricing risk, as much of the protective premium from the recent pressure period has been removed.
Implied volatility has returned to a stable range, and the urgency for the options market to price additional short-term uncertainty is low.
Volatility Risk Premium Maintains Negative Value
After stabilizing implied volatility, the relationship between implied and realized volatility remains inverted, with the volatility risk premium retaining a negative value.
The one-month implied volatility is currently about 38%, while realized volatility continues to climb to around 42%. Therefore, the volatility risk premium is still negatively about 4 volatility points, continuing the reversal that began with recent market sell-offs.
Charts indicate that even after normalizing from the June highs, realized volatility remains elevated. In other words, the market's actual volatility exceeds the current pricing of options. While the discrepancy has narrowed slightly from recent extreme levels, implied volatility has not rebuilt sufficient strength to pull the spread back into positive territory.
As realized volatility remains higher than implied volatility, the options market continues to price a calmer environment than what recent price actions have demonstrated.
25 Delta Skew Rebuilds Across Maturities
With the negative volatility risk premium, the skew metric reveals how demand for downside protection evolves while Bitcoin trades near major support.
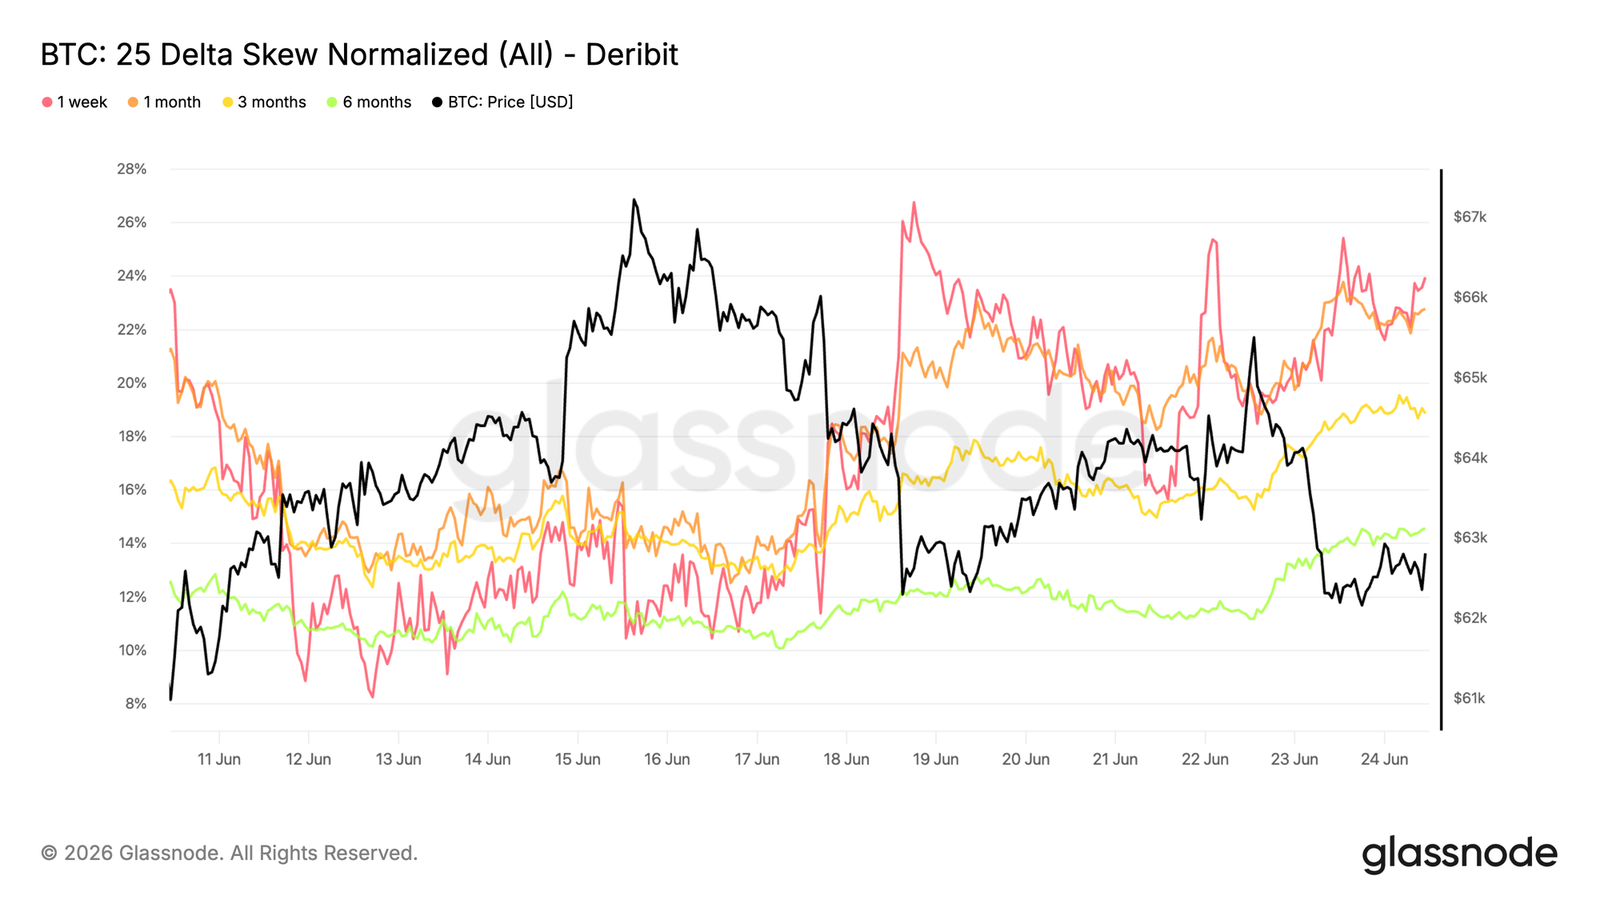
Skew is calculated as the volatility of put options minus the volatility of call options, with positive values indicating that puts are trading at a premium to calls of equal value. Over the past week, this premium has risen across the entire curve. One-week skew has increased from around 12% to 24%, one-month from about 14% to 23%. Three-month and six-month maturities have also risen, reaching approximately 19% and 14%, respectively.
Charts show that although implied volatility remains relatively stable, there is widespread repricing of downside protection. Traders seem less inclined to pay more volatility overall and are becoming increasingly willing to pay a premium for downside hedging.
Demand for protection across maturities has rebuilt, indicating that despite stable volatility levels, traders still prefer renewed downside hedging.
Gamma Exposure Concentrated Near Current Spot
Aside from pricing and sentiment, gamma exposure helps identify which strike price levels market makers' hedges may have the most significant impact on market dynamics.
Recent capital flows show traders are increasingly comfortable with selling premiums. Over the past seven days, put option sales accounted for the largest share of trading premium, reaching 31.2%. This trend has intensified over the past 24 hours, with put selling making up 47.2%.
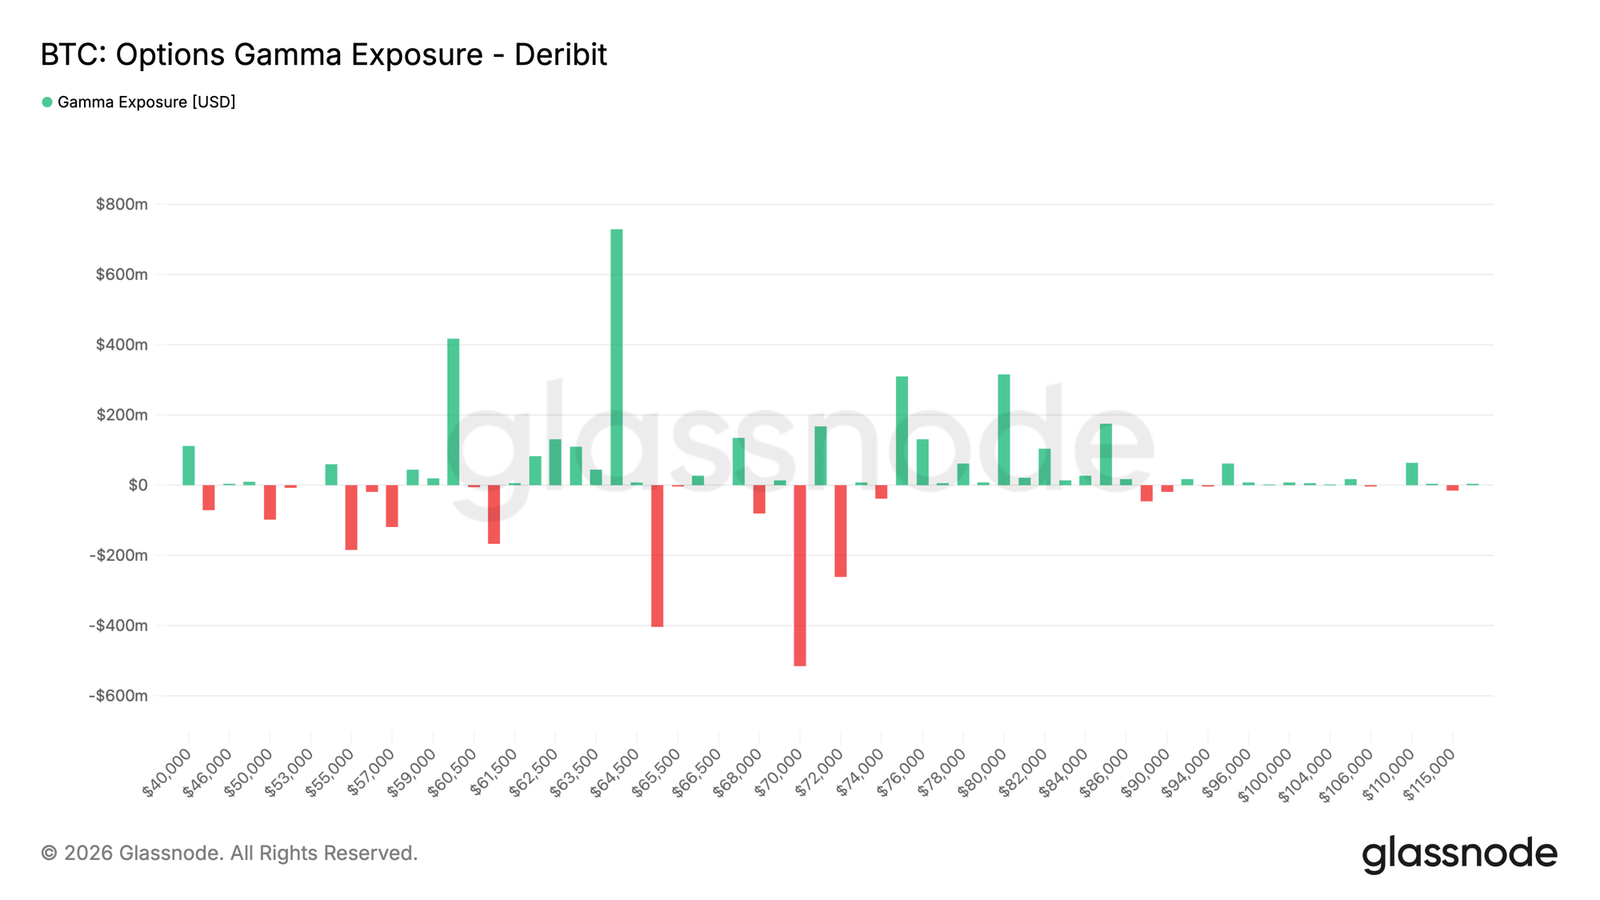
This shift is reflected in the gamma profile. The two largest positive gamma clusters are located at $60K and $64K, with Bitcoin currently trading between the two at approximately $62.8K. In the positive gamma range, market makers' hedging tends to suppress volatility, helping keep spot contained within the range. In contrast, recent negative gamma exposure is located at $65K and is significantly smaller than the positive gamma clusters at $64K.
Market maker positions remain predominantly long gamma near current levels, creating conditions that could keep volatility within the $60K-$64K range.
Conclusion
Bitcoin continues to trade in a market defined by caution rather than conviction. On-chain metrics show that the asset is at a deep discount relative to the average investor's cost basis, while continued loss realization indicates that the bear market remains firmly established. At the same time, ETF outflows and the defensive positions in the options market highlight the lack of broad risk appetite among institutions and derivative participants.
However, below the surface, early signs suggest that the environment is beginning to stabilize. Coinbase spot turnover is shifting towards constructive, the short-term holders' cost basis is adjusting downward, and recent weakness is mainly driven by spot sellers rather than excessive leverage. While these developments do not signal an imminent reversal, they align with the early stages of a bottom formation process.
Currently, the market remains caught in a tug-of-war between ongoing distribution and emerging value-driven demand, and the interplay of both will define Bitcoin's next major movement.
免责声明:本文章仅代表作者个人观点,不代表本平台的立场和观点。本文章仅供信息分享,不构成对任何人的任何投资建议。用户与作者之间的任何争议,与本平台无关。如网页中刊载的文章或图片涉及侵权,请提供相关的权利证明和身份证明发送邮件到support@aicoin.com,本平台相关工作人员将会进行核查。


