Coin Circle Li Ying: 7.3 Bitcoin (BTC) and Ethereum (ETH) Latest Market Analysis
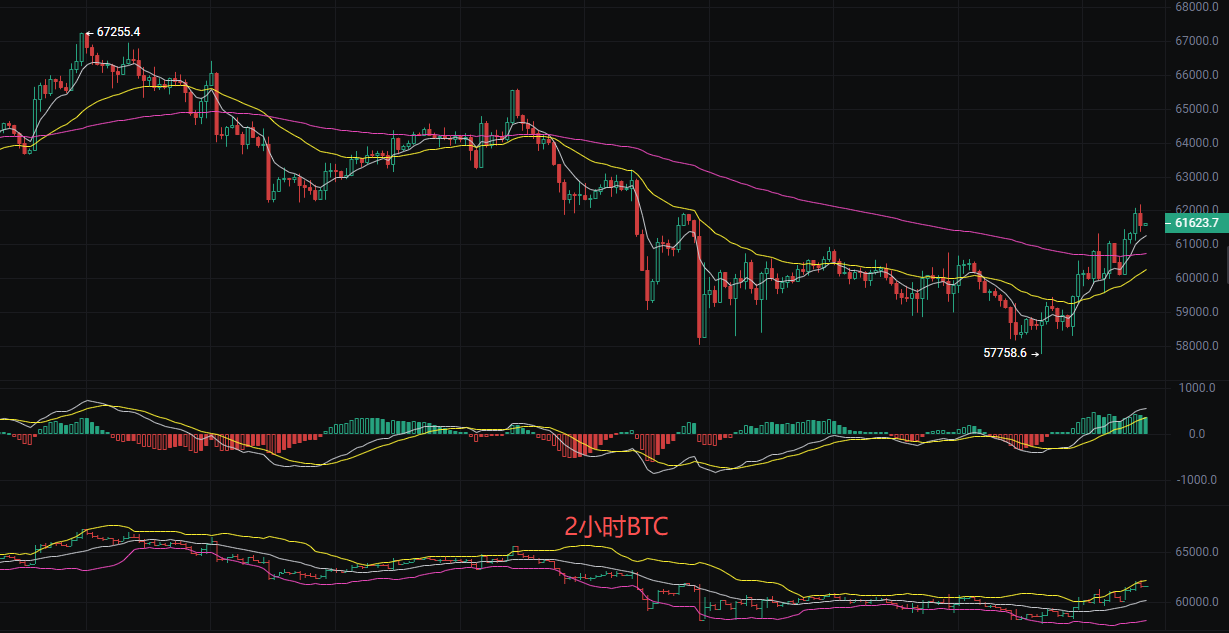
Bitcoin's current price is 61600. Family members have seen it plunge from a high of over 70000, with several waves of fluctuations in between. It seems to have stopped falling and is starting to consolidate, but don't rush to buy the dip; the position is awkward with layers of trapped positions above and no strong support below. Simply put, there's pressure above and support below, and both bulls and bears are in a tug of war! The EMA moving average system shows a bearish arrangement, and the MACD indicator shows both DIF and DEA are below the zero line, but the green bars are shortening and the fast line is turning up, indicating that the downward momentum is weakening and a rebound may be brewing. The Bollinger Bands have tightened and flattened, with the upper band at 62033 and the lower band at 58124. The current price is running above the middle band at 60078, indicating a weak rebound pattern. Overall, there is a short-term need for repair, but the overall trend remains bearish, and caution is needed for the risk of a pullback after a rise.
Short-term Trading Ideas:
Buying at point 59500-59000, stop loss at 58500, target 60500 aiming for 61500
Selling at point 62000-62500, stop loss at 63000, target 61500 aiming for 60500
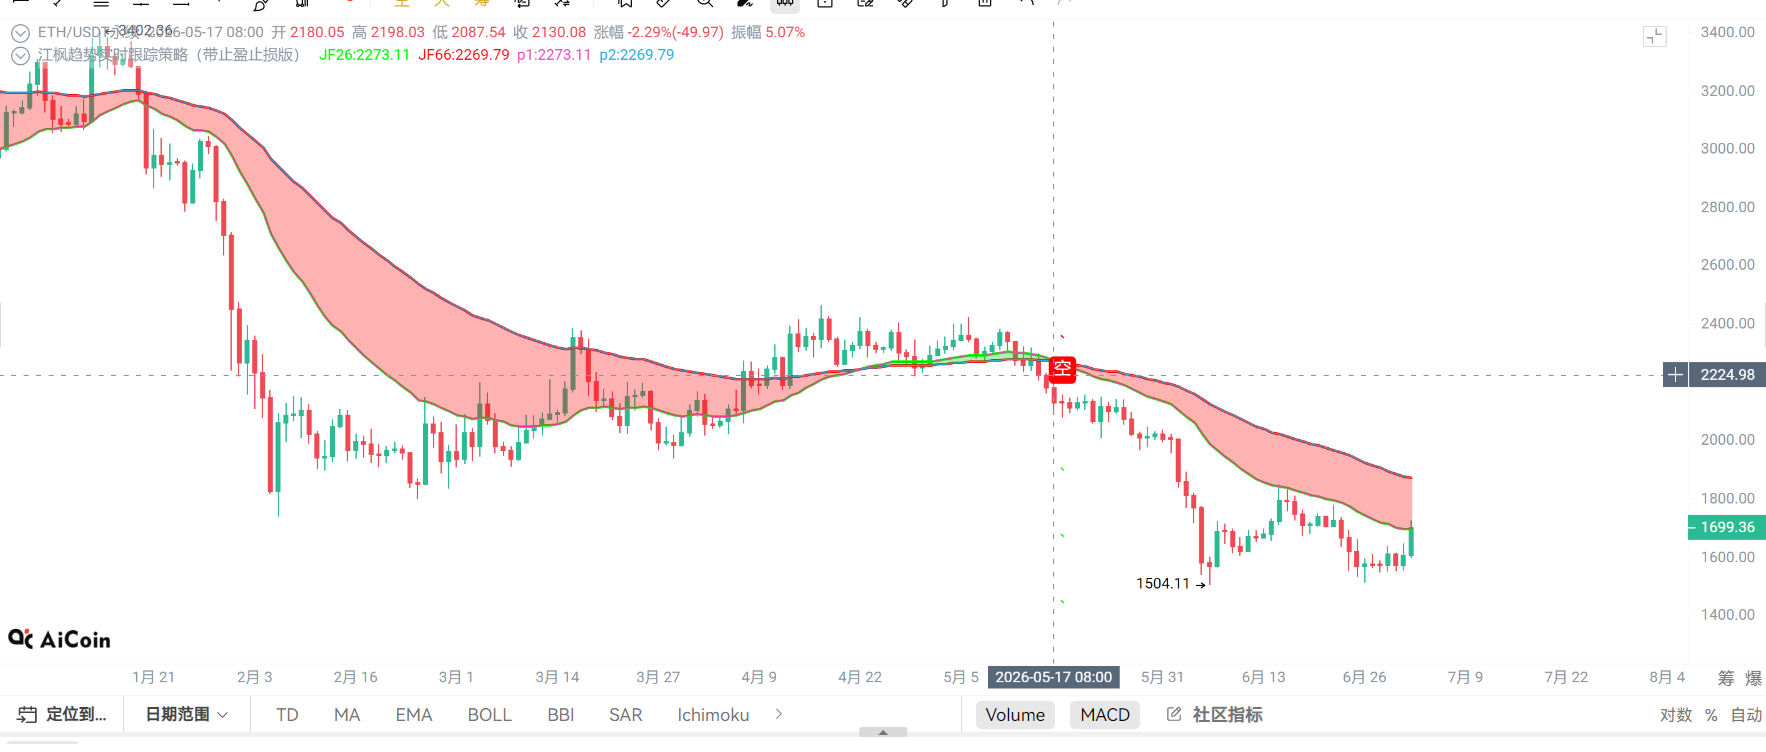
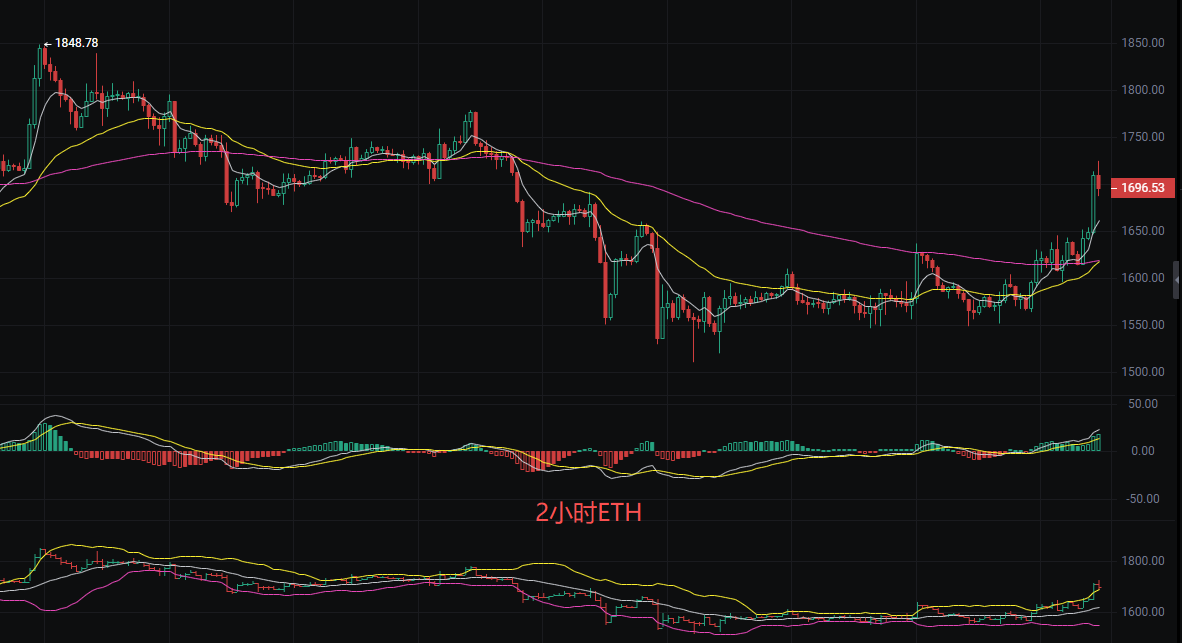
Ethereum
Before this release, Ethereum's current price is 1695, having just experienced a rebound from a low of 1500 and is now stuck at a key position. It was nerve-wracking during the previous declines, and now suddenly it has risen, with the price standing above the short-term moving averages. The MACD has also turned green, but there’s considerable pressure above. This is a time that tests patience; chasing the rise may lead to being trapped, while buying the dip may miss the opportunity. In fact, understanding a few key signals can help navigate the situation calmly. The EMA three-line arrangement is bullish, indicating the short-term trend has strengthened. The MACD momentum is healthy. The Bollinger Bands show strength but caution is needed for a pullback. The trading volume is well-coordinated, but there hasn’t been a massive surge, indicating the main forces are controlling the market steadily. The overall structure is in the early stages of an upward channel. As long as it doesn't break the support zone at 1650, the bullish pattern remains intact.
Short-term Price Points Reference:
Buying at point 1650, with a defense at 1600, stop loss at 1550, target 1700 aiming for 1750
Selling at point 1750, with a defense at 1800, stop loss at 1850, target 1700 aiming for 1650
The above content is exclusively original by Li Ying, please indicate the source for reprints! There may be delays in article publication review, and market conditions change rapidly, so the above suggestions are for reference only and risk is borne by the reader.

Warm reminder: The above content is solely created by the author of the public account. The advertisements at the end of the article and in the comments section are unrelated to the author, please discern carefully. Thank you for reading.
免责声明:本文章仅代表作者个人观点,不代表本平台的立场和观点。本文章仅供信息分享,不构成对任何人的任何投资建议。用户与作者之间的任何争议,与本平台无关。如网页中刊载的文章或图片涉及侵权,请提供相关的权利证明和身份证明发送邮件到support@aicoin.com,本平台相关工作人员将会进行核查。