Dear friends, I am Sister Qinglan. Today, July 4th, the market sentiment has welcomed a glimmer of hope amid extreme panic. In the focus news, two heavyweight pieces of information are worth noting: First, listed companies have net bought 167,000 BTC this year, far exceeding the mining output during the same period, which indicates strong institutional demand, significantly reducing the market's circulating supply, and is a key benefit supporting the upward movement of BTC prices. Second, after Bitcoin broke through $63,000, the intensity of short positions liquidation reached $657 million, with high risks of short squeeze, and breaking through key levels may trigger a chain reaction of price increases. These two messages combined suggest that although the current market is in panic, major funds and short positions are brewing changes.
Current Price and Time
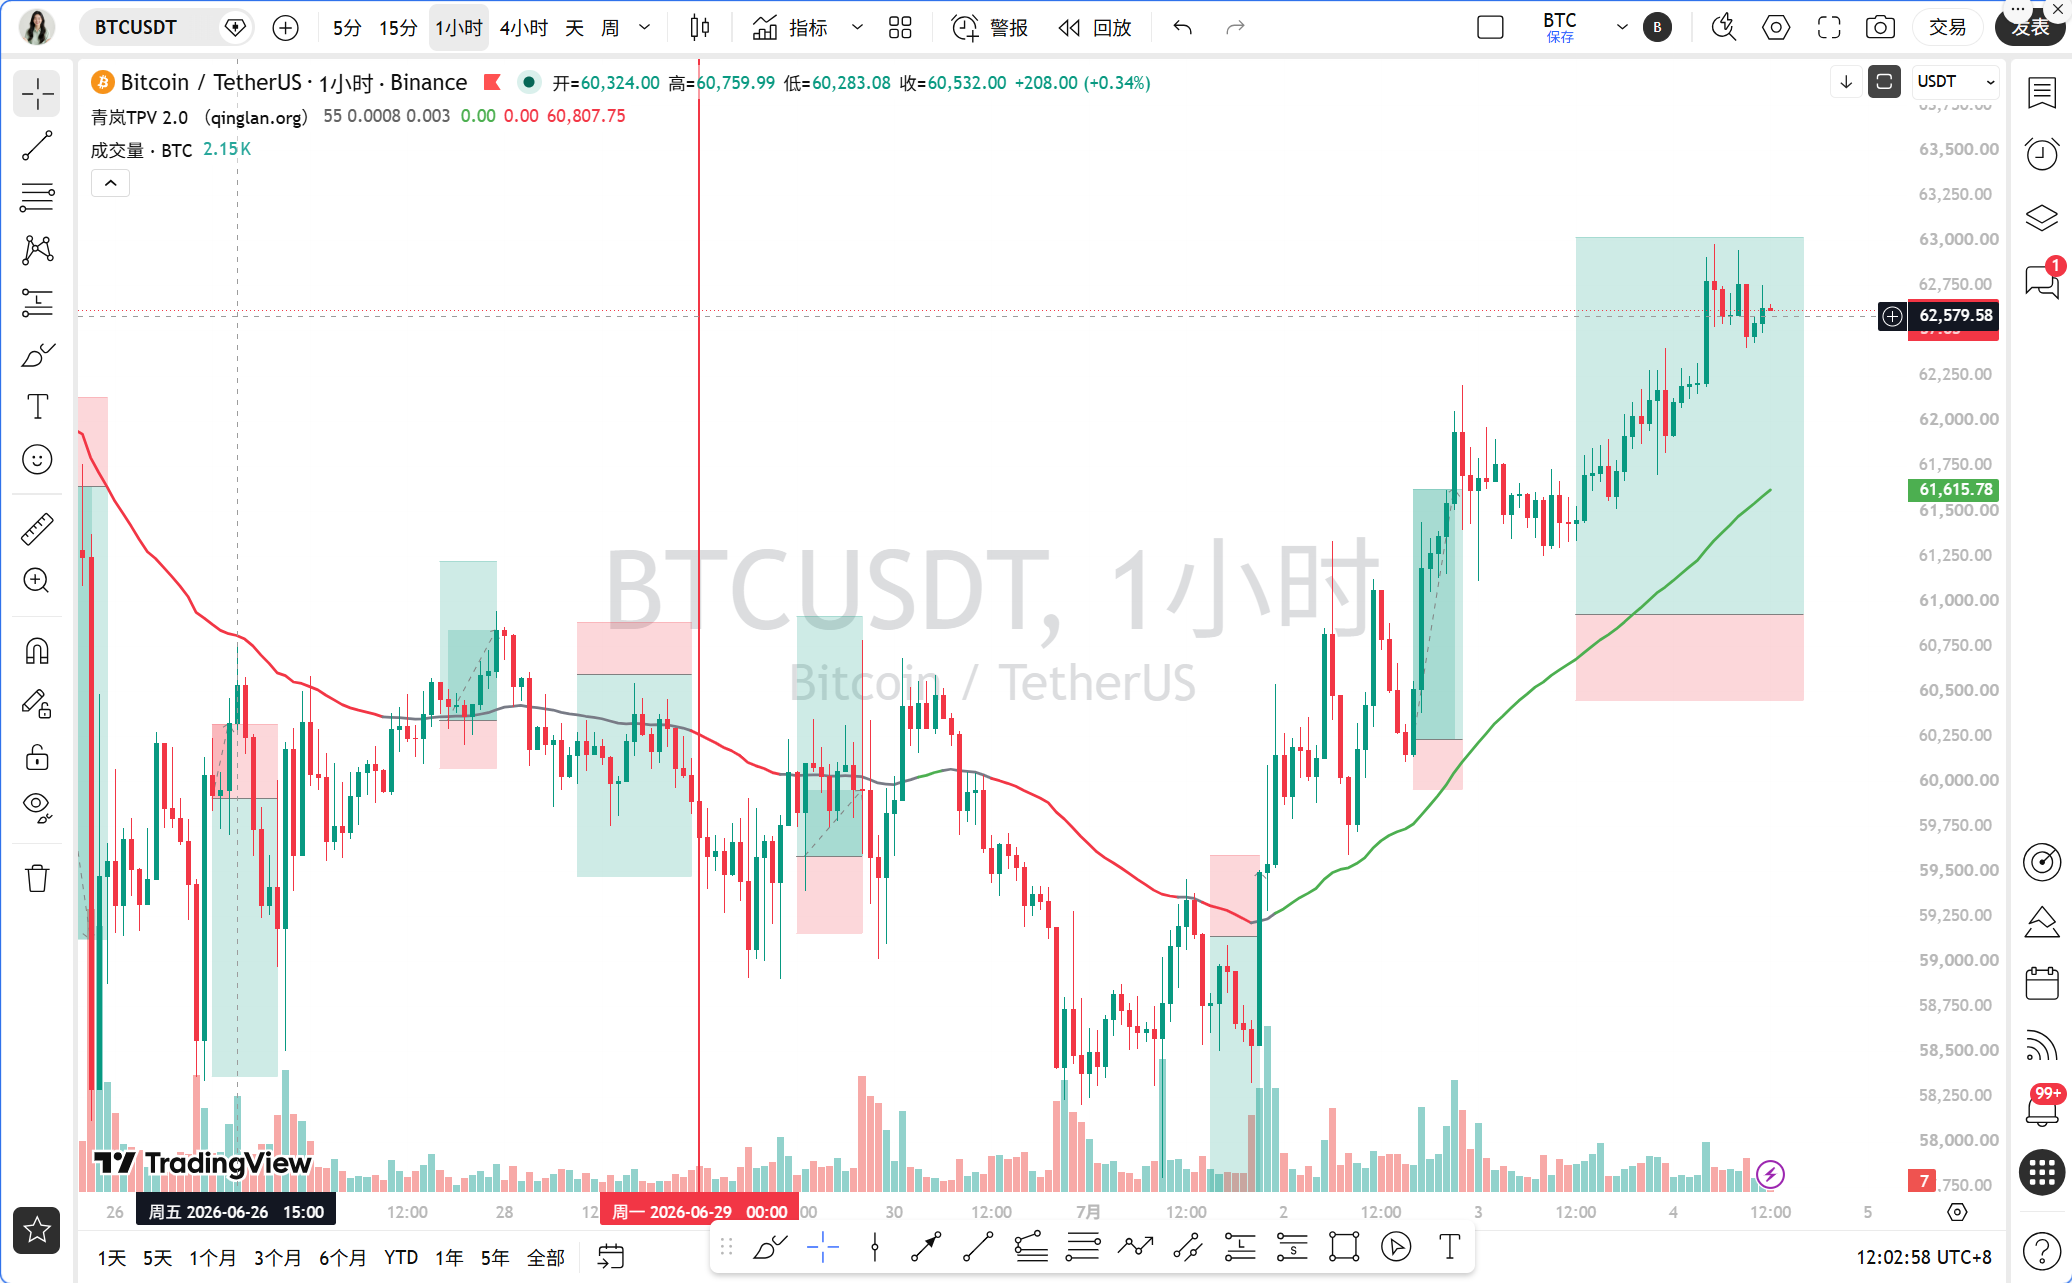
The current time is July 4th, 12:10, BTC price is reported at 62,690 USDT. The 24-hour increase is 2.15%, and the market has seen a slight rebound under an extreme fear index of 22, but overall confidence recovery still requires more positive signals.
Multi-Period Status Overview
From the daily perspective, the BTC price of 62,690 has risen above MA5 and MA10, which are 61,096 and 60,523 respectively, but is still below MA30, which is 62,423. The MACD histogram is positive at 507.73, the DIF and DEA are converging in negative territory, indicating a weakening of downward momentum, but the trend has not yet reversed. The RSI is at 43.88, in a neutral to weak range.
On the 4-hour timeframe, the price is above MA5 and MA10, which are 62,406 and 62,028 respectively, with MA30 at 60,529. The MACD histogram is positive at 187.67, with DIF and DEA diverging positively, and RSI at 75.62, close to the overbought area, indicating strong short-term rebound momentum, but caution against a pullback is needed.
On the 1-hour timeframe, the price is above MA5, MA10, and MA30, which are 62,616, 62,596, and 62,061 respectively. The MACD histogram is negative at -9.88, with DIF and DEA close to the zero line, and RSI is at 63.16, in a neutral to strong range. EMA55 is at 61,570, and the current price of 62,690 is significantly above this line, indicating bullish dominance.
On the 15-minute timeframe, the price is near MA5, MA10, and MA30, which are 62,633, 62,568, and 62,620 respectively. The MACD has a golden cross, the histogram is positive at 1.31, and RSI is at 48.55, in a neutral area, indicating short-term consolidation.
TPV Signal Verification
According to the Qinglan TPV system, we use the 1-hour EMA55 as the bullish-bearish dividing line. The current price of 62,690 is far above EMA55 at 61,570, and in the past 8 one-hour candles, the closing price has been greater than EMA55 8 times, with 0 times crossing it, an absolute amplitude of 1.82%, not meeting the consolidation threshold, indicating a one-sided bullish trend region.
Long conditions verification: First, the price remains above the 1H EMA55, with two consecutive one-hour closing prices greater than EMA55, which is currently satisfied. Second, support stabilization: looking at the 4-hour and 1-hour candles, the price has multiple lower shadows around 62,000 providing support, forming effective low-point rebounds. Third, the downward momentum has weakened: the daily MACD histogram has been shrinking consecutively, the 4-hour MACD histogram is positive and enlarging, and while the 1-hour MACD histogram is negative, it is close to the zero line. The signal for momentum exhaustion is not obvious, but overall leans toward bullishness.综合判断,当前满足做多条件,但需注意1小时MACD柱为负,动能稍弱。
On-chain Funding Situation
On-chain data shows a fear and greed index of 22, still in the extreme panic range, but an improvement from 15 previously. BTC market share is 55.7%, indicating funds are still seeking refuge in BTC. Whales have spent $37 million over three days to hoard ETH and WBTC, indicating a long-term bullish outlook. BlackRock's BTC ETF has seen net outflows for 10 consecutive days, with a total outflow of 35,980 BTC, creating short-term pressure on prices due to institutional fund outflows. However, the amount bought by listed companies exceeds mining output by two times, indicating strong long-term demand. The probability of a Fed rate hike in July has decreased from 33% to 20%, benefiting risk assets. Overall, funding is mixed, with short-term leaning towards bearishness and long-term towards bullishness.
Key Attack and Defense Levels
The key resistance level above lies in the 63,000 to 63,500 range, where there were previous highs and a concentration of short liquidation; breaking through may trigger the liquidation of $657 million in short positions. The key support level below lies in the 62,000 to 61,570 range, with 61,570 being the 1-hour EMA55, the short-term bullish-bearish dividing line. If it drops below 62,000, it may test the 61,000 to 60,500 range, which is supported by the 4-hour MA30 and daily MA10.
Trading Ideas
Direction: The current 1-hour EMA55 is at 61,570, and the price of 62,690 is in the bullish area, meeting the conditions for long positions, hence a bullish bias. However, caution is advised as the 1-hour MACD histogram is negative, indicating slightly weaker momentum, and the 4-hour RSI is approaching overbought levels, presenting short-term pullback risks. It is recommended to primarily buy on dips and not chase prices high.
Entry Conditions: Wait for the price to pull back to the 62,000 to 62,200 range, where a long lower shadow or bottom formation supports stabilization, and for the 1-hour MACD histogram to see two consecutive cycles of shrinkage, or for RSI to rebound from around 50, then you can enter long positions. If the price directly breaks through 63,000 and stabilizes, you can lightly chase long, but strict stop losses are necessary.
Stop Loss: After entering long positions, set the stop loss below 61,500, which is below the 1-hour EMA55. If the price drops below 61,500, the trend turns bearish, and you should exit with a loss.
Target Levels: The first target level is 63,000, the second target level is 63,500, and the third target level is 64,000. If the price breaks through 63,500, the next target could be 65,000.
Risk Notice
The current market sentiment is extremely fearful, and short-term volatility may intensify. Trading should strictly control positions and stop losses to avoid heavy chasing in rising or falling markets.
Follow Qinglan Crypto Classroom to grasp more trading opportunities! Welcome to visit the official website www.qinglan.org
📊 Qinglan TPV Trading Strategy Backtest Reference
🕒 Last Backtest Time 07-04 07:00:01
Total Analysis: 2701 Backtest: 2091 Accuracy: 73.9% (1546/2091)
免责声明:本文章仅代表作者个人观点,不代表本平台的立场和观点。本文章仅供信息分享,不构成对任何人的任何投资建议。用户与作者之间的任何争议,与本平台无关。如网页中刊载的文章或图片涉及侵权,请提供相关的权利证明和身份证明发送邮件到support@aicoin.com,本平台相关工作人员将会进行核查。