
Written by: CryptoVizArt, Frederik Theissen, Glassnode
Translated by: Luffy, Foresight News
The price of Bitcoin has been below the true market average and the short-term holder cost benchmark for five consecutive months, remaining in a deeply undervalued range.
The current scale of realized losses for long-term holders has risen to 43% of the total on-chain realized losses; the single-day loss realization hit a peak of $280 million, the highest level since December 2022. The outflow of spot ETF funds has softened somewhat but still maintains a monthly net outflow; the average daily trading volume of ETFs remains in the range of $650 million to $950 million, shrinking about 80% from the peak levels in October 2025, with institutional buying demand not yet stabilizing.
The derivatives holding structure has shifted to a cautious bullish stance, with the put/call option ratio falling to a low for 2026; however, the option volatility surface continues to reflect a defensive premium, with spot prices significantly below the maximum pain point. The market has entered the later stage of bottoming, and the continued narrowing of selling pressure from long-term holders is a critical precondition for a market reversal and recovery.
Macroeconomic Perspective
Surge in Crude Oil Prices, Risk Assets Under Pressure
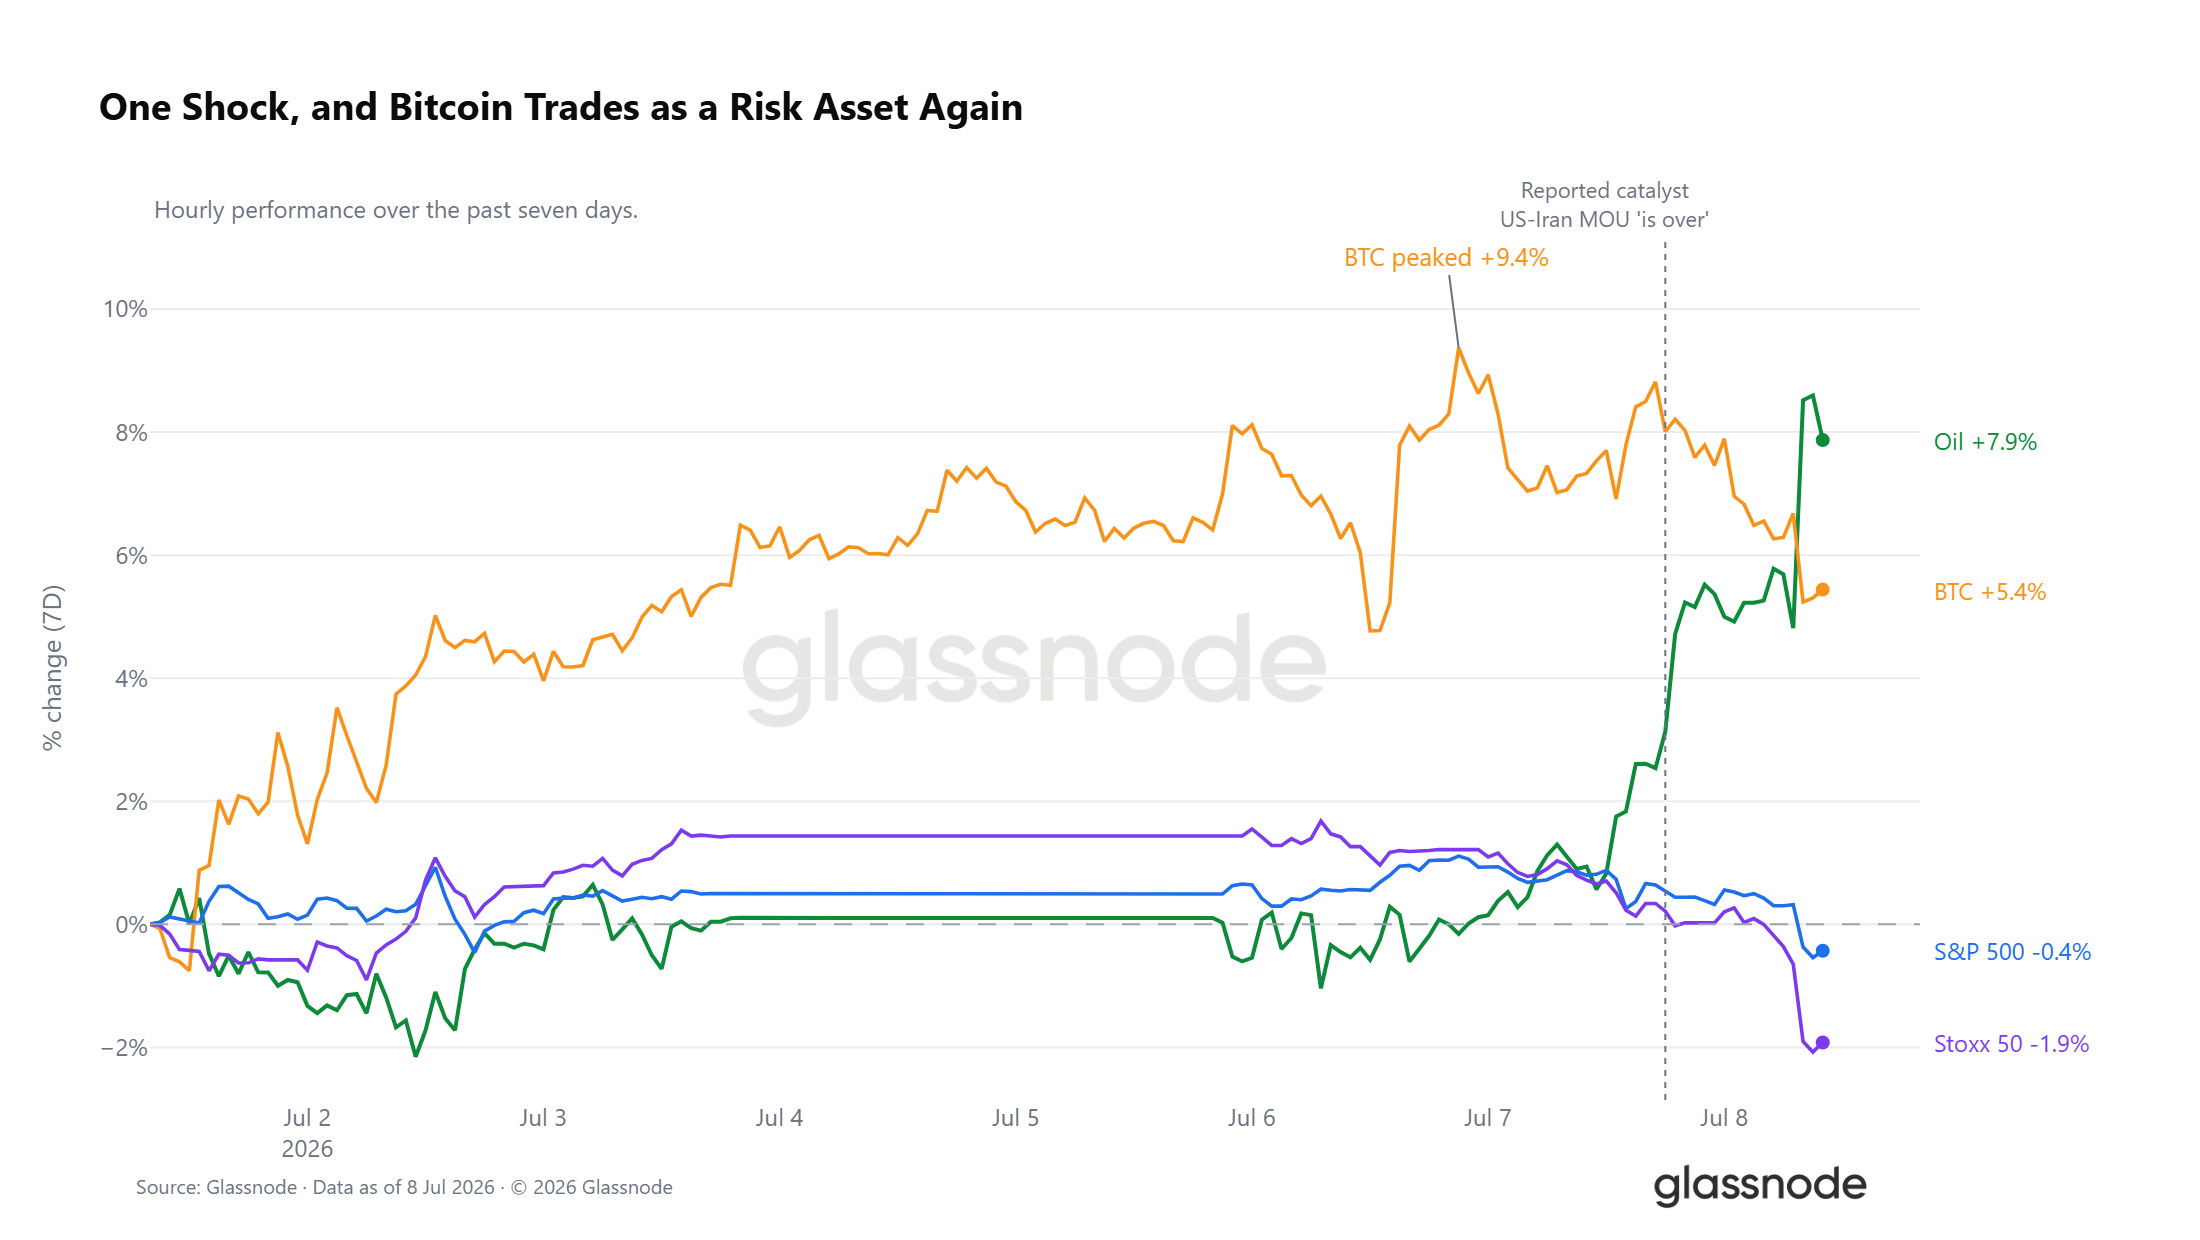
In the past seven trading days, WTI crude oil has risen by 7.9%, with most of the gains concentrated recently, as news of the expiration of the U.S.-Iran memorandum has impacted all asset markets. Bitcoin's highest increase this week reached 9.4%, and it has currently fallen back to a weekly increase of 5%; the S&P 500 and the European Stoxx index all turned lower, with European stocks leading the decline in global risk assets. At this stage, Bitcoin’s trend is highly synchronized with risk assets.
Liquidity Environment: Increasing Contradiction Between Bulls and Bears
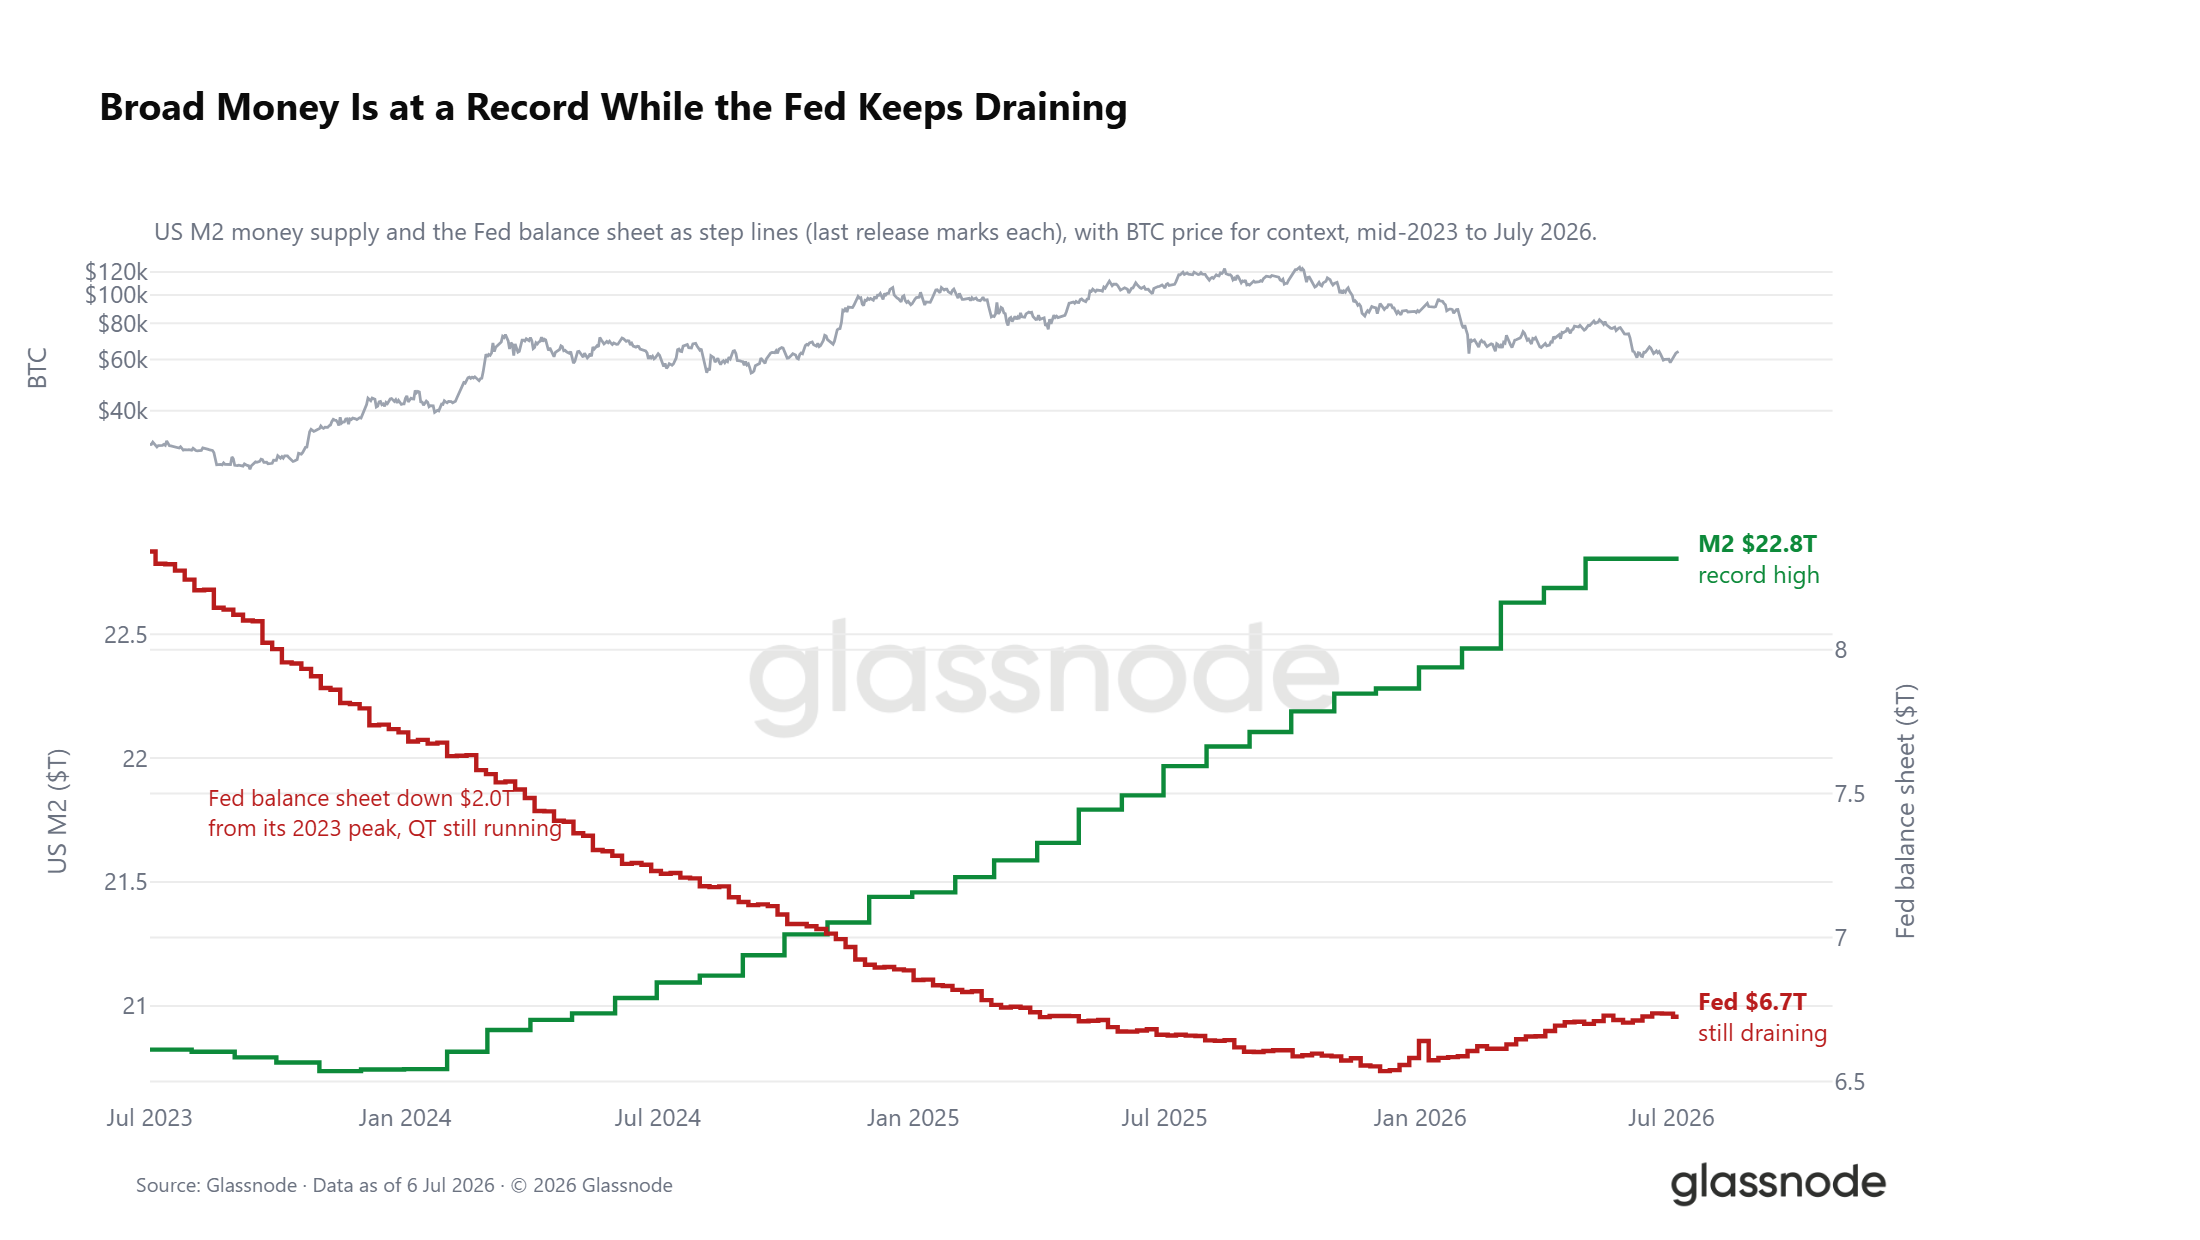
Under the external impact of crude oil, the market liquidity environment exhibits a tear pattern. The total amount of U.S. broad money M2 has climbed to a historical high of $22.8 trillion, and historically, periods of broad money expansion often boost market risk appetite; however, the Federal Reserve’s balance sheet continues to shrink, currently down $2 trillion from the peak in 2023. Two major liquidity signals create a strong hedge: the total amount of broad money is continuously rising, while the quantitative tightening process has not stopped, with real interest rates staying around 1%, leaving the opportunity cost of holding non-yielding digital assets high. Although the macro favorable window has not completely closed, it has not formed clear easing support either.
On-Chain Data
Deep Undervaluation Range Lasting Five Months
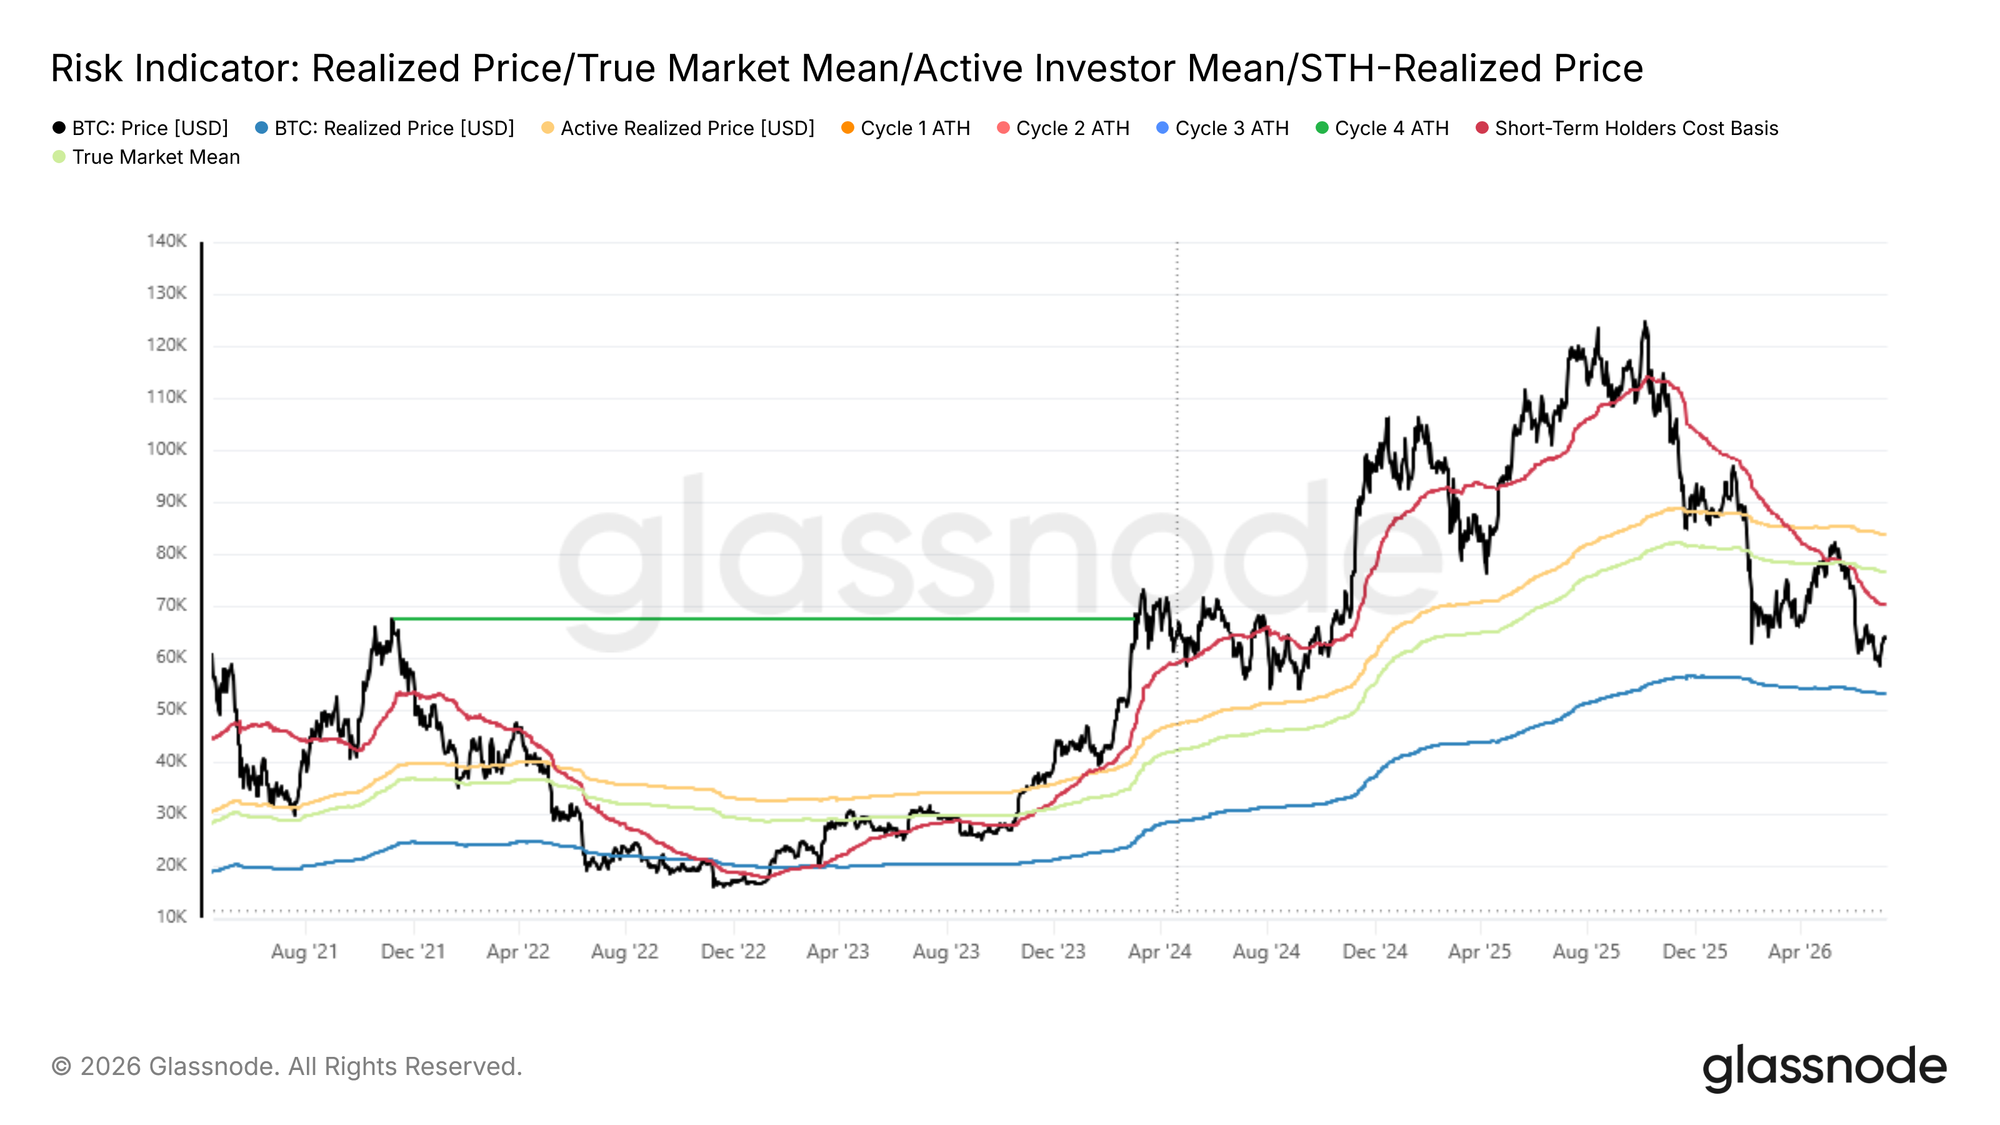
In the past week, Bitcoin rebounded from $58,300 to $64,400, indicating a short-term recovery, but the price remains significantly below the true market average of $76,600 and the short-term holder cost line of $72,200. Only by regaining above these two key price levels can the market exit the deep undervaluation range; otherwise, it remains susceptible to external bearish catalysts for declines.
The duration of this discount market is noteworthy. Since early February 2026, the coin price has consistently remained below the cost line of active investors and the breakeven line for recent entrants, lasting nearly five months, representing one of the longest periods of deep discount in Bitcoin's history.
In a prolonged discount range, the continuous turnover of chips and new funds consistently position below previous buyers’ and the entire market’s active holding cost lines, has historically formed the basis for a cyclical bottom; this presents a long-term allocation appeal for value investors. Various indicators show that the bottoming process has entered the second half, but the possibility of a market pullback to $53,000 cannot be completely ruled out.
Long-term Holders at High Positions Concentrated in Stop Losses
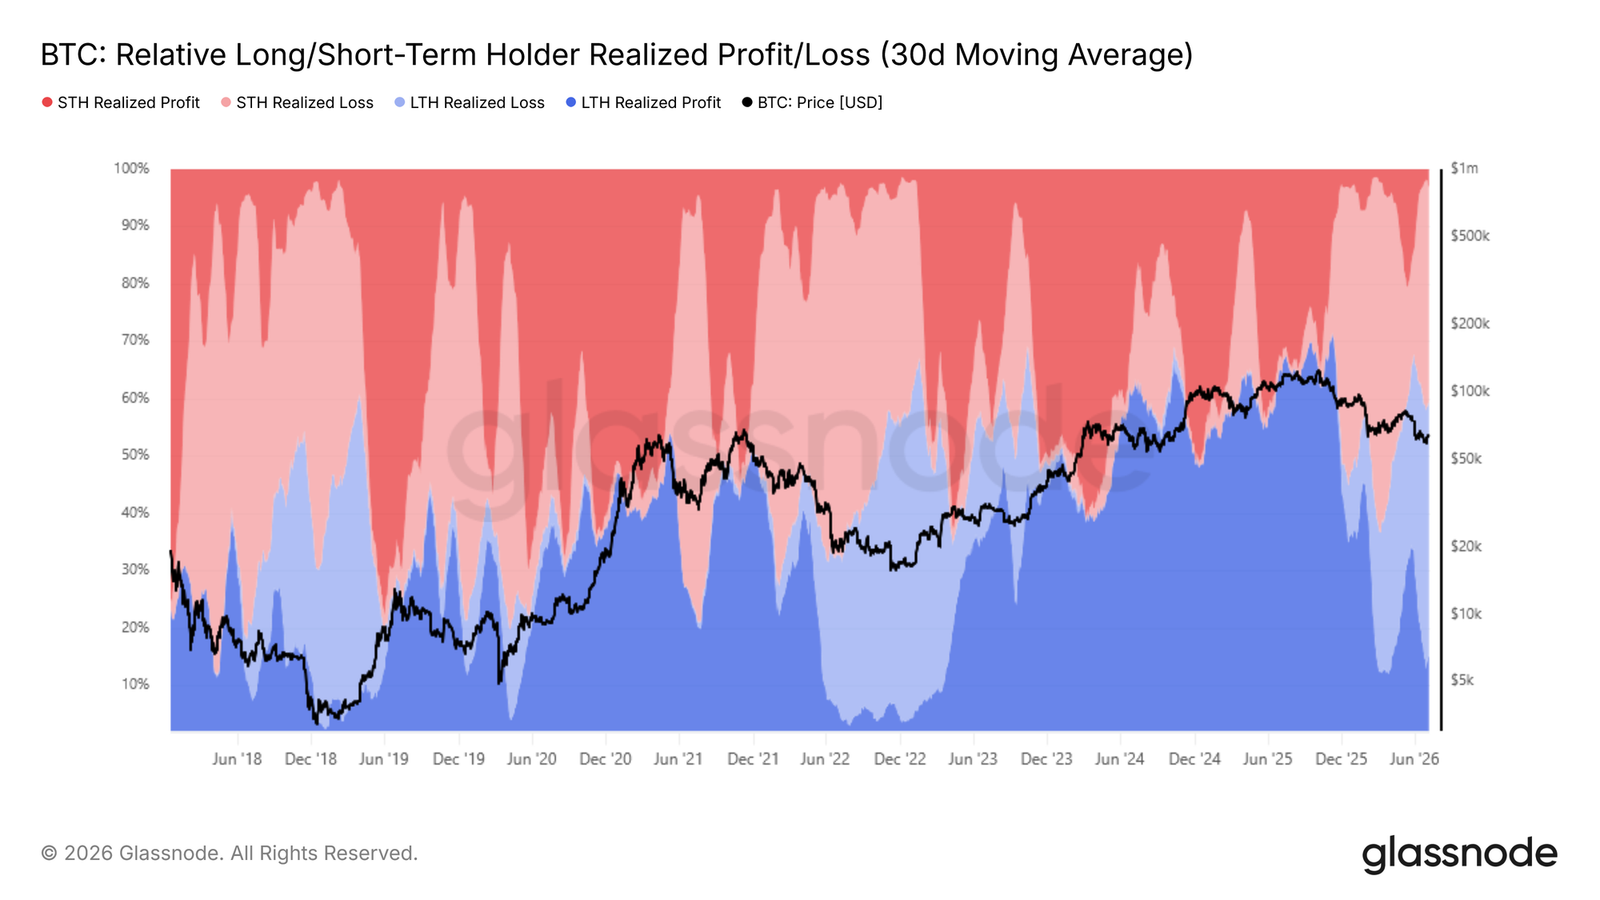
The market is building a cyclical bottom, and the current core issue is identifying the main source of downward selling pressure. The realization of gains and losses by long and short holders provides a ratio that visually reflects the scale of the two types of chips’ realization across the long-term and short-term holding groups.
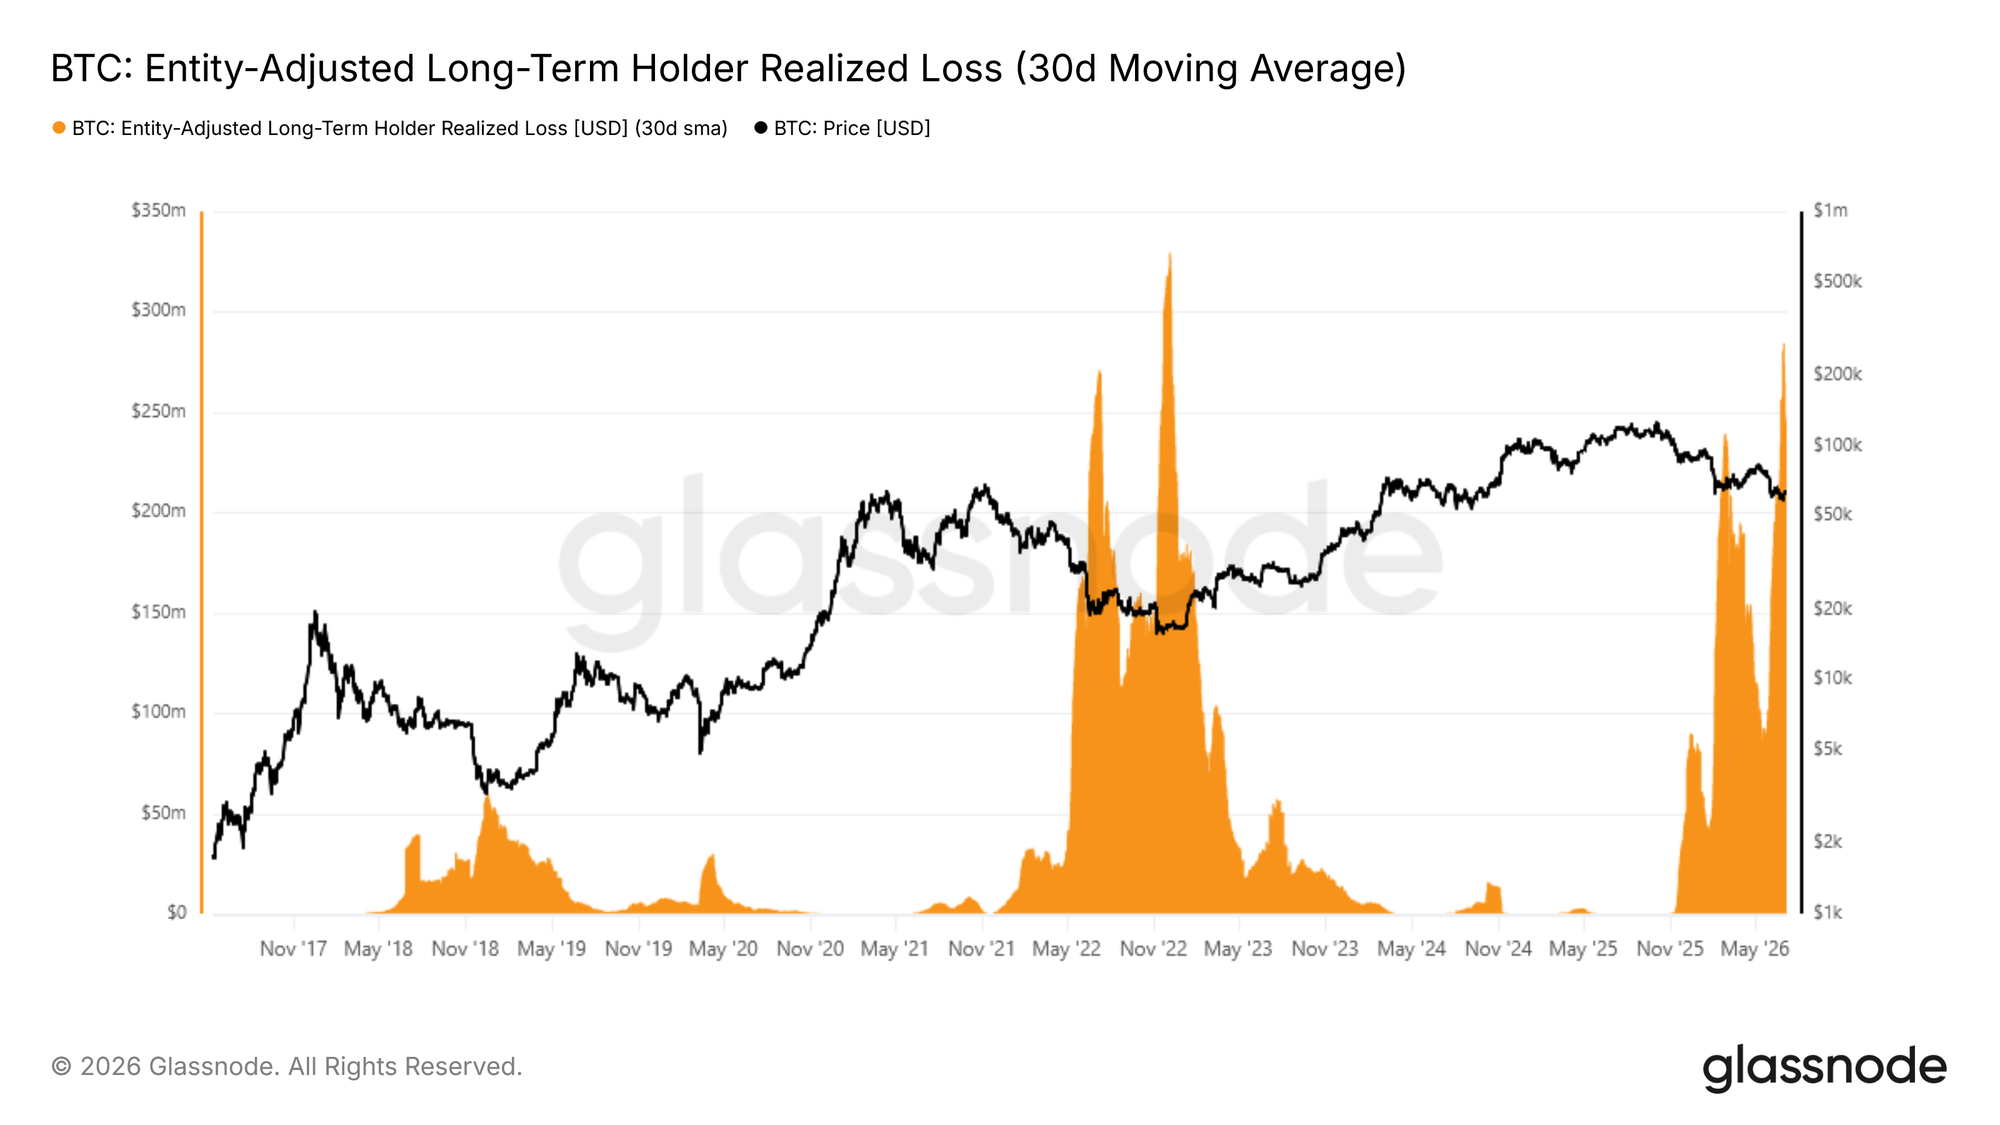
Once the price drops below the true market average, the percentage of long-term holders' losses realized over a 30-day moving average has risen from 15% since early February 2026 to the current 43%. The stop-loss selling pressure generated by this group due to unrealized losses has become the most crucial bearish force suppressing the price.
This group of investors mostly entered near the cyclical high, and after several months of deep retracement, their confidence in holdings gradually diminished, leading to concentrated exits. This chip structure directly explains why each round of rebound encounters concentrated selling from deeply trapped positions, making it difficult for the price to stabilize above the current upper range.
No Signs of Exhaustion in Stop Loss Selling Pressure
The realized loss of long-term holders has become the primary downward pressure in the market. The next crucial observation indicator will be whether this selling pressure begins to dissipate.
Long-term holders who have realized losses after adjustments (30-day smoothed average) measure the losses incurred by users holding positions for over 155 days, excluding internal address transfers, accurately reflecting real stop-loss exit behaviors. This indicator recently reached a daily peak, with a single-day realized loss of approximately $280 million, the highest since December 2022 and the second wave of large-scale stop-losses for long-term holders in this bear market.
The key difference is that after the first peak of stop-losses, the selling pressure showed a temporary retreat, while this current wave of selling has yet to show any signs of scale contraction. Only if this indicator shows a significant decline can the market have the foundational conditions to transition into a bull market. In the coming weeks to months, the trajectory of this indicator will be a core signal for assessing whether the market has truly cleared selling pressures.
Off-Chain Market
ETF Outflows Slow, but the Trend Remains Unreversed
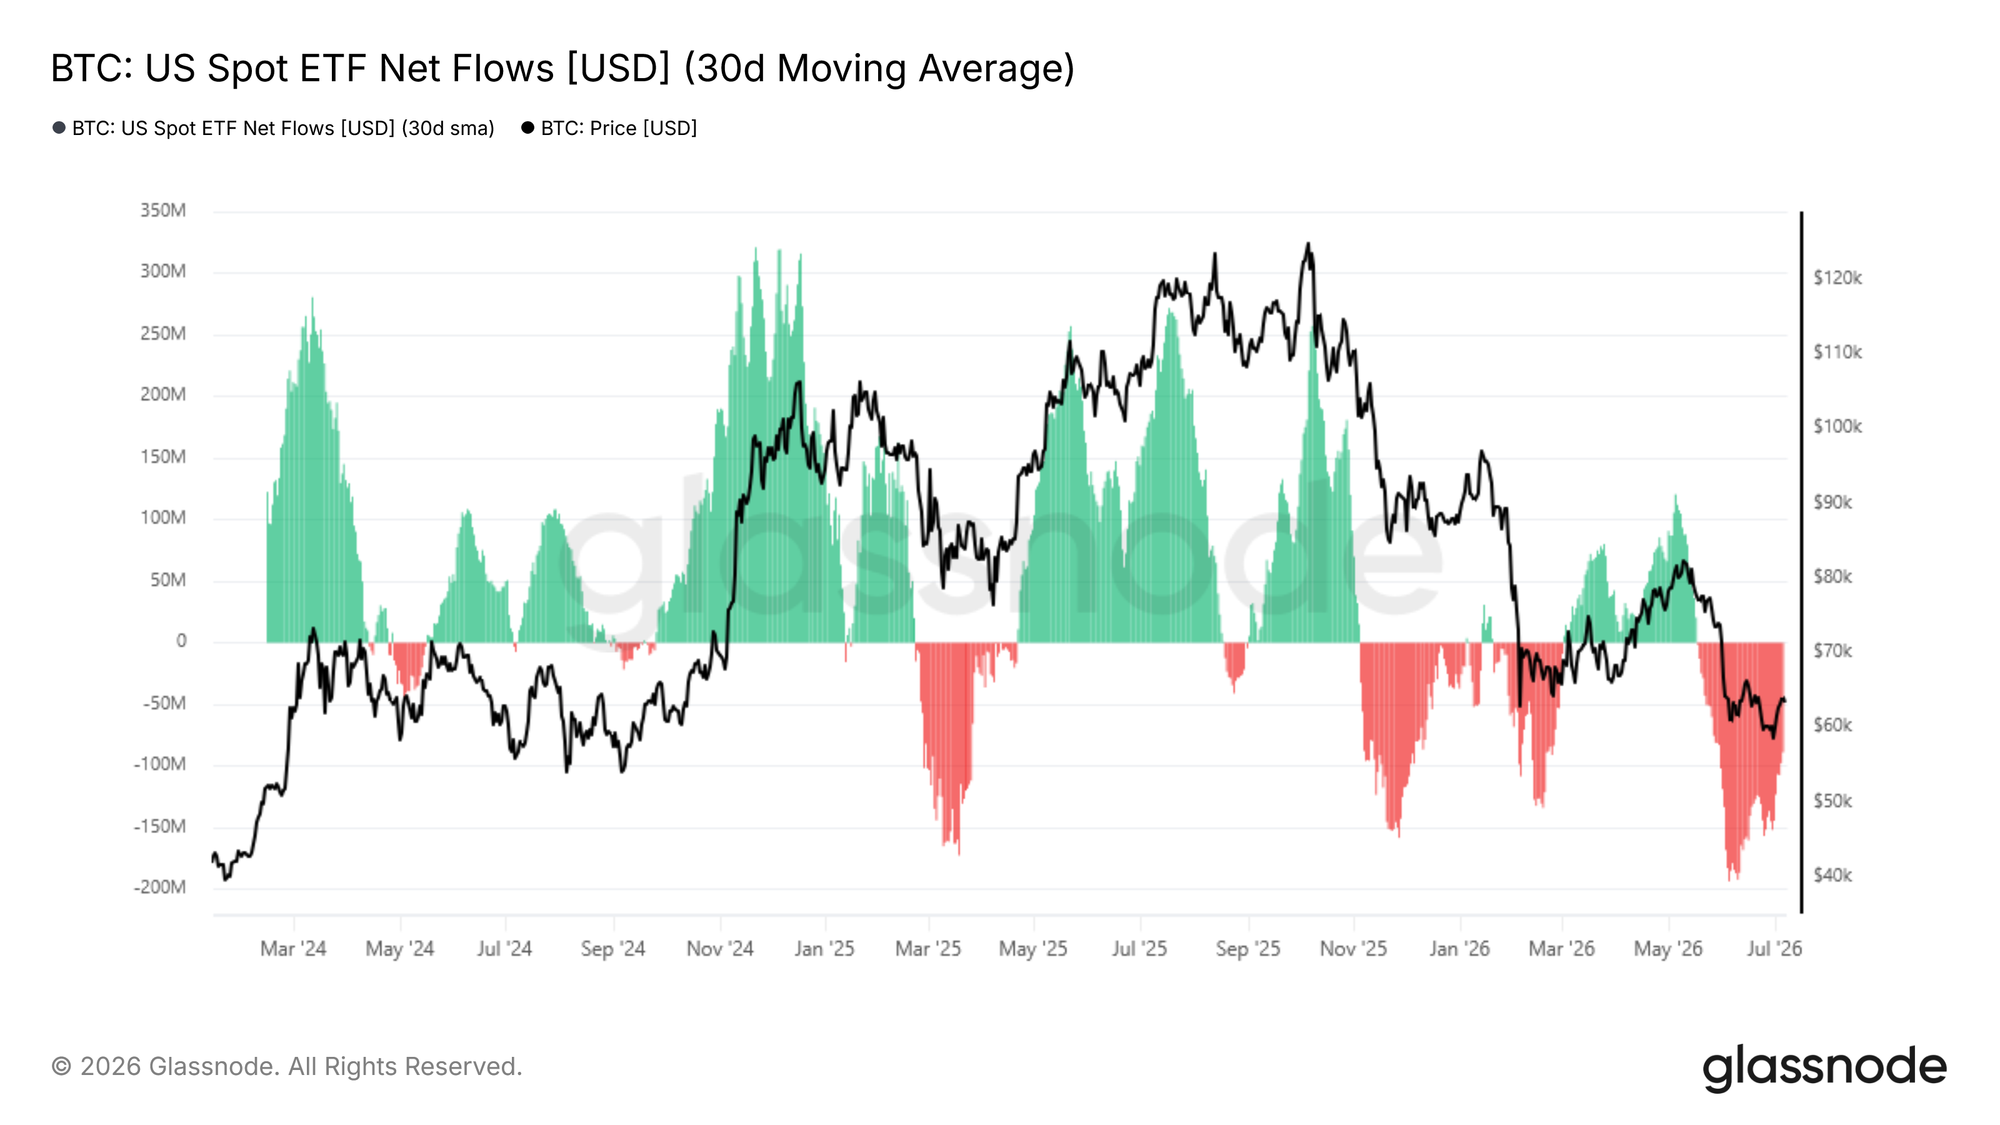
Shifting from on-chain to off-chain markets, the flow of funds in spot ETFs intuitively reflects institutional behavior. The 30-day average of ETF net flow reflects the daily net fund inflow or outflow for U.S. spot Bitcoin ETFs, excluding single-day fluctuations, thereby revealing potential trends in institutional holdings.
Since mid-May 2026, this indicator has entered a monthly net outflow range, with a peak single-day outflow of $193 million in early June, currently falling back to a daily net outflow of $88.9 million. The slowdown in outflow scale is a slight positive signal, but the monthly fund outflow continues unabated, and institutional buying demand remains unstable. Only when the fund flow narrows consistently to a balanced range can short-term market expansions be anticipated.
Institutional Trading Volume Remains Dismal
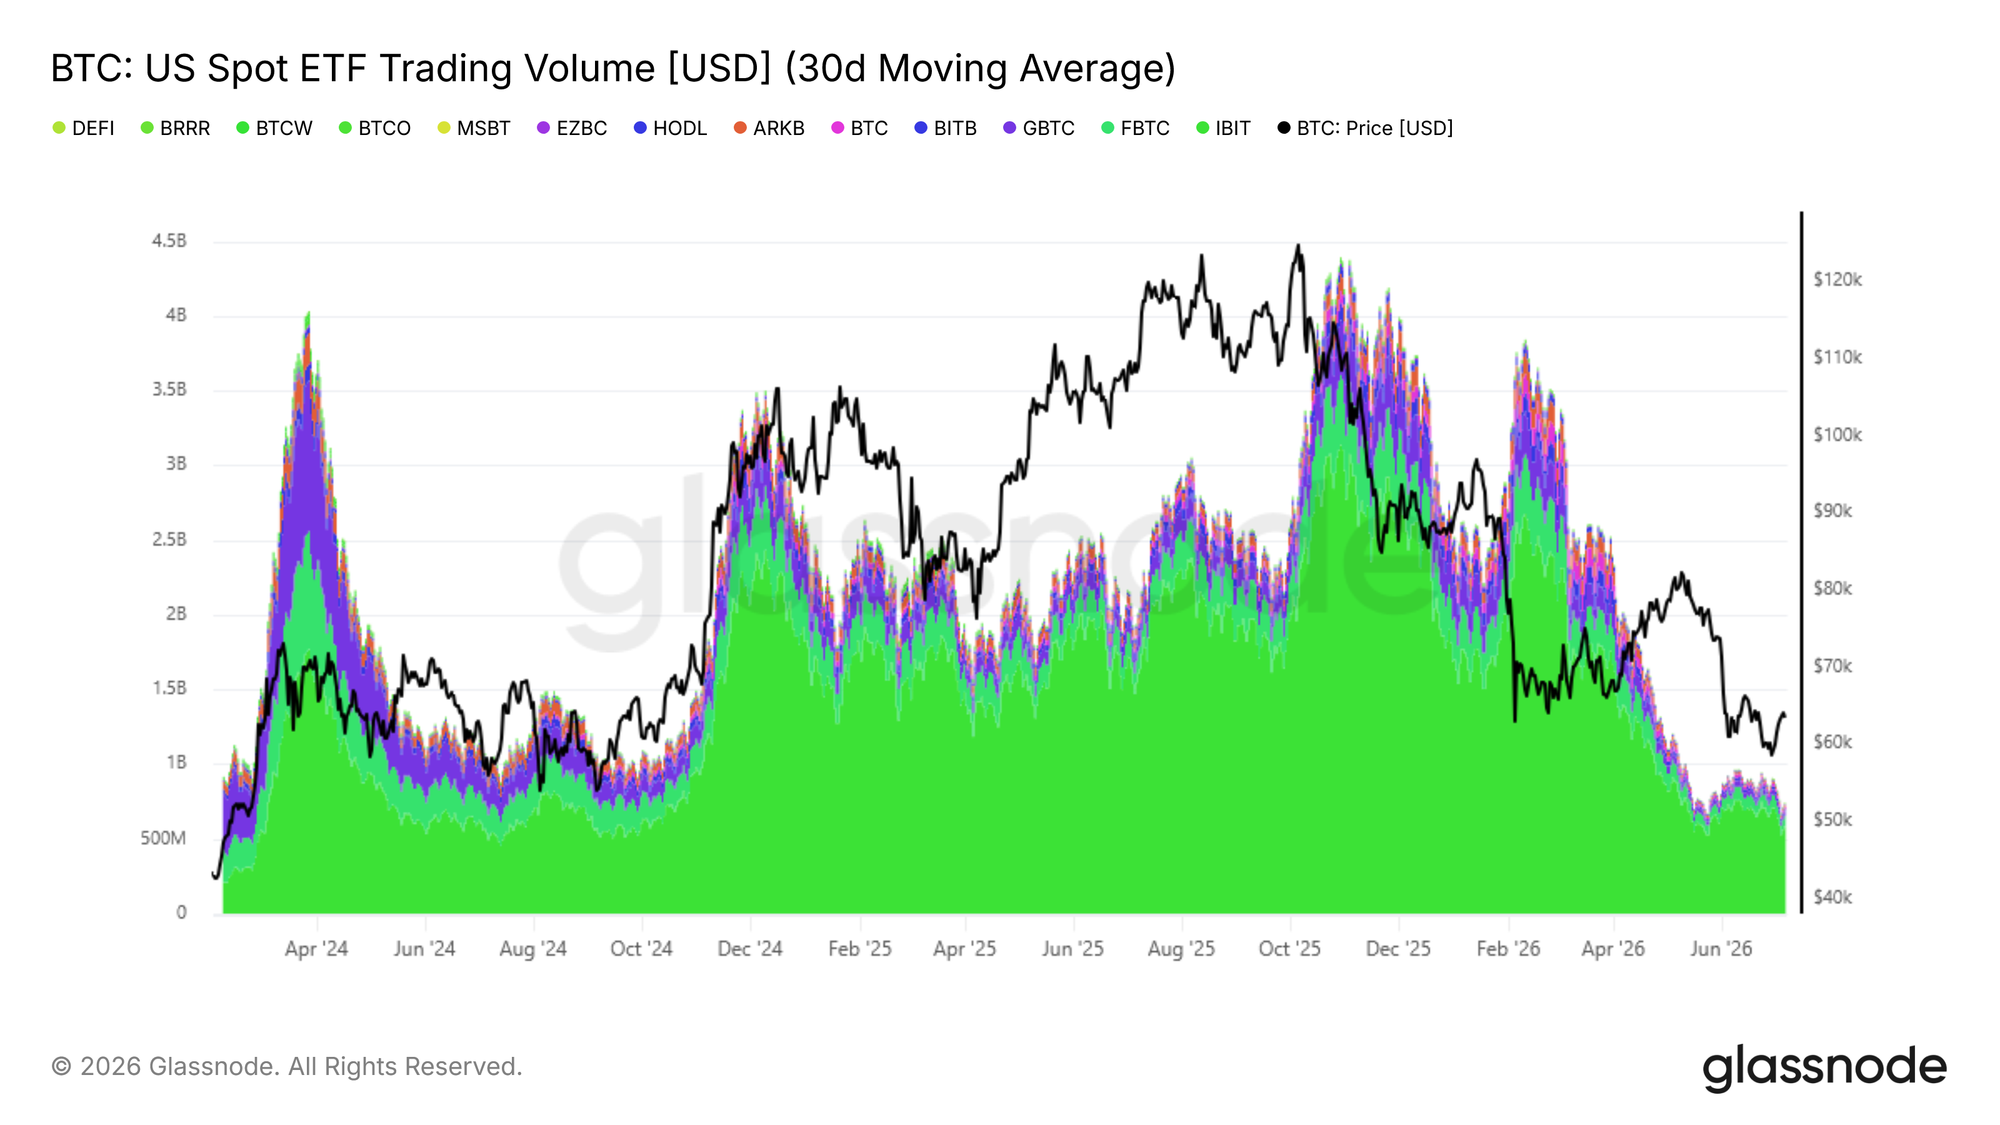
Beyond net fund inflow data, the trading volume of U.S. spot ETFs can assist in assessing the degree of institutional confidence recovery. The 30-day average of the daily trading volume of ETFs is currently fluctuating between $650 million and $950 million, which is comparable to the levels seen in the fourth quarter of 2024 but is still about 80% lower than the daily peak of $4.4 billion achieved in October 2025.
The current trading scale only represents the basic participation level of institutions, remaining extremely low compared to bull market peaks, indicating that ETF investors' long-term bullish confidence has not substantively returned. Only when average daily trading volume continues to increase, alongside a consistent narrowing of the net outflow scale, can we confirm a recovery in institutional demand. Until those indicators show synchronous improvement, off-chain data and on-chain metrics support each other, and the market overall remains under the dominance of the bear market.
Derivatives Market
Bears Close Positions, Holding Structure Turns Cautiously Bullish
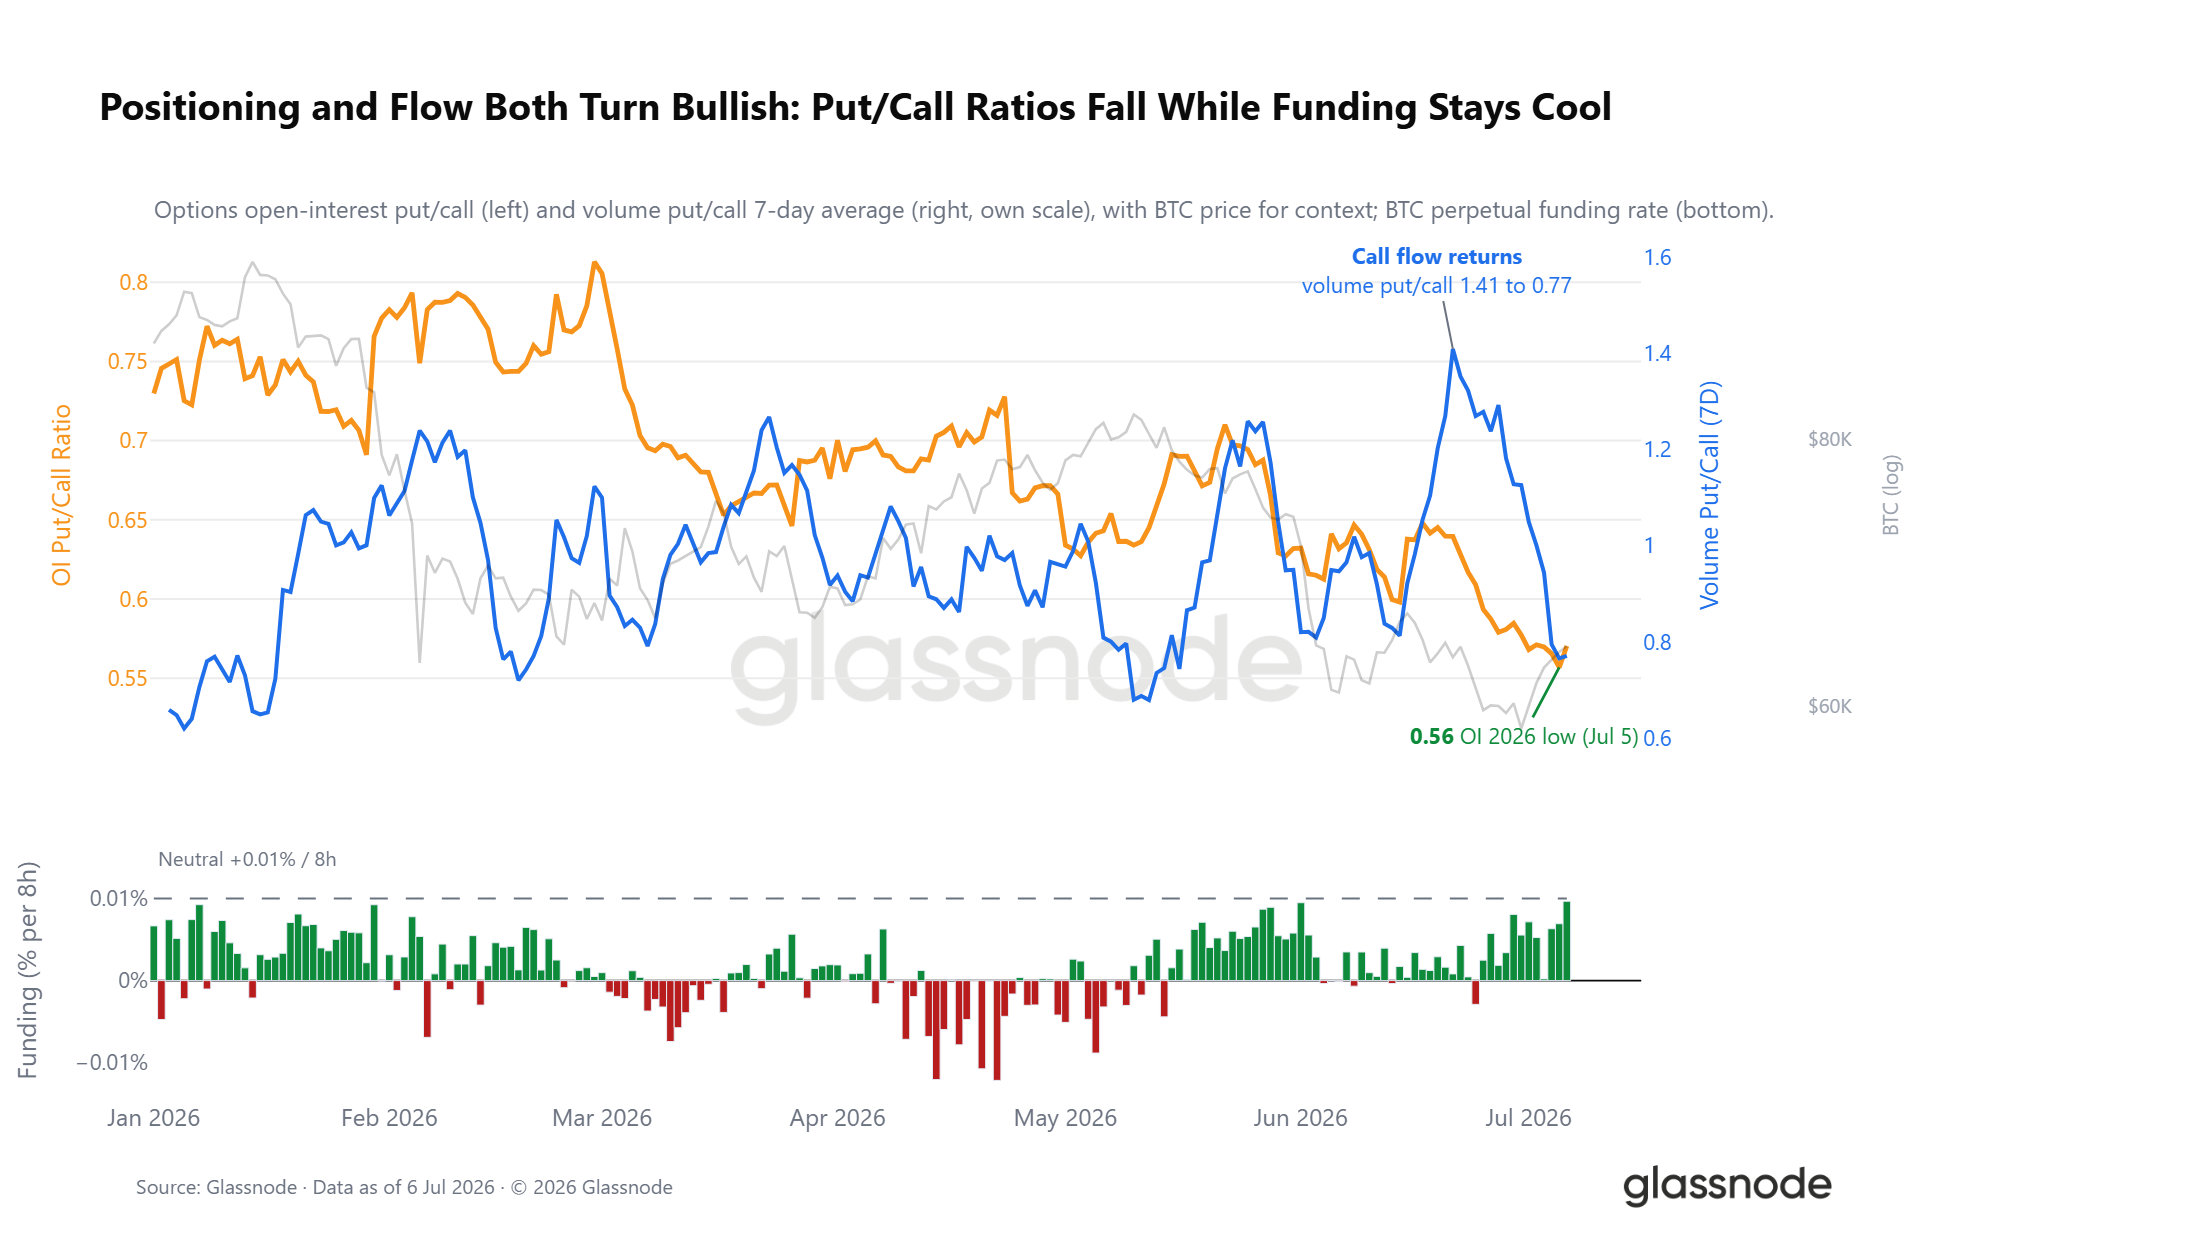
Amidst weakening risk sentiment, the derivatives holding structure has undergone a reverse change. The put-to-call ratio of open options has dropped to 0.56, the lowest level in 2026, where the market currently holds two call options for every put option. The trading volume of options corroborates this trend: two weeks ago, when Bitcoin tested lower levels again, the market aggressively bought puts for hedging, with the put-to-call trading ratio soaring; as call orders continued to flow back in, this ratio quickly declined, even as the spot price only recovered a portion of the losses.
Perpetual swap funding rates also confirm the shift in positions. The average funding rate of perpetual contracts has long remained below the 0.01% balance line, far from a crowded bullish market situation. The derivatives market has already cleared out bearish risks and overall turned cautiously bullish under external bearish impacts, contrasting sharply with the previously crowded short positions before the downturn.
Options Surface Continues to Price Downside Risk
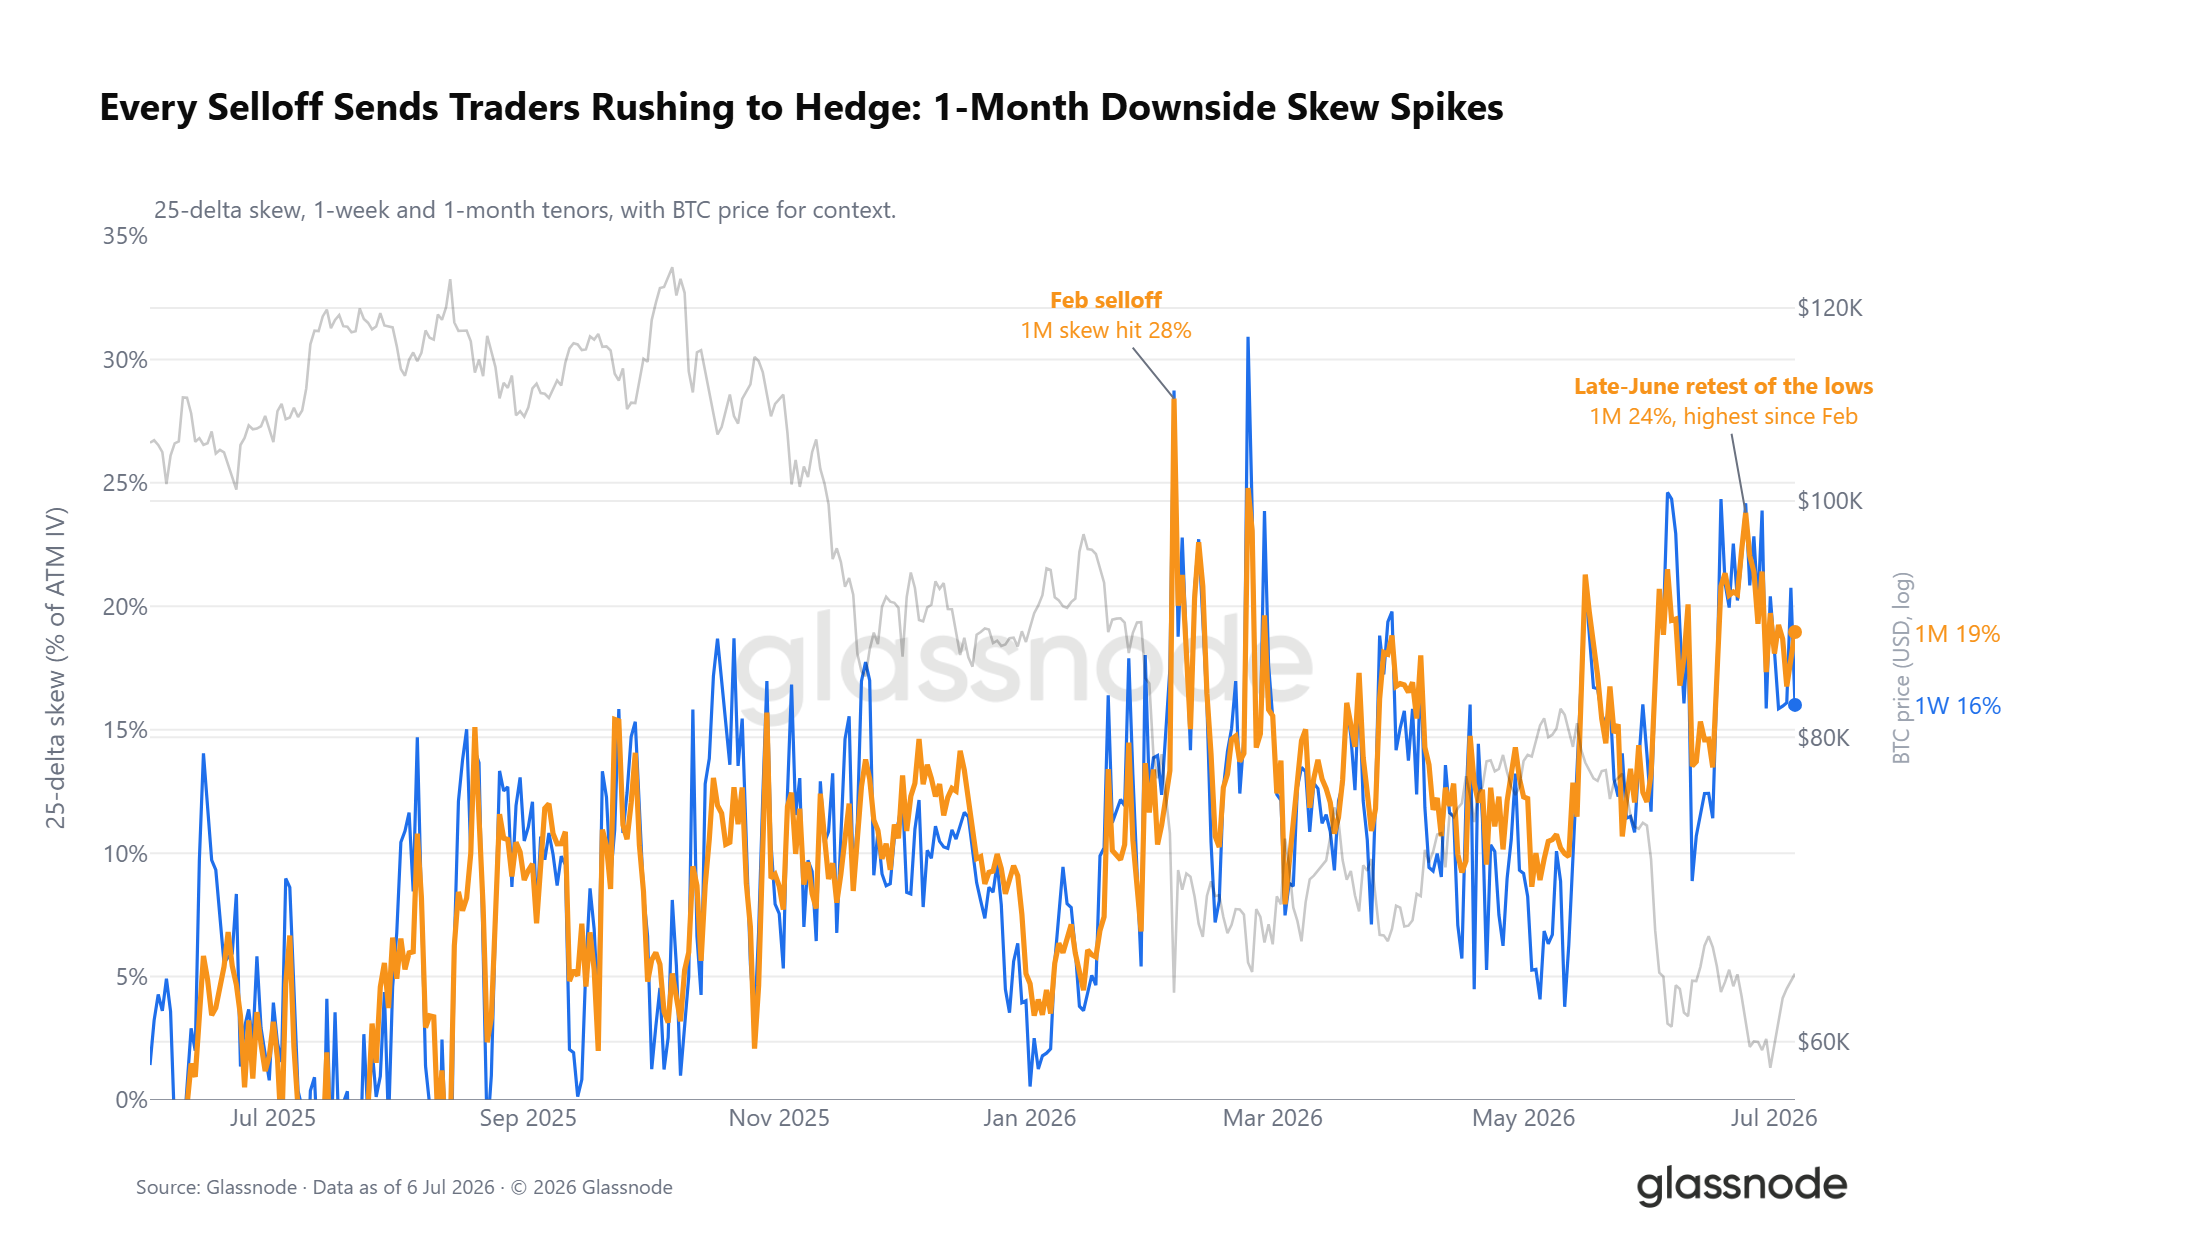
While overall holdings are biased towards bullish, the options volatility surface provides opposing signals. The 25-delta volatility skew indicator (the premium for downside protection relative to upside gains) maintains a premium status across all contract maturities. Each wave of decline this year has pushed this premium higher, and by the end of June, this indicator peaked at 24%, marking the strongest defensive sentiment in near-month contracts since the declines in February. Even though the overall market positioning is bullish, traders are still willing to spend a premium to buy downside hedges.
Spot Price Diverging from Maximum Pain Point
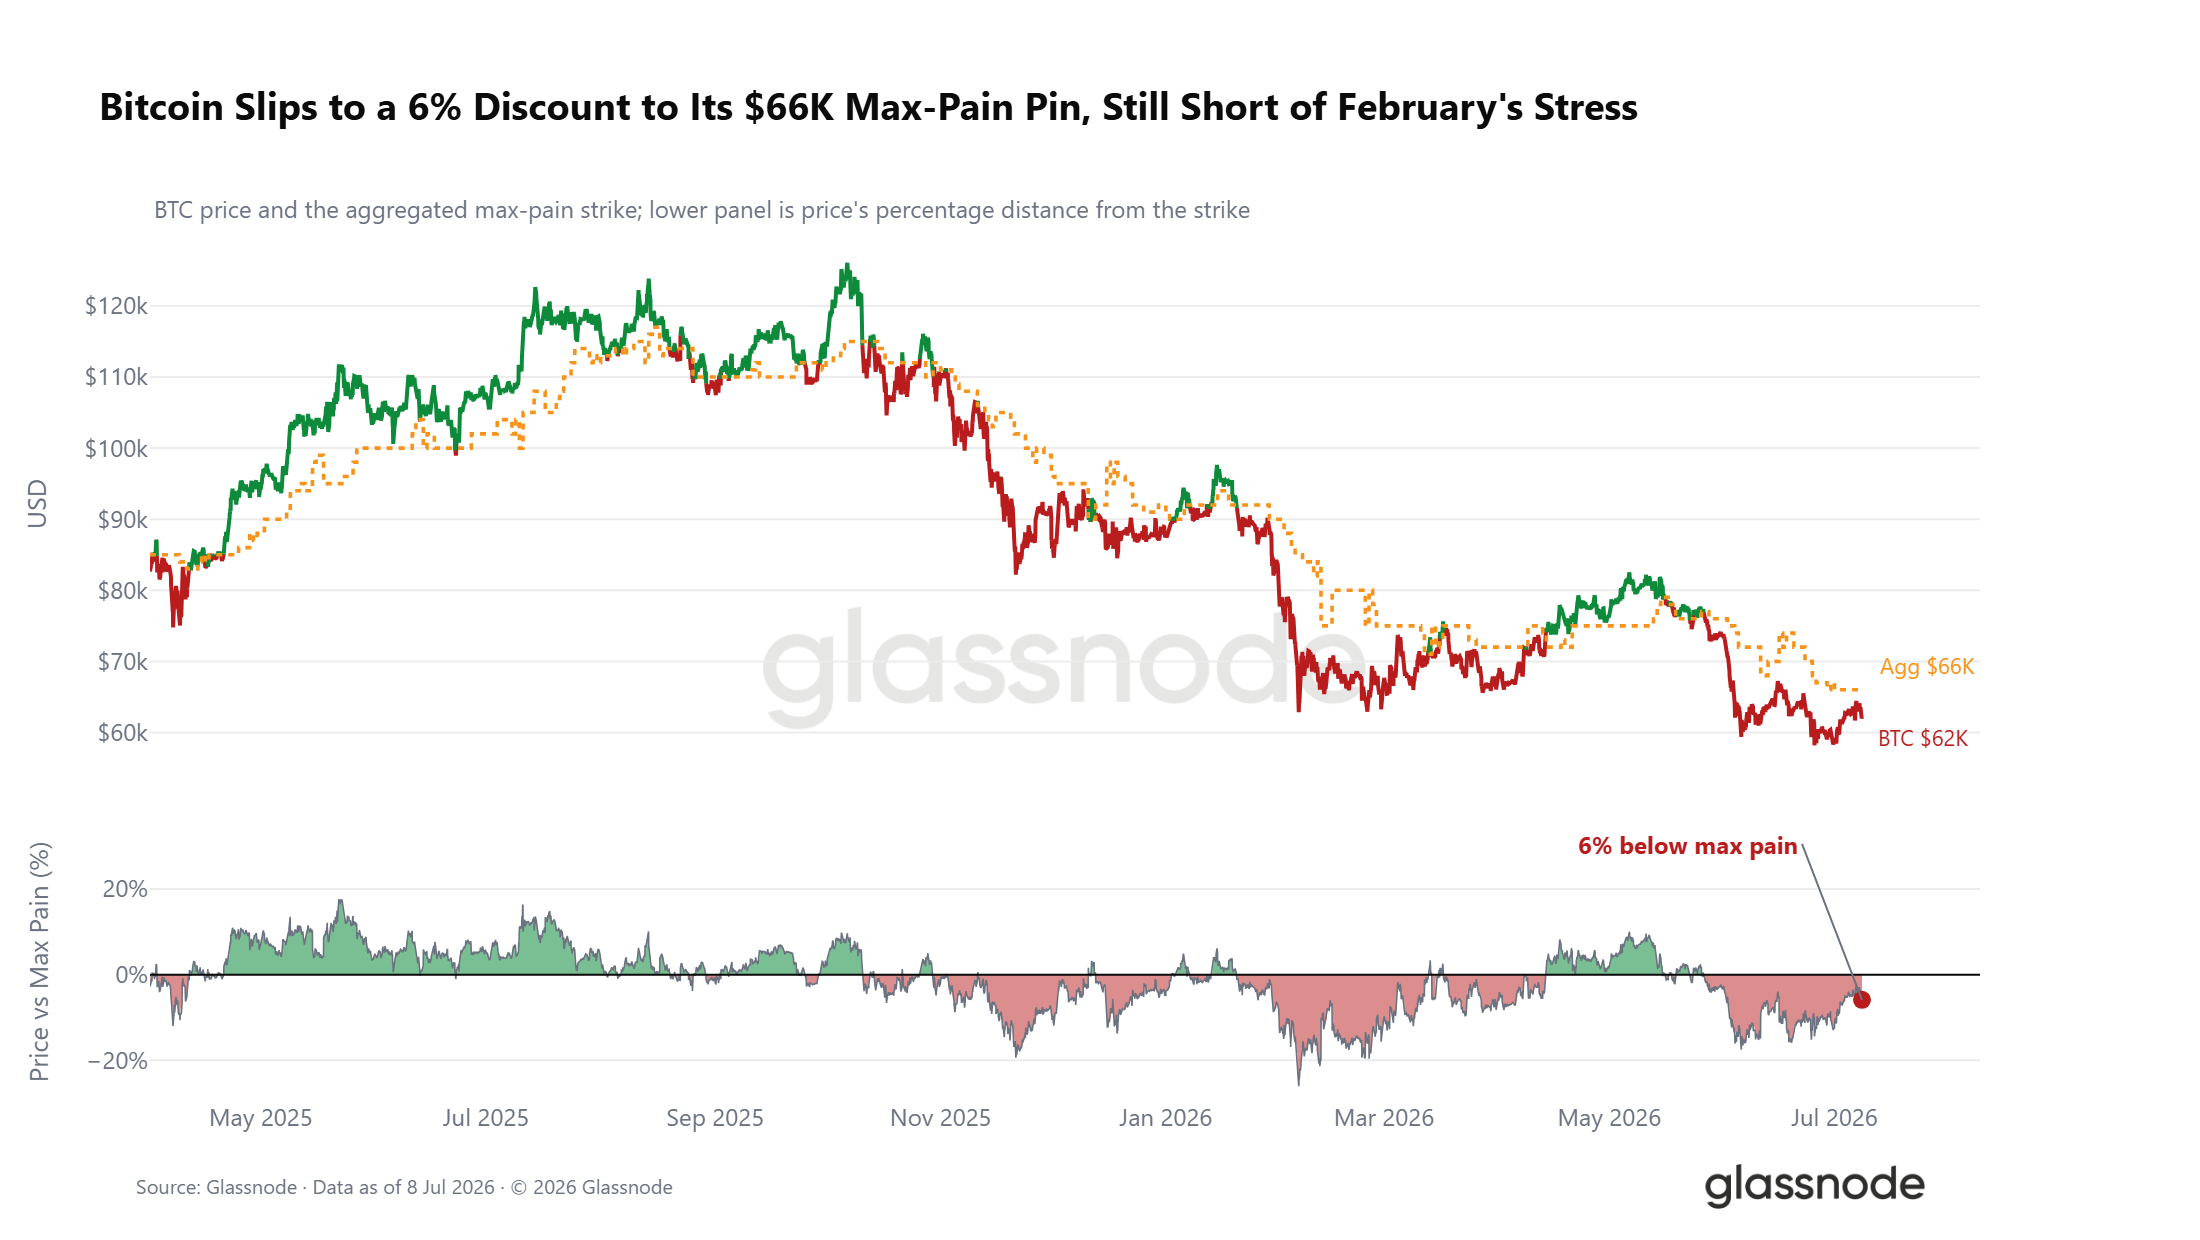
Aside from position and volatility skew, the relative position of spot prices and the structure of the options market provide additional market clues. Currently, Bitcoin's spot price is about 6% lower than the total maximum pain point of $66,000 in the entire market; the maximum pain point refers to the strike price at which the maximum number of unexercised contracts expires to zero, and the market tends to converge towards this price before expiration.
This week’s drop further widened the gap between the spot price and the maximum pain point, but the degree of divergence is not as extreme as during the declines in February, remaining in the middle of the volatility range for 2026. The maximum pain point for the year has consistently acted as the central gravitational pull for market movements, with the spot price oscillating around this level and rarely showing significant long-term divergence. If the price remains firmly above $66,000, short-term market signals may turn optimistic; if the gap further widens, it will reinforce the overall defensive trading sentiment in the options market.
Downward Hedging Costs Continuing to Decline
While signals from volatility skew and holding structures are divergent, the trends in absolute costs for hedging downside risks are clear. As the market slightly rebounds, the pricing of put options at the 5% distance below the spot price on the one-month volatility curve has significantly decreased; the lowest pricing point on the volatility curve concentrates on far-end call options.
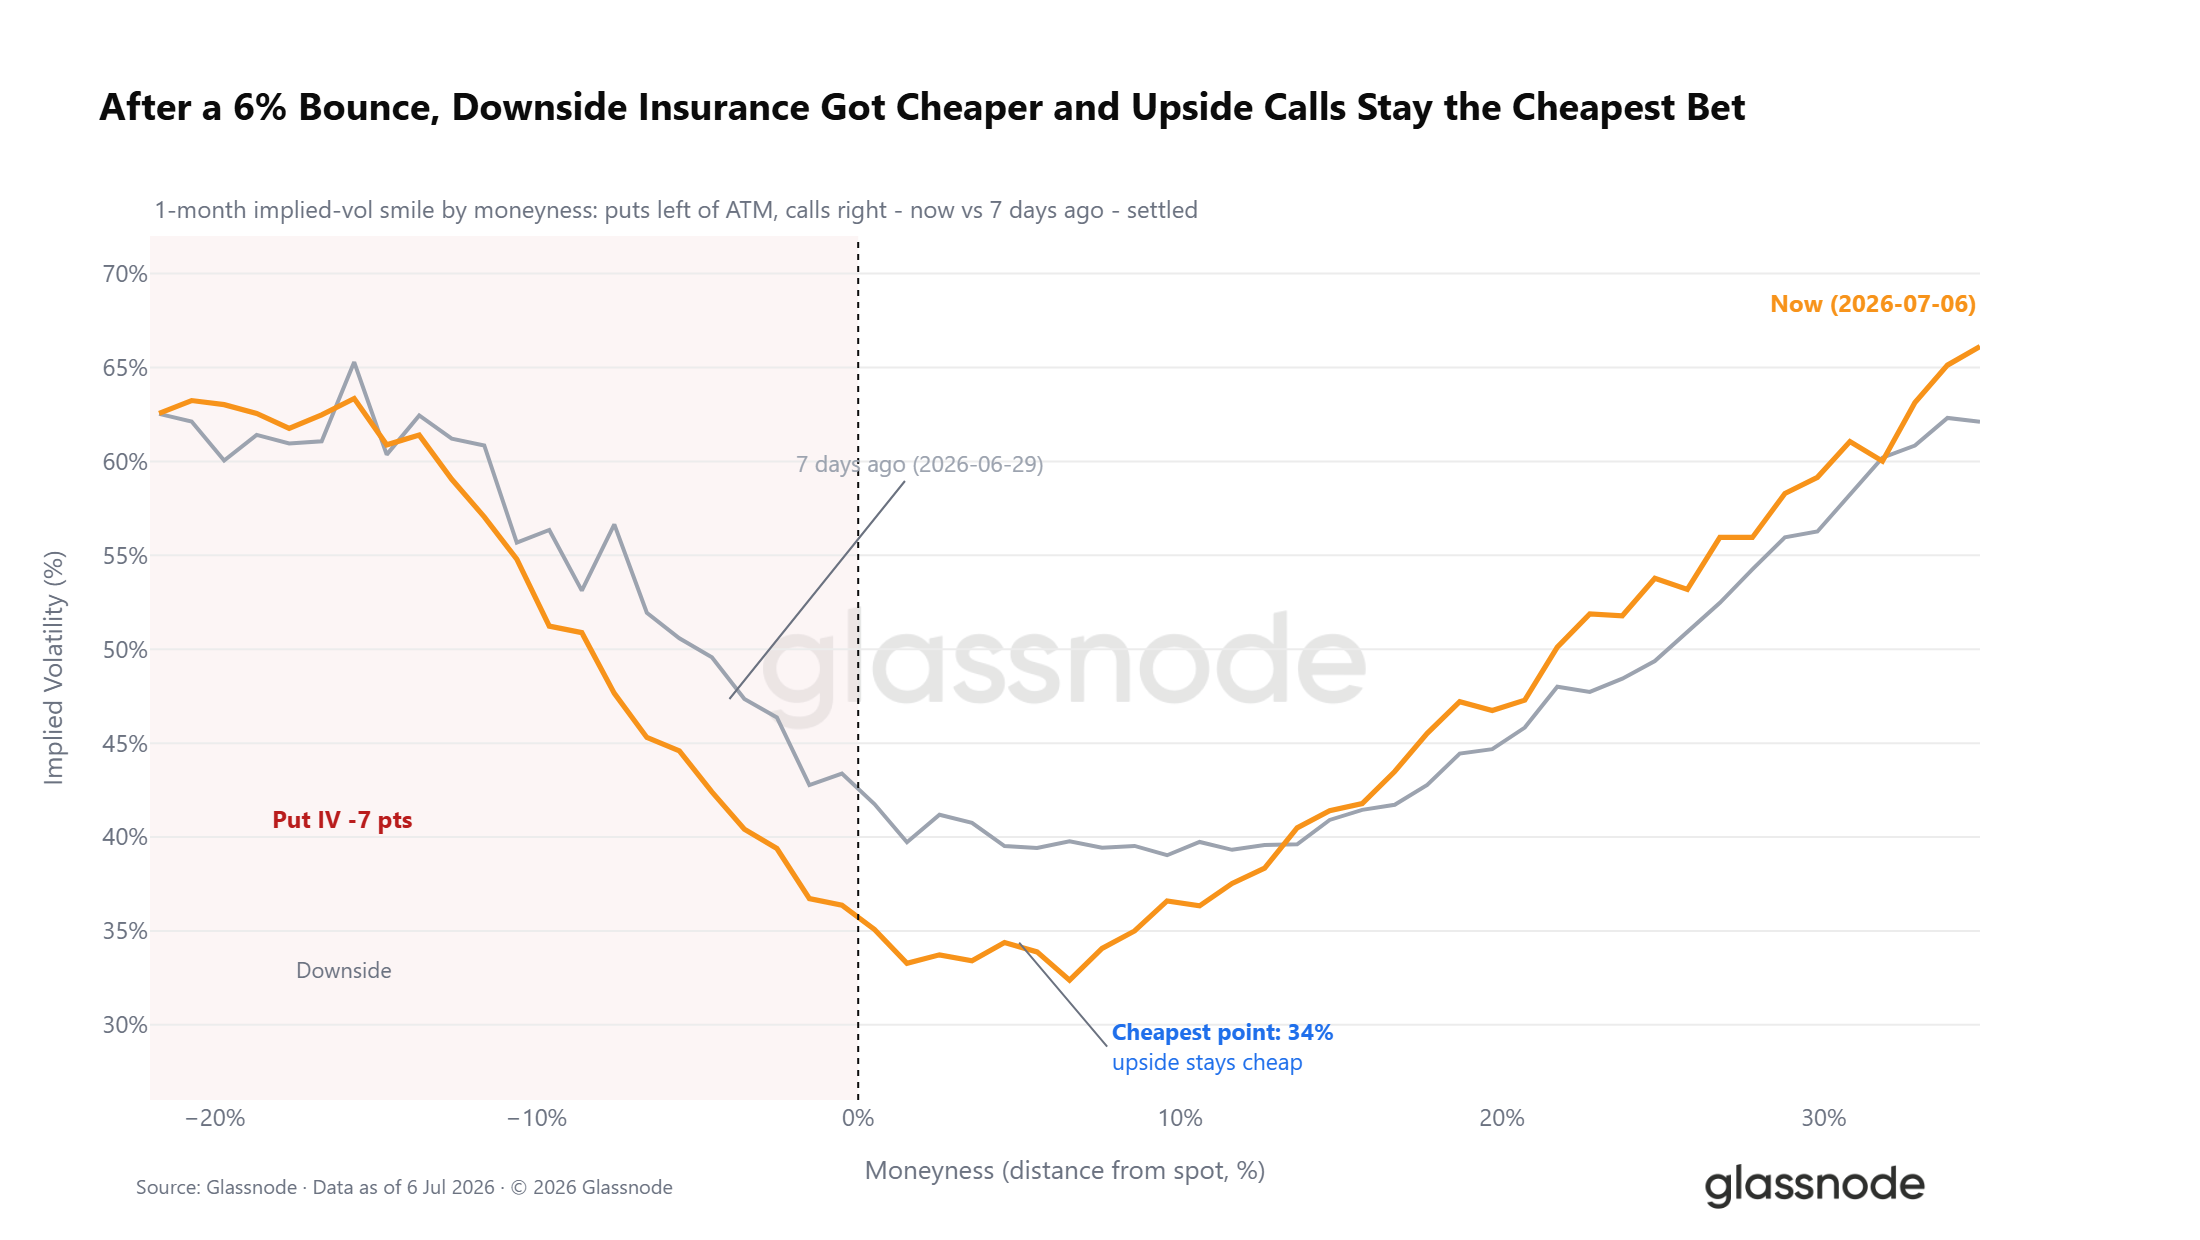
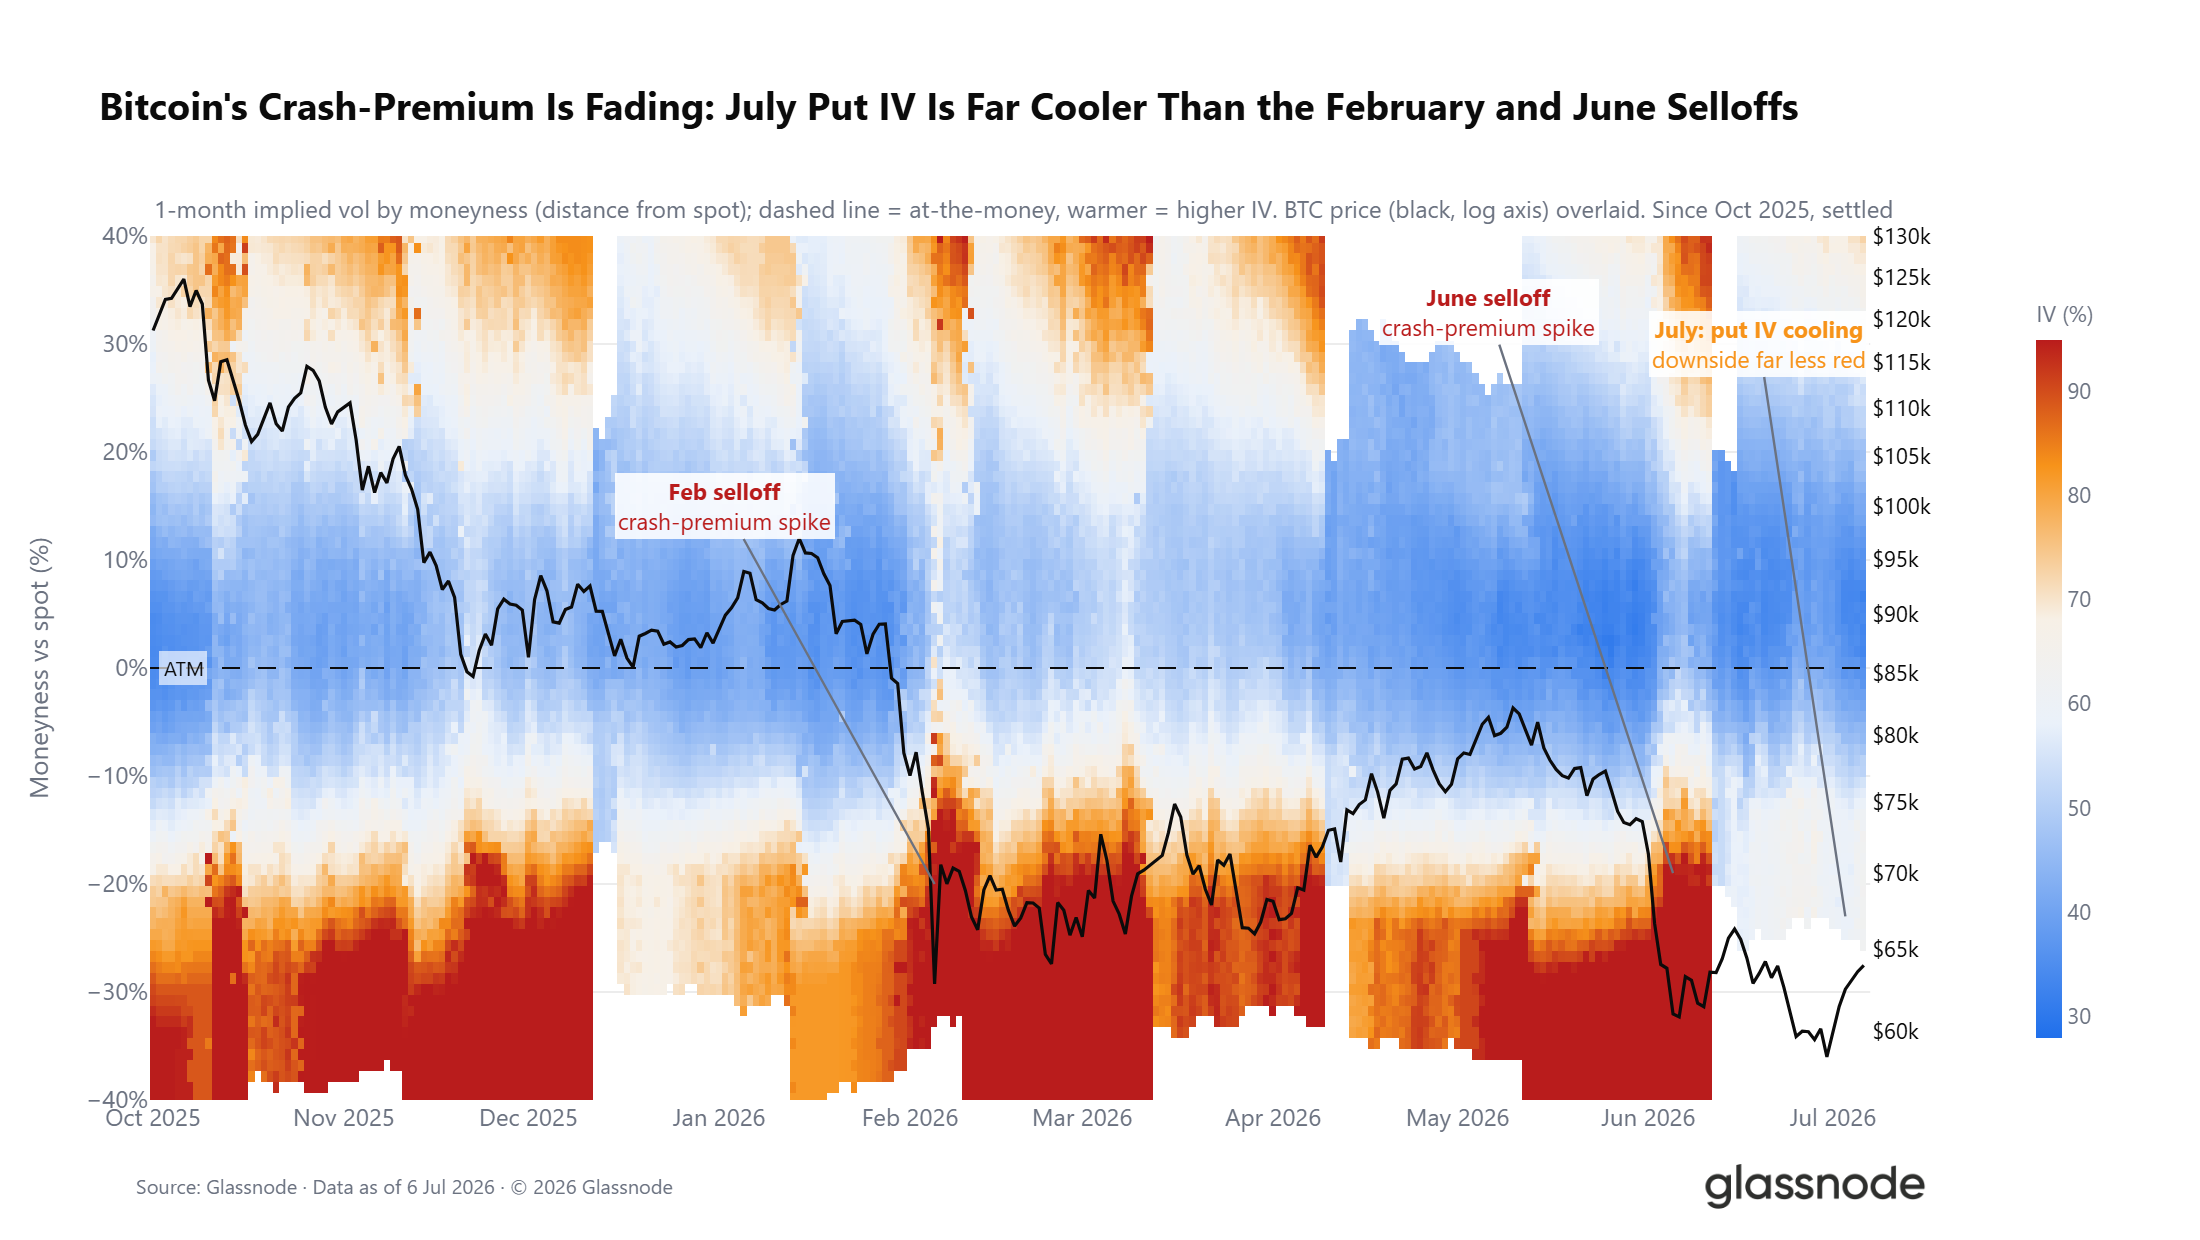
Overall market defensive sentiment persists, but the absolute costs traders pay to hedge against declines have clearly decreased. Extending the time dimension, this trend is even more notable: the extreme demand for bearish hedges during the declines in February and June has gradually receded since entering July. The DVOL volatility index has fallen to a 12-month low, with the market entering a low-volatility range. While cautious sentiment continues to dominate the market, the demand for hedging is gradually diminishing.
Summary
Comprehensive assessment of data across on-chain, off-chain, and derivatives markets clearly shows characteristics of the end phase of the bear market.
On-chain data indicates that the prolonged deep undervaluation cycle lasting over five months continues, with daily stop-loss realization scale for long-term holders rising to $280 million, indicating large-scale chip turnover is underway; however, this stop-loss indicator’s continuous decline is a necessary prerequisite for an effective market reversal.
Off-chain data shows that the scale of ETF fund outflows has narrowed from the peak in June, but monthly net outflows continue; the average daily trading volume has shrunk by 80% from the peak in October 2025, reflecting the low bullish confidence among institutions.
From the derivatives perspective, market positions have turned to a cautiously bullish stance, with the put/call ratio hitting a new low for the year; yet, volatility skew and options surface continue to price in downside risks.
Overall, all conditions necessary for the market to bottom have been met, but the core signals confirming the bottom have yet to appear. Future market trends need to satisfy three major conditions: the continued cooling of stop-loss selling pressure from long-term holders, stabilization of institutional fund flows, and effective standing of prices above the true market average, for the likelihood of a transition into a bull market cycle to significantly increase.
免责声明:本文章仅代表作者个人观点,不代表本平台的立场和观点。本文章仅供信息分享,不构成对任何人的任何投资建议。用户与作者之间的任何争议,与本平台无关。如网页中刊载的文章或图片涉及侵权,请提供相关的权利证明和身份证明发送邮件到support@aicoin.com,本平台相关工作人员将会进行核查。


