Source: Wall Street Journal
Technology momentum trading is experiencing the most severe collapse in history. Within just 17 trading days, the U.S. stock market's technology momentum factor (TMT MoMo) has fallen 40% from its peak, marking the fastest and deepest drawdown on record, spreading across semiconductor, hedge fund, and credit markets.
Mark Wilson, a Goldman Sachs partner and head of the EMEA hedge fund business, conducted a systematic review of this "brutal rotation" this week, pointing out that the speed and depth of this sell-off are historically rare, but its root causes are more related to crowded positions and concentrated leverage, rather than a substantial deterioration in the economy or corporate earnings. He stated that the unwinding process of the momentum factor is "nearing its end," but there is a lack of immediate catalysts for a reversal in the short term.
Notably, this round of momentum collapse occurs against a backdrop of overall robust macro and corporate fundamentals—American banking has reported a 17% year-on-year growth in corporate loans, TSMC has raised its revenue growth guidance for 2026 to over 40%, and inflation data has also come in mildly below expectations. This divergence between fundamentals and market price behavior is at the core of the current market contradiction.
The technology momentum factor faces the most severe sell-off in history, with a drawdown speed and depth exceeding historical medians
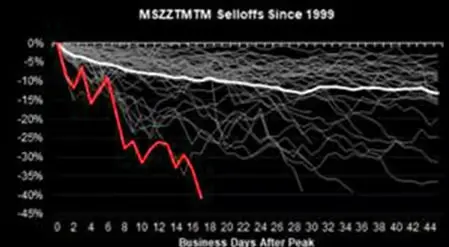
According to data from the Morgan Stanley Quantitative and Derivatives Strategy team (MS QDS), this round of momentum factor drawdown has lasted 17 trading days, with a peak-to-trough decline of 28%. In comparison, the historical median drawdown for momentum factors since 1999 is 22%, averaging 33 trading days.
This indicates that this downturn has surpassed historical median levels in both speed and depth, being the most severe since the 29% drawdown from December 2022 to February 2023.
The situation in the technology sector is even more extreme. The TMT momentum factor (TMT MoMo) has fallen 40% from its peak, and according to MS QDS data, this is the fastest and deepest sell-off of the technology momentum factor ever recorded.
From the perspective of various segments, the South Korean Composite Stock Price Index (Kospi) has fallen 27% from its peak, U.S. AI beneficiary stocks have dropped 25%, global memory chip stocks have decreased by 36%, and European semiconductors have fallen 23%. Among them, memory chip stocks account for about two-thirds of the overall decline, while broader AI beneficiary stocks have dropped by about 24% from their highs.
Superficial low volatility hides high intensity inside; the market risk structure is collapsing
Price declines are merely the surface of this turbulence; the changes in the internal risk structure of the market are equally noteworthy.
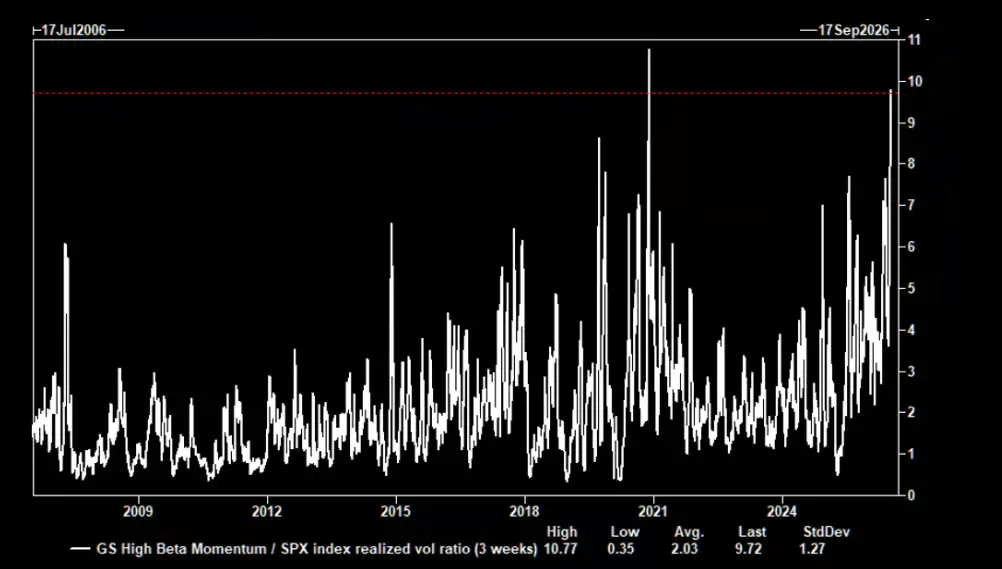
According to Goldman Sachs' volatility trading desk data, the volatility of Goldman Sachs' high beta momentum portfolio (GSPRHIMO) is currently about 10 times that of the S&P 500 index volatility. In the past 20 years of historical analysis, such a disparate volatility ratio has only been comparable to during the pandemic shock in November 2020.
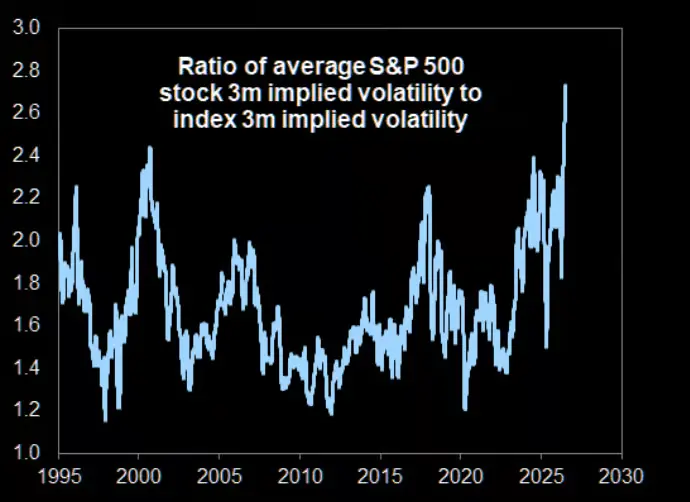
At the same time, the gap between single stock volatility and index volatility has expanded to historical extremes. Goldman Sachs data shows that the 3-month implied average correlation of S&P 500 constituents fell to a historical low of 0.14 this week, causing the S&P 500 index volatility to remain low, while the average implied volatility of single stocks soared to 40%, which is 2.8 times that of the index implied volatility, also setting a historical record.
Positions remain crowded, risk has not cleared
Despite the momentum factor recently facing historically significant drawdowns, hedge funds still maintain high net exposures to it from a long-term perspective. According to JPMorgan data, the current combination of position levels and drawdown magnitude makes the momentum factor continue to be viewed as one of the most concerning core risks in the market.
Meanwhile, the Goldman Sachs high beta momentum factor has dropped 33% since the June peak, with the year-to-date increase plummeting from 60% to just 12%, which Mark Wilson also highlighted.
He cited signs of deleveraging in the Korean market as evidence: it was reported that this week, approximately 1 in every 30 South Korean adults had their stock margin accounts forcibly liquidated, indicating that the deleveraging process has commenced to a significant extent.
Fundamentals intact, risks lie in positions and structure
The special aspect of this round of momentum collapse is that it occurs against a backdrop of generally improving corporate fundamentals and macro data.
Mark Wilson pointed out that this week's U.S. banking earnings reports present a "clear positive interpretation" of the economic situation: corporate loans have increased 17% year-on-year, setting a record, covering all areas of the economy; the tracking growth rate of U.S. consumer spending is in the low single digits, with credit card spending growing 6%; investment banking-related business lines combined grew over 40%; and large banks maintained a tangible return on equity of 19%, a new high since the financial crisis.
In terms of technology capital expenditure, TSMC raised its revenue growth guidance for 2026 to over 40% (based on a revenue base of over $150 billion), while ASML's earnings report sparked market expectations of a 15% to 30% upward adjustment in its earnings per share over the next one to three years.
However, both companies' stock prices fell after earnings announcements, displaying a typical "buy the rumor, sell the news" trend. In contrast, IBM saw its stock price decline by more than 20%, the largest single-day drop in over 20 years, due to delays in large contracts and underwhelming consulting business performance.
Mark Wilson emphasized that this round of sell-off "is hard to identify with clear signals on the fundamental level," reflecting more structural factors like positions, leverage, crowding, and concentration.
Rotation nearing its end, but reversal catalysts are yet to emerge
Mark Wilson stated that he leans towards believing the unwinding process of the momentum factor is nearing its end, but he also pointed out that there is a lack of immediate catalysts to drive a market reversal in the short term.
He also indicated that as efficiency and business implementation capabilities improve, new leading directions in the market will gradually emerge, expanding the market breadth—an example being the Dow Jones Transportation Average breaking new highs this week.
However, he warned that the second derivative of profit growth (i.e., the slowdown of growth) will become increasingly important after the market digests the second-quarter earnings reports and enters the summer, while current various valuation metrics show that technology sector valuations still appear to be high.
Additionally, traditional asset classes and the correlations within assets are experiencing abnormal breaks, such as the 3-month correlation between gold and oil dropping to an extreme inverse level historically, further increasing the difficulty of risk management and portfolio construction.
免责声明:本文章仅代表作者个人观点,不代表本平台的立场和观点。本文章仅供信息分享,不构成对任何人的任何投资建议。用户与作者之间的任何争议,与本平台无关。如网页中刊载的文章或图片涉及侵权,请提供相关的权利证明和身份证明发送邮件到support@aicoin.com,本平台相关工作人员将会进行核查。


