Cryptocurrency Academy: On July 20, Bitcoin (BTC) dual-cycle resonance issued a warning, is the oscillation pattern about to break into a trending market? Latest market analysis and operational advice interpretation
Currently, Bitcoin is at 64,400, and before the market gives a clear signal, do not overdramatize for yourself. The current sideways movement is essentially a stalemate around 64,000 between the bulls and bears, and neither has taken control. At this time, do not think about bottom-fishing or top-tapping; first, ensure that you are not repeatedly harvested. Keep your positions light, set strict stop-losses, hold onto certainty in your hands, and leave the rest to the market.
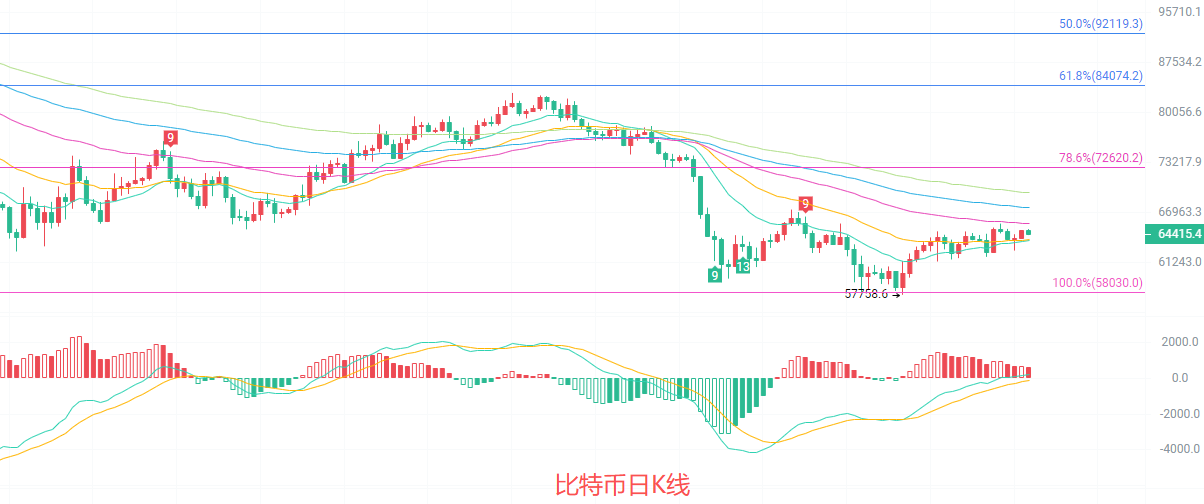
The daily K-line is below the critical Fibonacci 78.6% to 100% retracement range, currently supported by the EMA15 and EMA30 moving averages in the short term, while the EMA60 and EMA90 are still exerting downward pressure, with the southward trend not completely reversed. The MACD indicator's red bars are continuously shortening, and after the DIF and DEA golden cross, momentum is waning. The middle track of the Bollinger Bands at 63,145 and the upper track at 66,278 form a short-term oscillation range, and overall, it is still in a weak recovery phase after falling, with insufficient rebound volume.
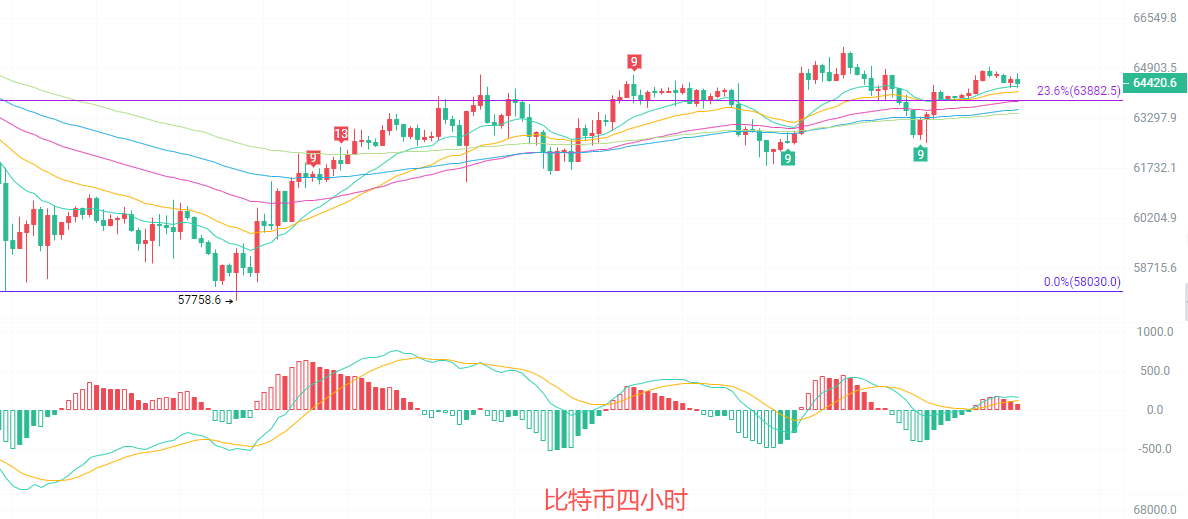
The four-hour K-line is testing the Fibonacci 23.6% resistance level. The EMA15 and EMA30 moving averages are in a converging state, with fierce competition in the short term between bulls and bears, and the EMA60 and EMA90 form a lower support zone. The MACD indicator shows weak red bars after the DIF and DEA golden cross, and upward momentum has not been effectively released; the middle track of the Bollinger Bands at 64,100 and the upper track at 65,145 form an oscillation range. The price has tested the upper track multiple times without success, with significant selling pressure above, and the short-term remains dominated by oscillation.
Short-term reference:
If the lower range of 63,100 to 62,700 does not break, look upward, stop-loss at 62,200, target at 64,500 to 65,500.
If the upper range of 65,500 to 66,000 does not break, look downward, stop-loss at 66,500, target at 64,500 to 64,000.
Specific operations should be based on real-time market data. For more detailed information, you can consult the author. The article publication may have delays; it is suggested to only serve as a reference, risks are borne by yourself.

Friendly reminder: The above content is only created by the author on the official account, ads at the end of the article and in the comments section are unrelated to the author, please discern carefully, thank you for reading.
免责声明:本文章仅代表作者个人观点,不代表本平台的立场和观点。本文章仅供信息分享,不构成对任何人的任何投资建议。用户与作者之间的任何争议,与本平台无关。如网页中刊载的文章或图片涉及侵权,请提供相关的权利证明和身份证明发送邮件到support@aicoin.com,本平台相关工作人员将会进行核查。