Cryptocurrency Academy: Bitcoin (BTC) is experiencing high-level fluctuations, with undercurrents stirring. Has the signal for a Bitcoin trend change already emerged? Latest market analysis and operation suggestions explained.
The current price of Bitcoin is 78000, feeling confused again? Watching the market go neither up nor down, afraid of missing a new round of rises, and also afraid of being caught in a high position after chasing. After the big rise, market divergence has significantly increased, many people are conflicted about whether to hold long or switch to short positions. I am still on the way up, of course the market won't always rise unilaterally, after a surge, there will inevitably be a process of retracement and accumulation of strength. Blindly chasing rises and killing dips is the easiest way to get stuck. So I will temporarily not consider getting off.
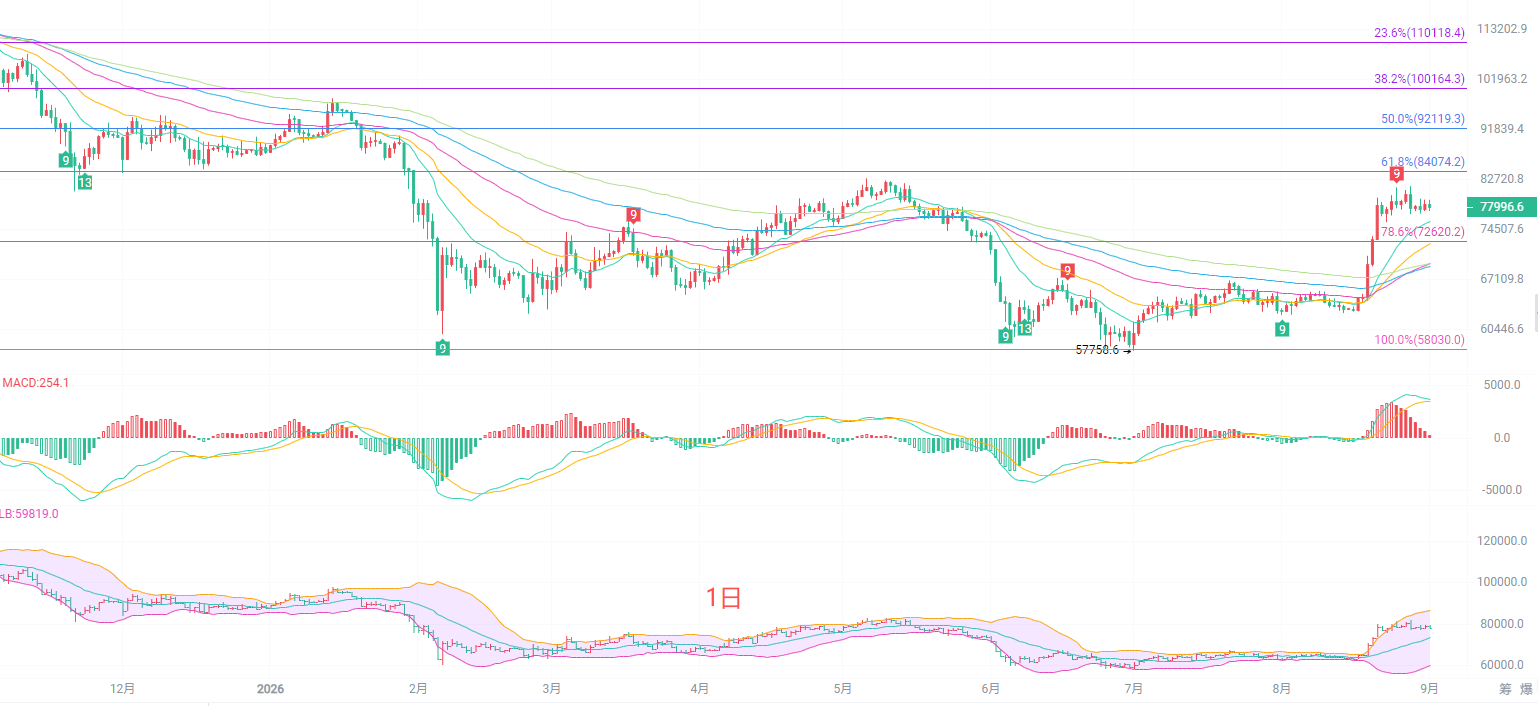
The daily K-line is still above several EMA moving averages, the overall bullish pattern has not been directly broken. The 15-period EMA at 75752 forms short-term strong support, while the 30-period EMA at 72280 is an important defense level in the medium term. The MACD indicator shows a gradual shortening of the red bars, indicating a decrease in bullish momentum, while the upper Bollinger Band at 86316 limits the upward space, and the middle band maintains an upward trend. The Fibonacci 78.6% position at 72620 is a key dividing line; as long as this position is not effectively broken below, the daily level still belongs to a correction after an upward trend. If it continues to be pressured, it will further test the moving average support downwards; in terms of operation, it is not advisable to blindly chase highs, waiting for a retracement confirmation is more prudent.
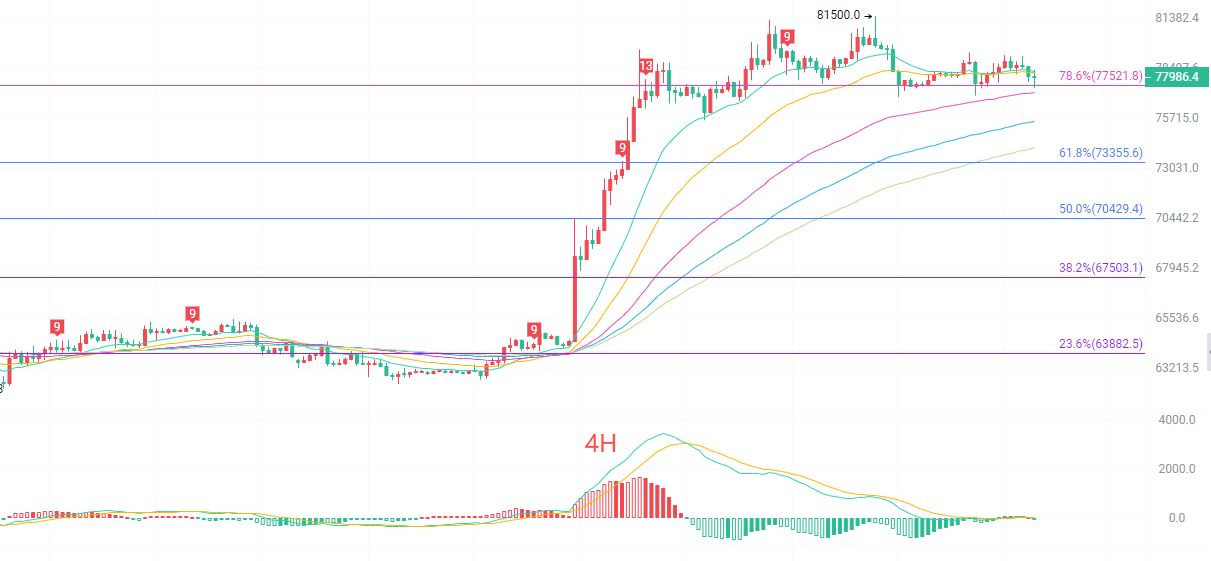
The four-hour K-line is being pulled back and forth near the middle Bollinger Band. The short-term EMA15 and EMA30 moving averages are flattening, and the upward momentum is noticeably slowing down, entering a consolidation pattern in the high range. The upper 78.6% Fibonacci position at 77521-78200 creates direct pressure, while the 61.8% position at 73355 is an important support below. The DIF and DEA of the four-hour MACD are intertwined, with long and short forces tending to balance, lacking a clear unilateral signal. The opening of the Bollinger Band is beginning to converge, indicating that a directional breakthrough is about to occur in the short term, with the consolidation range continuously narrowing. Currently, there is no obvious trend in the market, so it is advisable to avoid chasing orders, waiting for the price to break through the range before following the trend, reducing repeated losses in the volatile market.
Short-term reference:
Buy from 77500 to 77000, stop loss at 500 points, target at 80200 to 81200.
Sell from 81200 to 81600, stop loss at 500 points, target at 80000 to 79000.
Specific operations should be based on real-time market data, for more detailed information you can consult the author. The article may be delayed in publication, suggestions are for reference only, and risks are to be borne by oneself.

Warm reminder: The above content is solely created by the author; advertisements at the end of the article and in the comment section are unrelated to the author. Please identify carefully, thank you for reading.
免责声明:本文章仅代表作者个人观点,不代表本平台的立场和观点。本文章仅供信息分享,不构成对任何人的任何投资建议。用户与作者之间的任何争议,与本平台无关。如网页中刊载的文章或图片涉及侵权,请提供相关的权利证明和身份证明发送邮件到support@aicoin.com,本平台相关工作人员将会进行核查。