Crypto Circle Academician: 9.2 Ethereum (ETH) profit-taking concentrated digestion, an in-depth analysis of the underlying logic of Ethereum's volatile market? Latest market analysis reference
Current price of Ethereum is 2449, uncertain about the direction? Afraid of a pullback after a slight rise, worried that the big market hasn't finished after a slight drop, repeatedly sweeping stop losses, making operations extremely torturous. This wave has seen a significant rise from the low, with bulls accumulating a large amount of profit-taking positions, and the market is no longer a one-sided mindless rise; the long-short game is intensifying. Many people are troubled about whether to continue to follow the trend and go long, or to layout short positions on high, which is because you missed the opportunity to rise from the low together with me, leading to anxiety.
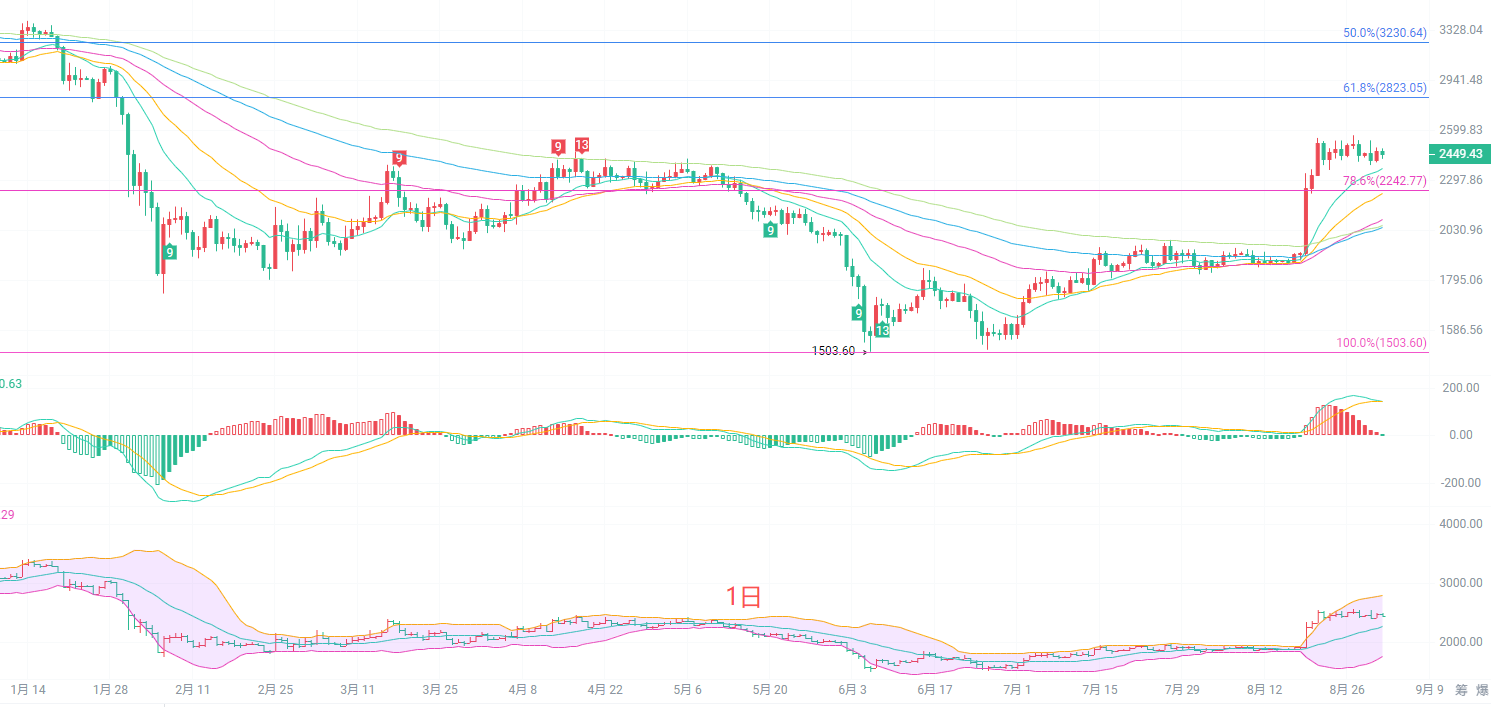
The daily candlestick chart has retreated into a high-level consolidation range. The moving average system still maintains a bullish arrangement, with the short-term EMA15 and EMA30 moving averages forming support below, indicating that the large-scale upward trend has not been directly damaged. The Bollinger Bands are opening upwards, with prices fluctuating near the upper band; the MACD indicator's red bars are gradually shrinking, with DIF and DEA still maintaining above the zero axis, indicating a decline in bullish momentum. The core pressure above is concentrated at the previous high of 2566, which is an important threshold for this round of increase. If it cannot break through effectively, it will continue to be under pressure for a pullback; the key support below is at about 2242 near the 78.6% Fibonacci level. Once this level is broken, the pullback space on the daily chart will further open up.
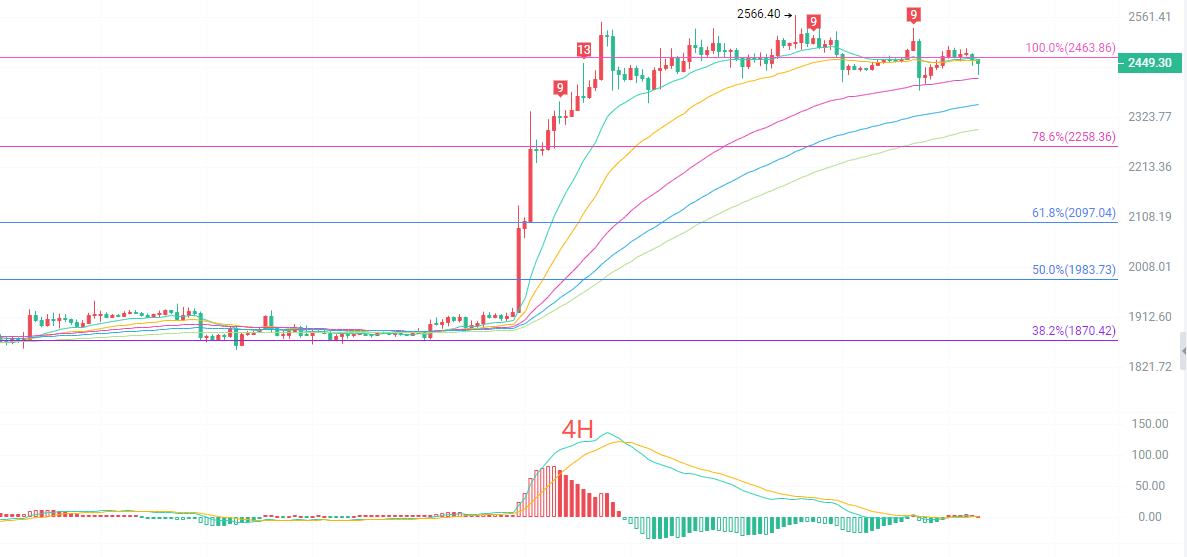
The four-hour candlestick chart is fluctuating back and forth in the range of 2463-2421, which belongs to a horizontal digestion trend after the rise. The EMA moving average cluster remains upward, and the short-term moving averages are entangled and flattening, indicating that the long and short forces are tending towards balance. The Bollinger Bands have begun to narrow, with the price volatility decreasing, indicating that a direction is about to be chosen in the future. The MACD is operating above the zero axis, with red and green bars alternating, without forming a clear unilateral momentum. The strong pressure above at 2463 is the 100% Fibonacci extension level, unable to stabilize after several tests; the first support below is at 2415, the lower Bollinger Band position, with strong support at the 78.6% pullback level of 2258. Currently, the four-hour chart has not produced a breakout signal, belonging to a high-level box oscillation. Before an effective breakthrough of the upper and lower boundaries, the risk of chasing orders is high; it is advisable to wait for the price to touch key pressure support before responding.
Short-term reference:
If the lower level of 2440 to 2410 does not break upward, stop loss of 40 points, target looking at 2530 to 2620.
If the upper level of 2540 to 2560 does not break downward, stop loss of 40 points, target looking at 2500 to 2450.
Specific operations should mainly depend on real-time market data. For more information, you can consult the author. There may be a delay in the article release, so it is suggested for reference only and the risk is self-assumed.

Warm reminder: The above content is only created by the author of the public account; the advertisements at the end of the article and in the comments section have no relation to the author. Please be cautious in distinguishing, thank you for reading.
免责声明:本文章仅代表作者个人观点,不代表本平台的立场和观点。本文章仅供信息分享,不构成对任何人的任何投资建议。用户与作者之间的任何争议,与本平台无关。如网页中刊载的文章或图片涉及侵权,请提供相关的权利证明和身份证明发送邮件到support@aicoin.com,本平台相关工作人员将会进行核查。