Author: Dwarkesh Patel
Translation: Deep Tide TechFlow
Deep Tide Overview: In the past six years, the capabilities of AI models have advanced rapidly, but do the improvements come from algorithms or data? This article provides an counterintuitive conclusion through a set of small-scale controlled experiments: the efficiency gains in computational power from data improvements exceed model improvements by more than three times. For those focused on AI infrastructure investment and frontier laboratory competition, it reveals an underestimated driving force: data engineering.
In recent years, how much of the rapid progress we've seen in AI comes from data improvements, and how much from model improvements? The answer to this question has significant implications for the economic model of frontier laboratories and the pace of future advancements.
We conducted a relatively small-scale investigation focusing on pre-training from 2019 to 2025. During these years, a new set of open-source model proposals was published each year, summarizing known algorithm adjustments for that year (improvements in aspects such as architecture, optimizers, initialization, learning rate scheduling, hyperparameters, etc.). Meanwhile, new public data corpora also emerged each year (produced by larger-scale scraping and new curation, extraction, and filtering techniques).
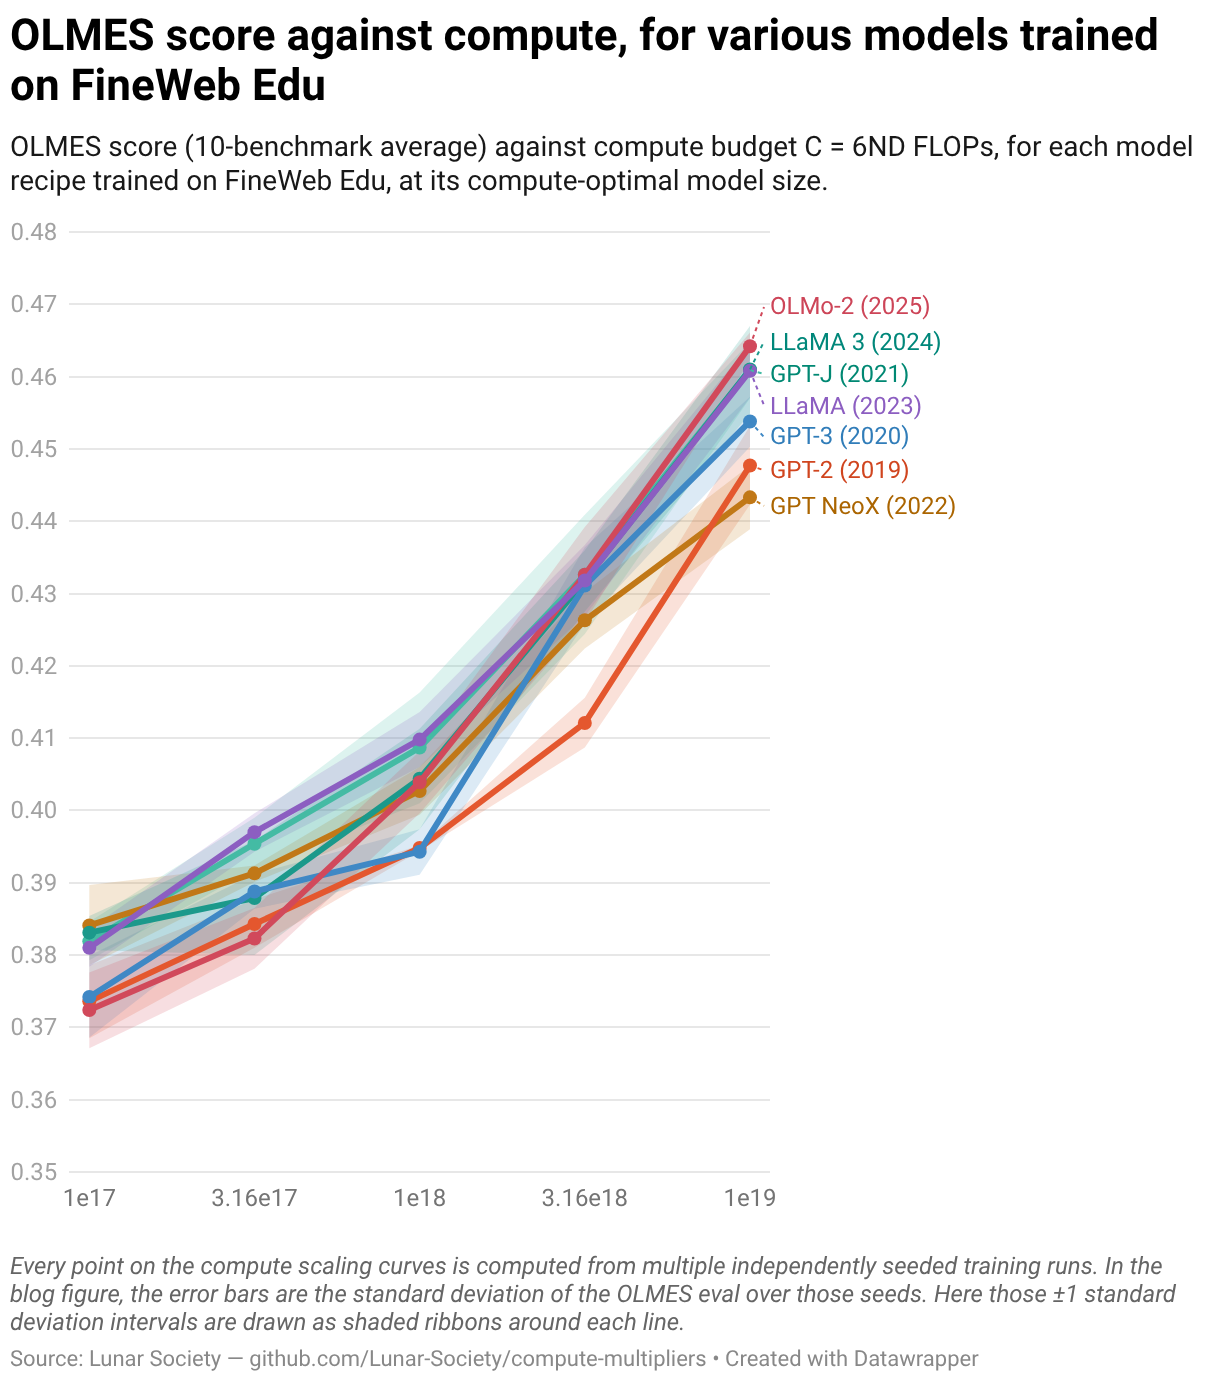
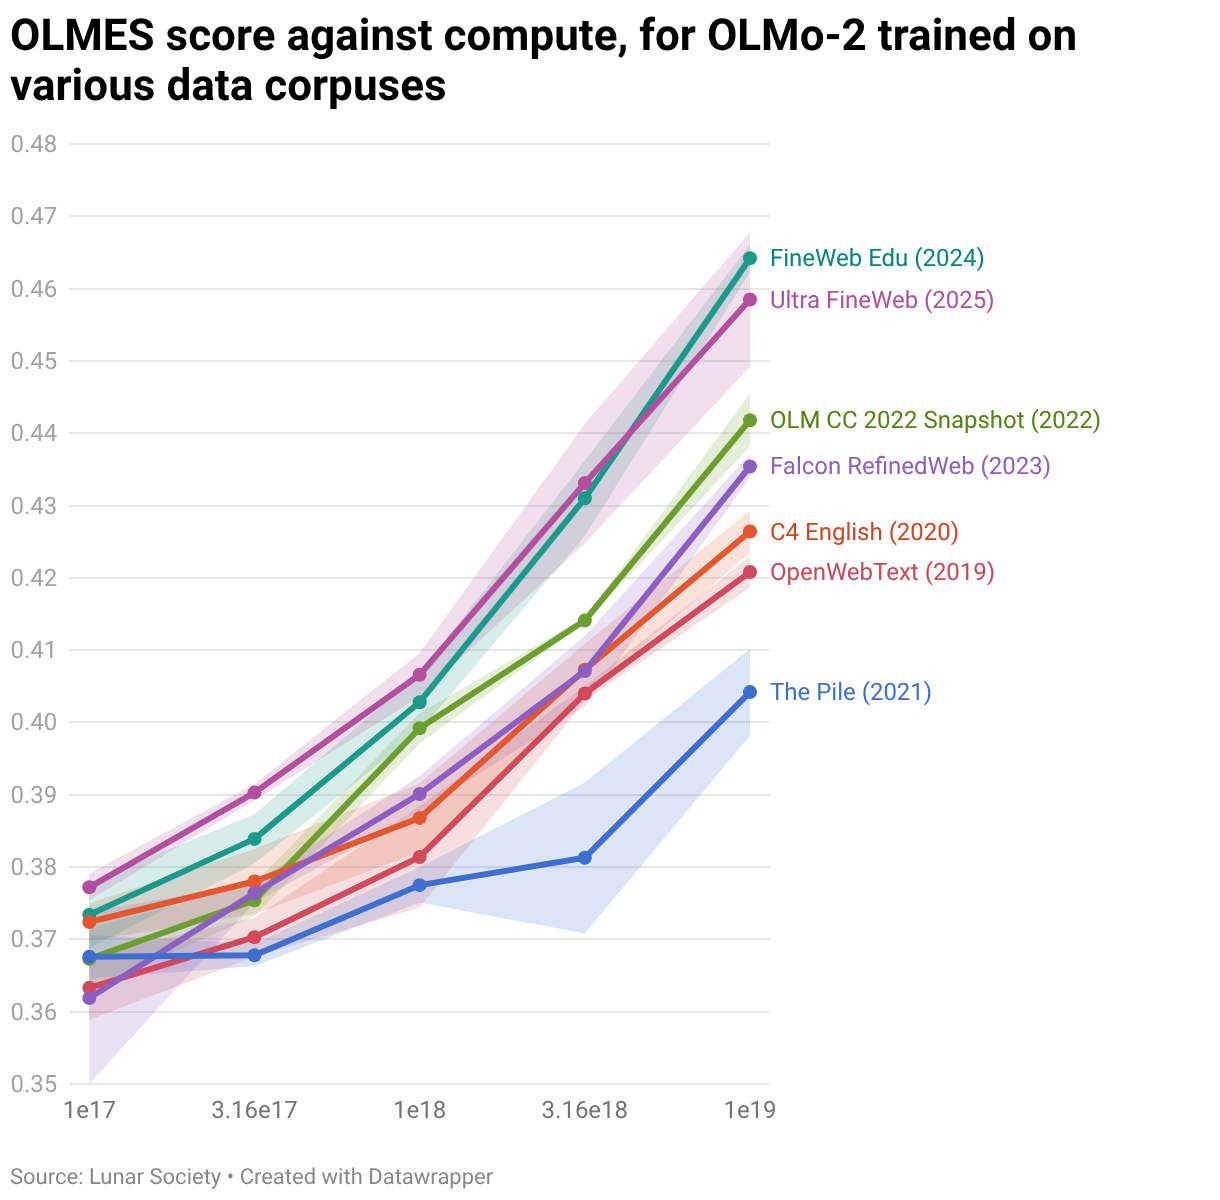
We trained various combinations of these model proposals representing different years along with the data corpora, under varying computing power scales (up to 1e19 FLOPs).
Clearly, we cannot compare these different models through their cross-entropy loss on a fixed dataset, as we are changing the dataset they were trained on. Therefore, we evaluated these models based on final capabilities, using OLMES evaluation (which summarizes 10 relatively simple benchmarks, mostly multiple-choice question and answer). Unfortunately, assessing final capabilities instead of pre-training loss adds some noise to our results, as you will see in the figures below, but we tried to achieve cleaner boundaries through multiple random seeds.
We found that from 2019 to 2025, under a computing power budget of 1e19 FLOPs, more than 3.24 times the improvements in computational efficiency came from data improvements rather than model improvements (data at 12.0 times, model at 3.7 times).
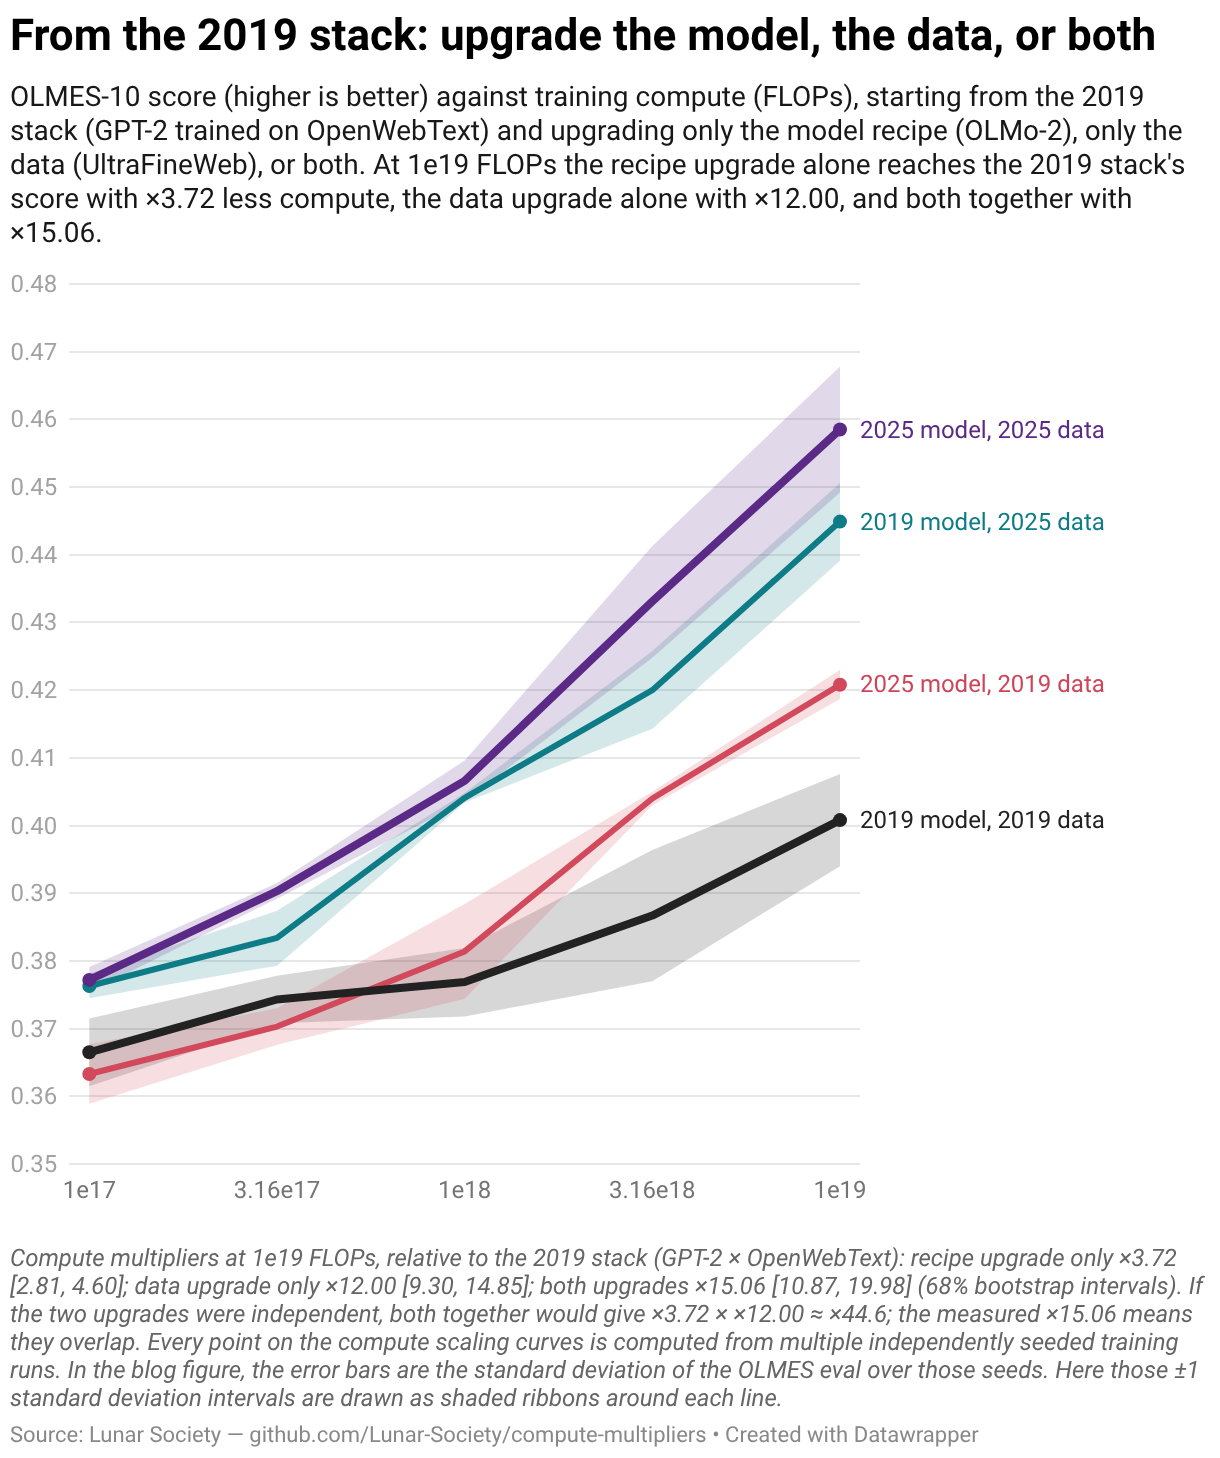
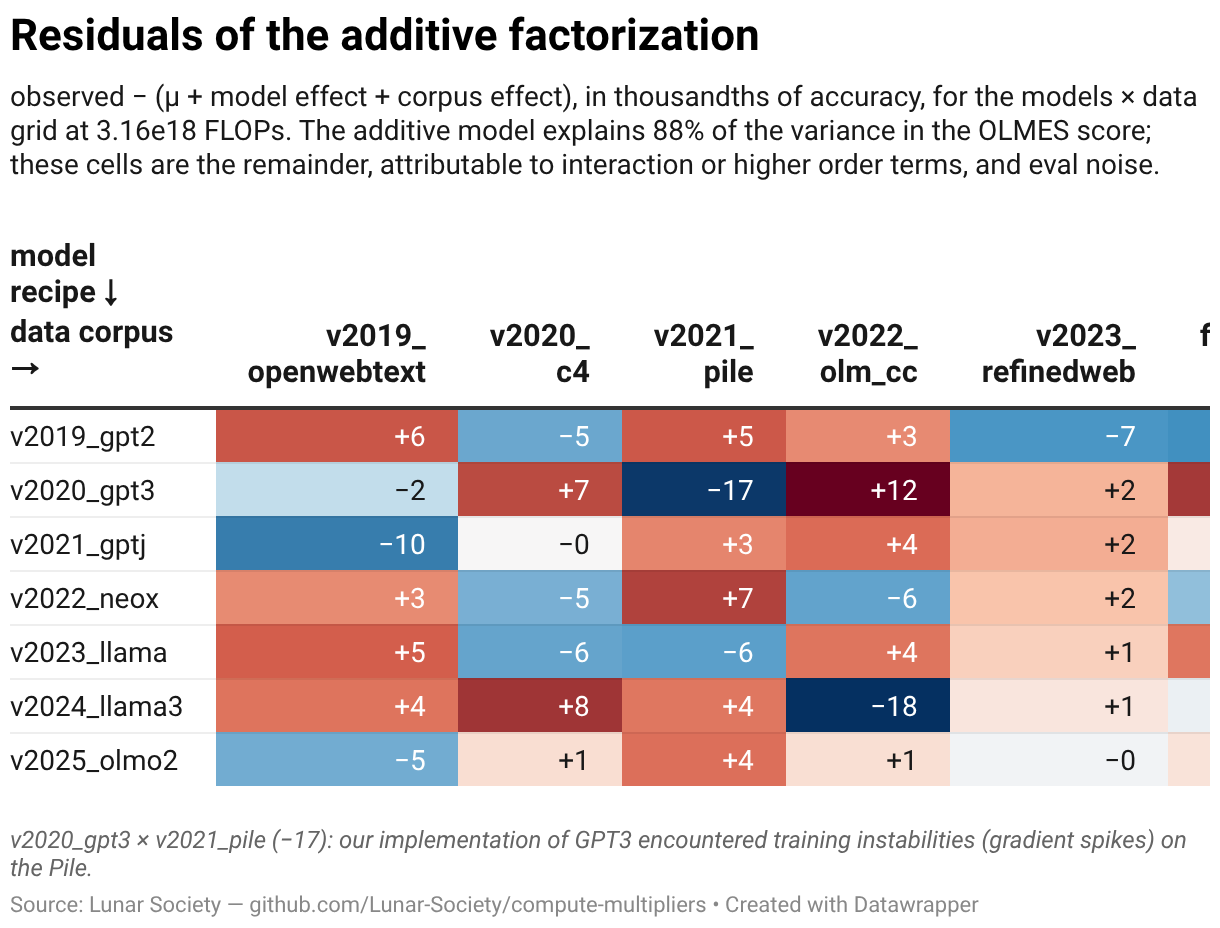
The grid below shows the extent to which our trained models under the computing power of 3.16e18 FLOPs improved in final testing capability, relative to the 2019 data plus architecture baseline.
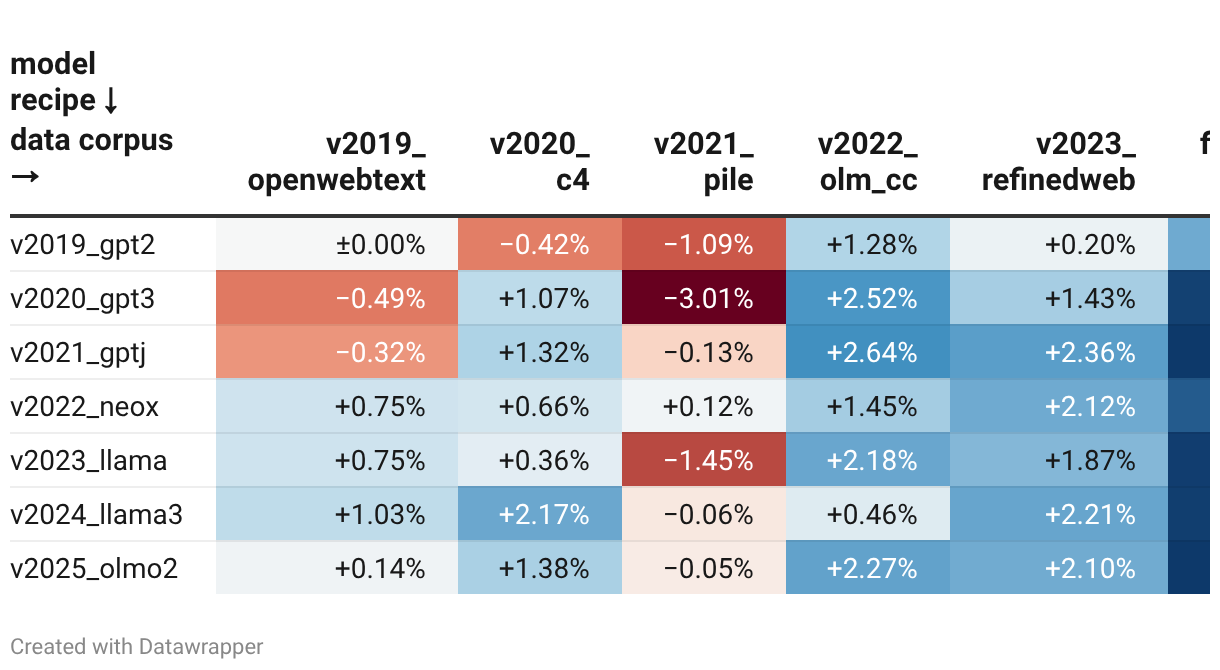
We discovered that the benefits brought by data improvements and model improvements are mostly independent of each other, with no interaction (that is, the benefits of a certain model improvement do not depend on a specific training data pile, and vice versa). Using a linear model, 88% of the variance in OLMES scores can be explained by the additive effects of model improvements and data improvements.
Discussion
As background, let us briefly summarize what changes occurred on the data side and model side from 2019 to 2025.
On the model side, we progressed from GPT-2 to OLMo-2, including key innovations in optimizers, positional encoding, normalization, activation functions, initialization, and more.
On the data side, we began in 2019 with OpenWebText, which only contained links to web pages that were highly upvoted on Reddit, and after deduplication and filtering, resulted in approximately 9 billion tokens (this was essentially the training data for GPT-2). By 2025, open-source data corpora like UltraFineWeb not only had a much larger scale (produced by scraping the entire internet) but also employed much more complex filtering methods (for example, training a classifier to predict which data can actually enhance model performance).
A naive interpretation of our results is that most of the advancements in AI from 2019 to 2024 (the pre-training era) are actually just better data engineering (extraction, curation, etc.), while all the model work during that period was far less significant.
However, this might be an erroneous way to view the value of model improvements. The main contribution of model improvements may not necessarily be computational efficiency, which means achieving the same performance with fewer FLOPs. Instead, it primarily makes larger-scale computational power available. As the parameter count, context length, runtime, and cluster scale expand, various problems can easily go awry (gradient explosion or vanishing, memory and bandwidth exhaustion, and training becoming impossibly slow). A significant portion of model research is about removing or pushing back these limitations to scaling. Many of the most important innovations belong to this category, such as MoE, sparse attention variants, stability innovations (normalization of positions, initialization, etc.), and systems and kernel-level optimizations like FlashAttention.
The data improvements we study here may be less important for larger models. Smaller models (like those we trained) benefit significantly from improved data quality, as they have limited capacity, so you must be very careful about what you decide to feed into them. Larger models have a lot of excess capacity, and you might want to throw as much data in as possible, even if most of it is garbage; the magic of stochastic gradient descent will separate the signal from the noise. If you choose aggressive filtering, you may have to go through dozens of epochs, and empirical results often turn out worse than using a larger dataset with lower average quality. In fact, considering that frontier models might overtrain by up to 100 times relative to the optimal standard set by Chinchilla, to minimize inference power used for reinforcement learning and deployment, the risks of aggressive data curation become even greater.
A possible analogy is the difference between sailing ships and container ships: container ships might not sail faster, but they can carry thousands of tons of cargo (equivalent to hundreds of trillion tokens of pre-training data) and are not overturned by rough seas (equivalent to stable training on hundreds of thousands of GPUs).
Having larger and sturdier container ships, we no longer need to worry much about what cargo to load; we can load everything that even barely seems useful. For the small and fragile sailing ships of 2019, you had to be extremely careful and only carry the most valuable cargo.
But if the essence of pre-training progress is just about loading more cargo onto this ship, are we running out of cargo? This raises questions about the data wall and to what extent synthetic data helps us cross this wall. Synthetic data has clearly been widely used in various laboratories, yet we haven't fully explored whether it effectively expands the data corpus without compromising model performance. If such benefits are limited, then the main driving force behind pre-training progress will stagnate, as we won't generate more internet content, and the extent to which a fixed dataset can be curated is also limited. It is important to note that we currently have no active reasons to believe this will be the case. However, considering how essential data seems to be for driving pre-training progress, this appears to be a key issue worthy of further investigation.
Ryan Greenblatt points out that many historical improvements in pre-training data corpora appear to be the type of progress that automated researchers could drive through empirical testing, such as running ablation experiments on models trained on different data to see how they perform. Therefore, this aligns perfectly with our results: if AI R&D were to become automated, the data advancements driving pre-training progress since 2019 could accelerate significantly.
We want to clarify that whether pre-training progress accelerates or slows down in isolation is not the most important question regarding overall AI progress, as many of the benefits seen in the past two years come from reinforcement learning.
Future Research Directions
Here are some future research directions and questions that we think will be cool and important:
- You can conduct this experiment on a larger scale to see if data or model improvements depend more on scale, thereby having a greater impact in frontier areas.
- How much marginal value does high-quality new data have in both pre-training and post-training, measured by final capability?
- We want to roughly understand the actual effects of synthetic data. A specific question worth investigating is: if you have a small batch of high-quality data and amplify it through synthetic data generation, how much better does it perform compared to direct multiple rounds of training on this batch of data?
- You can estimate the implicit value of data by examining the ratio of laboratory expenditure on data brokers, environment producers, etc., relative to computing power and researcher expenditure.
We want to study the role of data in driving AI progress. There are many other methods to explore this question, some of which may be more clever and informative than ours. Moreover, our experimental scale is very small. We truly believe we may have missed something and are very curious about how others would investigate this problem, and it would be great to see their results!
Sincere thanks to Charlie O'Neill for many insightful discussions.
Appendix: Methodology
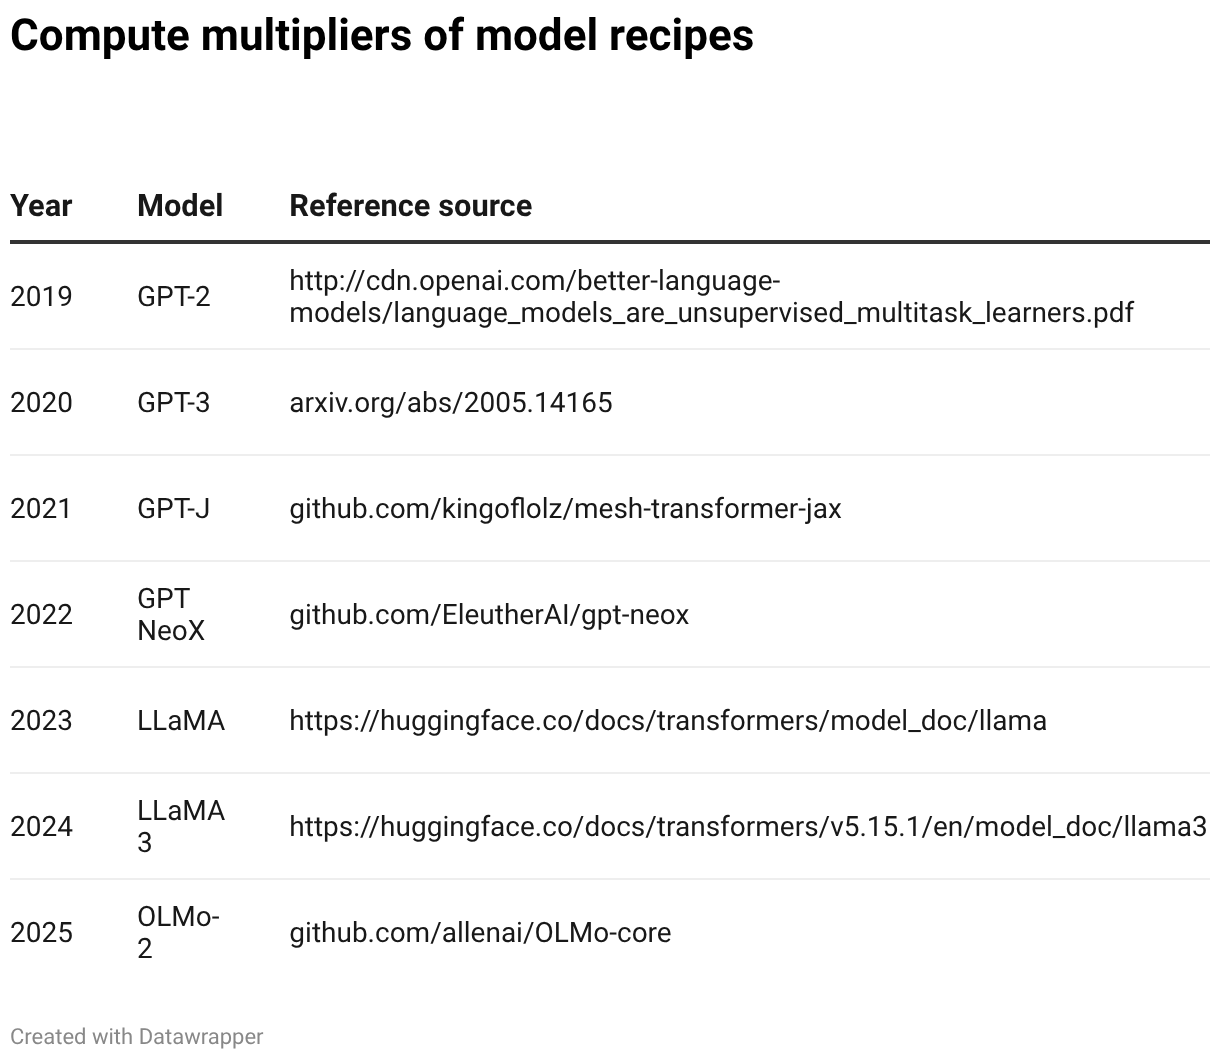
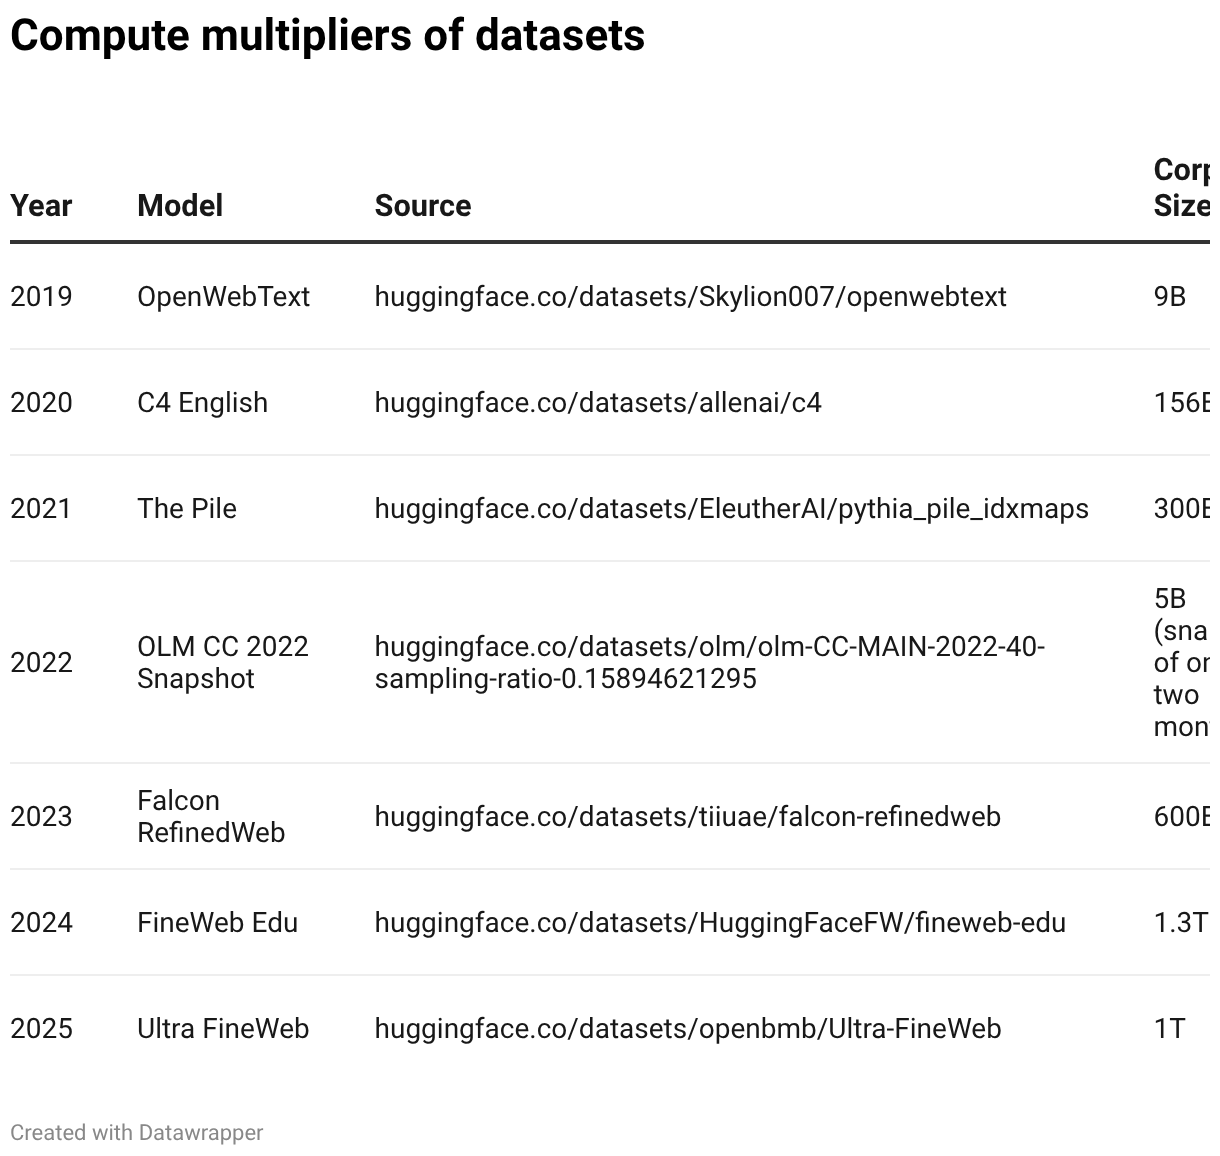
We pre-trained these model formulations from scratch on different data corpora using different computing power budgets and set multiple independent seeds. Our computing power budgets are: 1e17, 3.16e17, 1e18, 3.16e18, and 1e19 FLOPs. The convention for calculating computing power is using nominal computing power C = 6ND (N is the number of non-embedded parameters, D is the number of data tokens).
At each computing power budget, we adjusted the parameter count to adjust the number of tokens trained, in order to determine the optimal distribution of computing power for each training formulation and corpus combination. We used the loss on the withheld data to determine this computing power optimum point. We then obtained the computing power scaling curves for downstream performance for each combination, from which we extracted the computing power multipliers.
We enforced the use of a shared tokenizer and context length throughout all runs: GPT-2 BPE (tiktoken, 50257 vocabulary) and T=2048, batch = 262144 tokens.
The final capabilities of our training runs highly depend on hyperparameters. Clearly, it's impossible to traverse all possible hyperparameter combinations, and hyperparameter tuning is indeed a fine art! We tried to control for this and treated the peak learning rate as the main key hyperparameter.
Some algorithm versions indeed provide norms for what slope the peak learning rate should be adjusted to as a function of other relevant variables (such as model size, data budget, batch size, etc.). These offered us good priors in judging the optimal learning rates.
We first scanned the learning rates at 5 anchor points: three different model sizes and two different D/N ratios. We determined the optimal learning rate for these anchors and fitted the optimal learning rate parameter forms.
For all model formulations except OLMo-2, we fit a common exponent a and b, along with a model-specific lr₀. For OLMo-2, we used the optimal learning rate specified for that model formulation. We treated OLMo-2 this way because Ai2 published small model ladders as part of the formulation, specifying the optimal hyperparameters for the scale we studied. We also validated that our production learning rate is at or near optimal at the computing power optimum of 3.16e18 FLOP.
Main Technical Results
Explaining Some Anomalies in the Plots
We observed that, across both dimensions of models and data, computational efficiency generally improves over time, which is expected. Some anomalies we observed:
- NeoX performs worse than GPT-2 at 1e19 (despite performing better in the range of 1e17 to 3.16e18). This could stem from noise in the OLMES evaluation. We also noted that NeoX performed better than GPT-2 on the withheld pre-training loss of the FineWeb-Edu corpus.
- The performance of The Piles seems much worse than OpenWebText. This is not surprising, as the main improvement of Pile was in data corpus diversity rather than filtering. It has a carefully curated mix of 22 sources, including PubMed and arXiv papers, GitHub code, legal opinions, patents, and parliamentary records. For many of these tokens, the cross-domain transfer to OLMES (English network prose multiple-choice questions) may be minimal, leading to lower computational efficiency. We noted that due to the larger scale, we expect Pile to eventually outperform (very small scale) OpenWebText at larger scales.
- It is also worth noting that the computing power multipliers for NeoX and Pile were obtained through extrapolation, introducing additional potential errors.
How Computing Power Multipliers Are Calculated and Their Error Bounds
- Each point on the computing power scaling curve comes from multiple independent seed training runs. The error bounds there are the standard deviation of the OLMES evaluation over these seeds.
- Consider the reference performance level of a given reference model or data corpus at a specific computing power level.
- We then calculate the computing power multiplier for the candidate by finding the leftmost point on the computing power scaling curve for the candidate that first reaches that reference performance level. The ratio of the power required for the reference to the power required for the candidate is the computing power multiplier for the candidate.
- The error bounds for the computing power multiplier come from bootstrap resampling of parameters across the entire estimation process, yielding a 1 standard deviation interval.
- We want to emphasize that we expect the actual uncertainty of the model formulation's computing power multipliers to be higher than what the error bounds indicate. This is due to the limited range over which we conducted hyperparameter tuning, while final capabilities or withheld losses may be quite sensitive to the exact choices of peak learning rate, batch size, etc.
It is also important to note that our ablation experiments have many reasons why they cannot fully capture the entire range of efficiency gains in computational power. In fact, from 2019 to 2025, we observed a year-on-year computational efficiency improvement on the model side of 1.24 times [1.19, 1.29], and on the data side of 1.51 times [1.45, 1.57]. When measured jointly, we observed a year-on-year computational efficiency improvement of 1.57 times [1.49, 1.65]. This is indeed far lower than Anson Ho et al.'s year-on-year average estimate of 3 times, for the following reasons:
- Many benefits may rely on scale or be particularly important over longer contexts, and our operation scales are too small to reflect many of those gains. For example, the layer norms and QK norms of OLMo-2, parallel attention plus MLP blocks in NeoX.
- Inference efficiency optimizations (like the GQA in LLama-3, which is a KV caching optimization) will not show up as computing power multipliers in our study. We also did not study improvements in tokenizers.
- The computing power multipliers we obtained are quite sensitive to the model formulations or data corpora we selected each year. We chose what we considered to be representative model formulations or data corpora. But these do not exhaustively prove that these are the best for every year.
- We focused on computing power multipliers relative to the OLMES benchmark (which combines 10 relatively simple task types), rather than computing power multipliers for achieving a particular perplexity metric. If we look at other benchmarks (like coding or question-solving specific benchmarks), the numbers could differ significantly; those benchmarks might reward entirely different data engineering approaches.
We also want to point out that we did not investigate other improvements on the data side, such as collecting more high-quality data from new sources, data generated by human experts, synthetic data generation methods, etc. Most of the corpora we studied are curated subsets of the same Common Crawl, not extended available data sets. This clearly consumes a limited stock, and the degree to which this leverage can advance is limited.
Independence of the Gains from Model Formulations and Datasets
We conducted the following investigation to determine how independent the gains from model formulations and datasets are. We looked at the OLMES score grid under 3.16e18 FLOPs. Conducting a linear regression on the OLMES score, the model is OLMES score = mean + model effect + data effect, resulting in an R-squared of 0.88. This means that 88% of the variance in OLMES scores can be explained by the additive effects of model and data improvements, with only about 12% of the variance coming from interaction terms or higher-order terms, as well as assessment noise. This suggests that complex interactions between models and data (i.e., leveraging a certain model improvement depends on a certain specific data engineering, or vice versa) are relatively small.
Anson Ho et al. estimate that software efficiency improvements (in pre-training) are three times per year (95% confidence interval: 1.5 times to 64 times). As Ho mentioned in this blog, "most software advancements may actually come from data quality improvements," as well as "expansions from a few algorithmic changes related to scale."
We use C = 6ND as a nominal convention for calculating computing power.
The model formulation in 2019 was GPT-2, and in 2025 it was OLMo-2. The dataset in 2019 was OpenWebText, and in 2025 it was UltraFineWeb.
The GPT3 we implemented encountered some training instability problems (gradient spikes) on the Pile.
These include: optimizer improvements, warmup with decay scheduling, replacing absolute positional learning with RoPE, RMSNorm with SwiGLU gated MLP, norm rearrangement, QK-norm, Z-loss regularization, and cleaner initialization.
For the computing power scaling plots, we used at least 3 seeds for each. For the 7x7 grid of model formulation and dataset combinations under a budget of 3.16e18, we used only 1 seed each.
The year-on-year multiplier of 1.57 was calculated using the joint improvements from the 2019 model and corpus to the 2025 model and corpus, rather than the product of the model side improvement of 1.24 times and the data side improvement of 1.51 times.
免责声明:本文章仅代表作者个人观点,不代表本平台的立场和观点。本文章仅供信息分享,不构成对任何人的任何投资建议。用户与作者之间的任何争议,与本平台无关。如网页中刊载的文章或图片涉及侵权,请提供相关的权利证明和身份证明发送邮件到support@aicoin.com,本平台相关工作人员将会进行核查。


