Author: Gemini, Deep Tide TechFlow
The current market has moved out of the old coin speculation phase, with some altcoins experiencing a long-awaited rise.
What has established this overall tone is, of course, BTC returning to the 80,000 mark.
Looking back, in mid-August, Bitcoin rose 24.6% in just five days, marking the largest weekly gain during the past two years of correction. In face of such a significant market breakthrough, market inertia often attributes it to new macro funds entering or a full resurgence of bullish sentiment.
However, the situation is not that simple. The current crypto market's driving force still comes from existing positions, especially from the contract market.
Recently, Glassnode and Bybit jointly released a report on the crypto derivatives market, which pointed out that the true driving force behind this rebound was not the incremental bullish position building, but a passive "short squeeze" dominated by short liquidations.
Through the data cross-section of the derivatives market, we can clearly restore the operational mechanism behind this rebound.
When BTC price rises while leverage retreats
In traditional trading logic, a unidirectional bullish market usually accompanies simultaneous active leverage expansion. However, the data during the five days of BTC's rise in August presented a completely contrary shape.
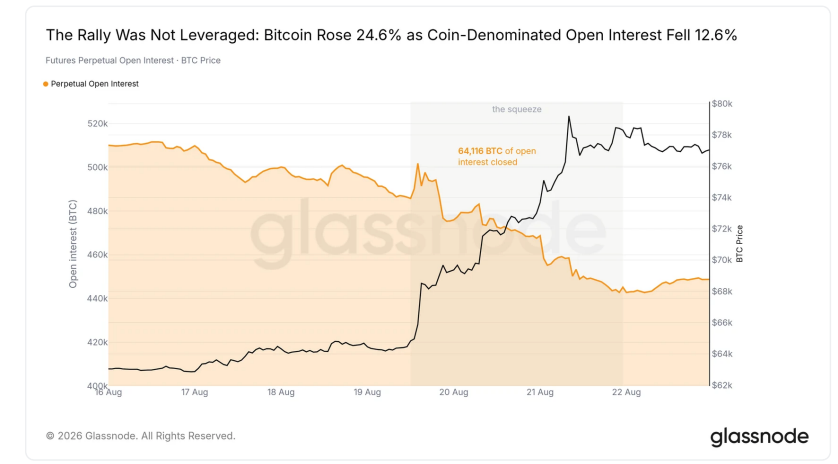
The report pointed out that within the range where Bitcoin's spot price climbed 24.6%, the open interest (Coin-Denominated Open Interest) in Bitcoin terms not only did not increase but actually decreased by 12.6%.
Open interest is a core indicator measuring the active leverage in the market. When prices rise while this indicator decreases, it implies that the primary force pushing prices upwards is not traders actively opening long positions (increasing leverage), but rather a significant number of existing positions being liquidated. The derivatives market characterizes this event as a pure price reassessment (Repricing), rather than leverage expansion (Releveraging).
Shorts contributed 89% of the liquidation liquidity
If there were no new bullish funds, who was buying? The answer is forced liquidation of short positions.
Decrypt cites data in its report indicating that during this market trend, approximately 64,000 BTC worth of open contracts were wiped out across the network. Among them, as much as 89% of the liquidation funds came from short positions.
When short accounts hit the force liquidation line, the liquidation engine will forcibly issue market buy orders to calm the positions.
In a relatively thin liquidity market environment, this mechanism can easily trigger a chain reaction: passive liquidation buy orders push prices up, subsequently triggering more short liquidations. During these five days, the stop-loss orders from shorts themselves became the core liquidity fuel for pushing BTC spot and contract prices upwards.
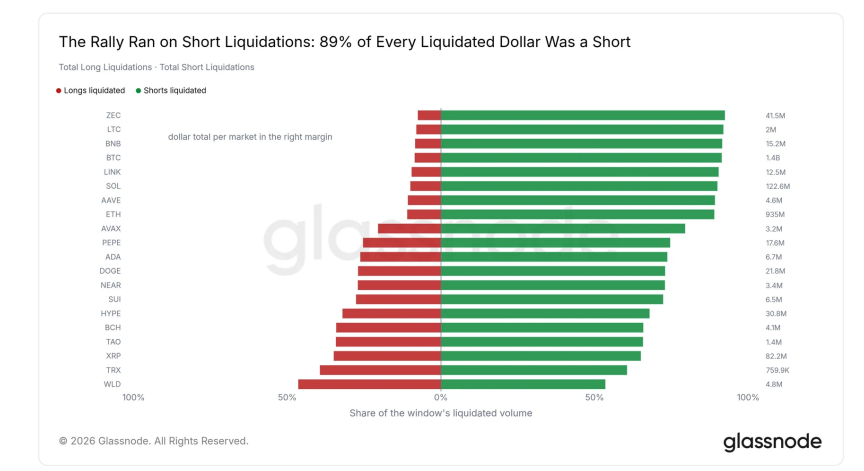
(Caption: It can be seen that the green in the chart represents the short liquidation at that time, significantly higher than the longs)
Options market: Ending a 361-day "bearish bias" in a single day
The drastic fluctuations in the spot and futures markets quickly transmitted to the options market, breaking a nearly year-long pricing inertia.
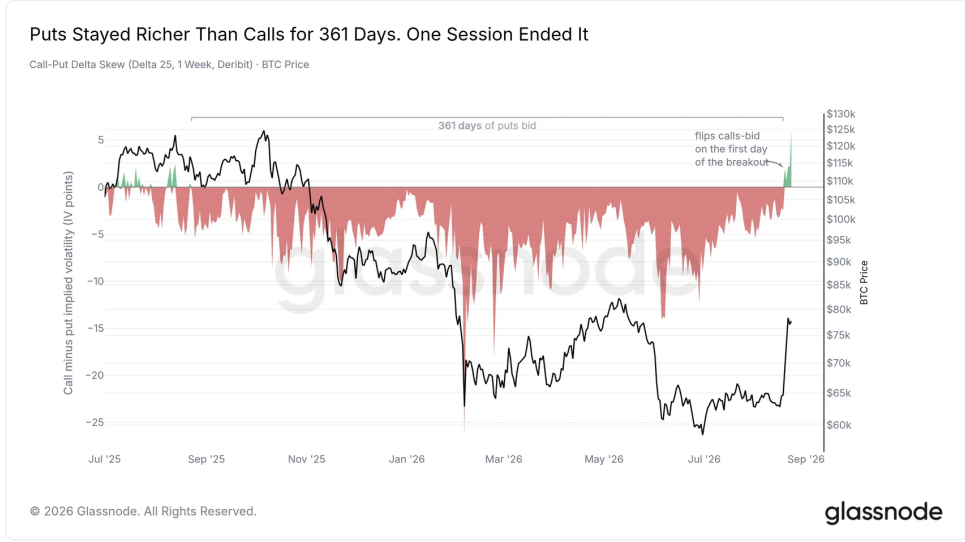
Out of caution against downside risks, options traders had been willing to pay a premium higher for put options than call options for a long span of 361 days. However, on the day when the breakout occurred in August, this long-term "bearish bias" was completely reversed within a single trading day, with the implied volatility of call options regaining dominance.
Accompanying this reversal, Bybit's implied volatility index (DVOL) recorded an 8-point amplitude in a single day, equivalent to four times the standard daily fluctuation range of the index.
The market completed a repricing of risk with extreme volatility.
Institutional pricing: Short-term impact rather than trend reversal
Despite the substantial rebound and the reversal of options bias, professional institutions and market makers did not view it as a signal of a full return to a bull market. This judgment is reflected in the changes in the volatility term structure.
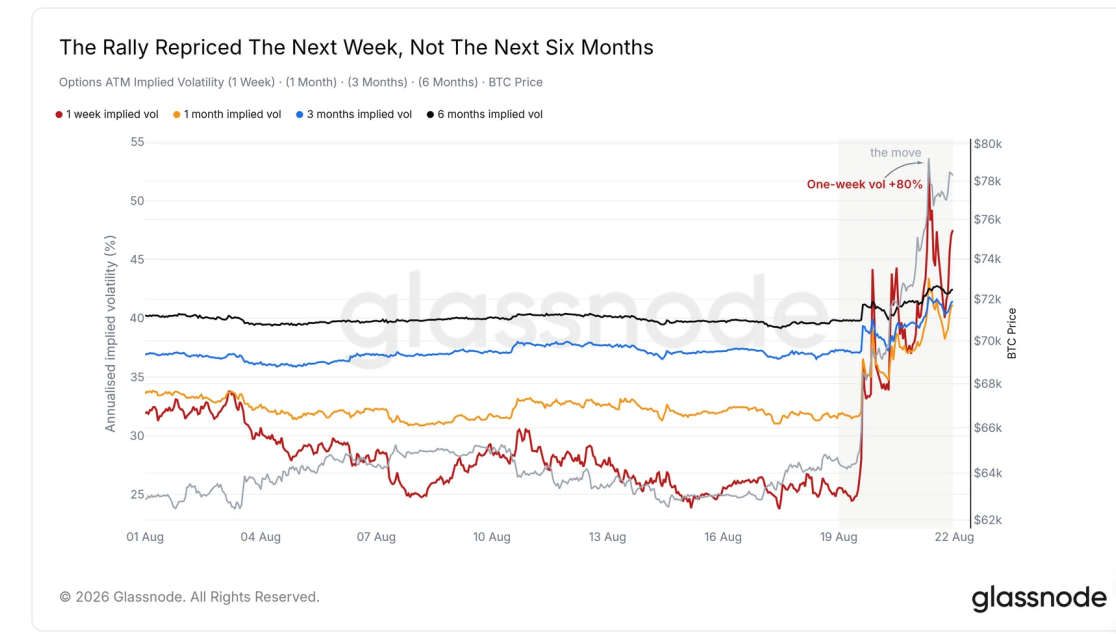
Data indicates that during the price uplift period, the implied volatility of near-term options with a one-week expiration surged by 80%, while the implied volatility of three-month and six-month long-term options remained basically unchanged.
The sharp reevaluation of the near-term curve and the unchanged far-end imply that the options market strictly priced this 24.6% increase as a short-term liquidity liquidation event.
The market digested the short-term shock caused by the overcrowding of shorts, but did not form a sustained bullish expectation for the medium to long-term trend in the next six months.
Therefore, overall, the rise in BTC in August is a typical textbook example of existing position games.
In today’s landscape, where derivatives, especially options, are gradually occupying a half share of the crypto market, drastic price fluctuations often do not require substantial macro positives. When the leverage distribution is extremely imbalanced, the market's own clearing mechanisms, such as concentrated liquidation counterparty, are enough to create the strongest weekly trend in two years.
免责声明:本文章仅代表作者个人观点,不代表本平台的立场和观点。本文章仅供信息分享,不构成对任何人的任何投资建议。用户与作者之间的任何争议,与本平台无关。如网页中刊载的文章或图片涉及侵权,请提供相关的权利证明和身份证明发送邮件到support@aicoin.com,本平台相关工作人员将会进行核查。


