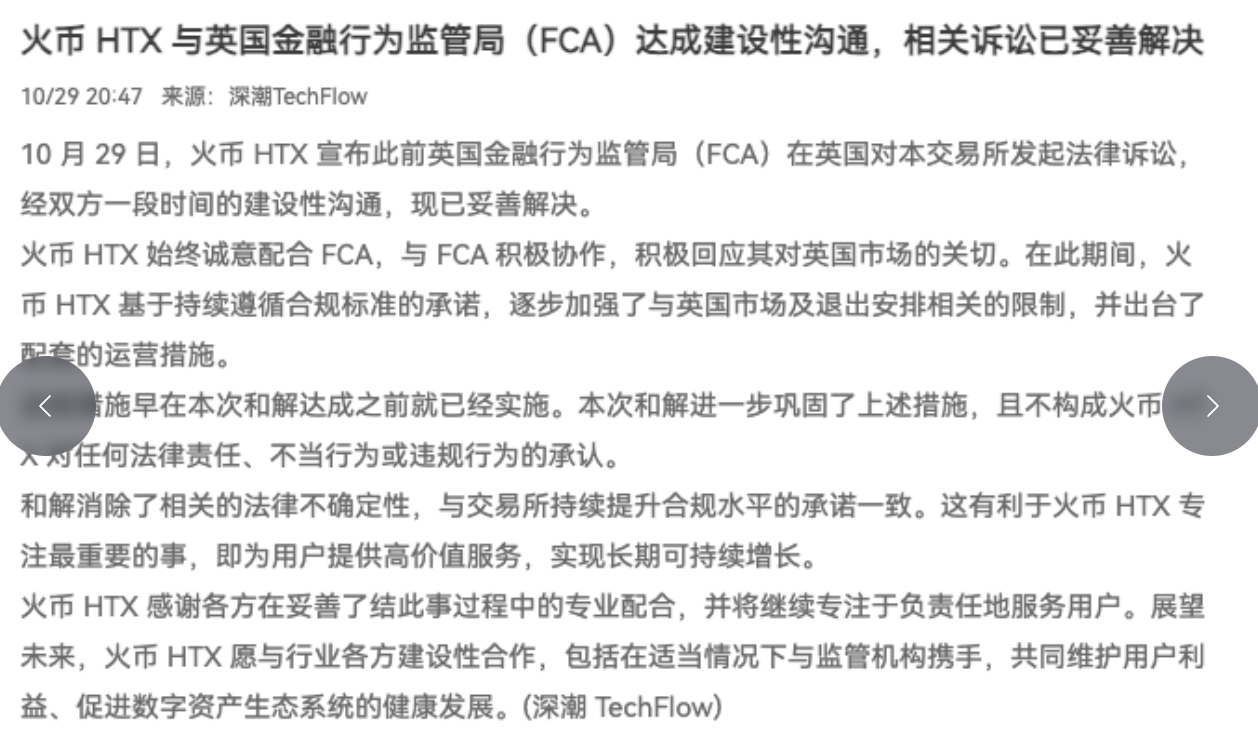
Dear teammates, the market situation this morning does not need much elaboration, as two significant news items have driven market sentiment to a freezing point. The first news is that Binance's hot wallet was hacked for $6.3 billion, which is the largest exchange theft in history. Although 80% of the funds have been replenished and withdrawals were restored within 34 hours, the short-term panic selling and capital outflow are quite real. The second piece of news is that Federal Reserve official Musalem has clearly stated, "There may be a need to raise interest rates again soon." This, combined with the NASDAQ dropping 3% and the Philadelphia Semiconductor Index falling over 8%, has caused risk assets to plummet, leading the crypto market to follow suit. In the last 24 hours, nearly $1.6 billion was liquidated across the network, with over 240,000 people being cleared, primarily long positions. However, interestingly, BTC only dropped about 3% under these dual shocks, and CZ was even amazed at its resilience against declines. Is this a sign that the bottom is nearing, or is it calm before the storm? Sister Qinglan will explain it clearly using the TPV system.
Current price and time
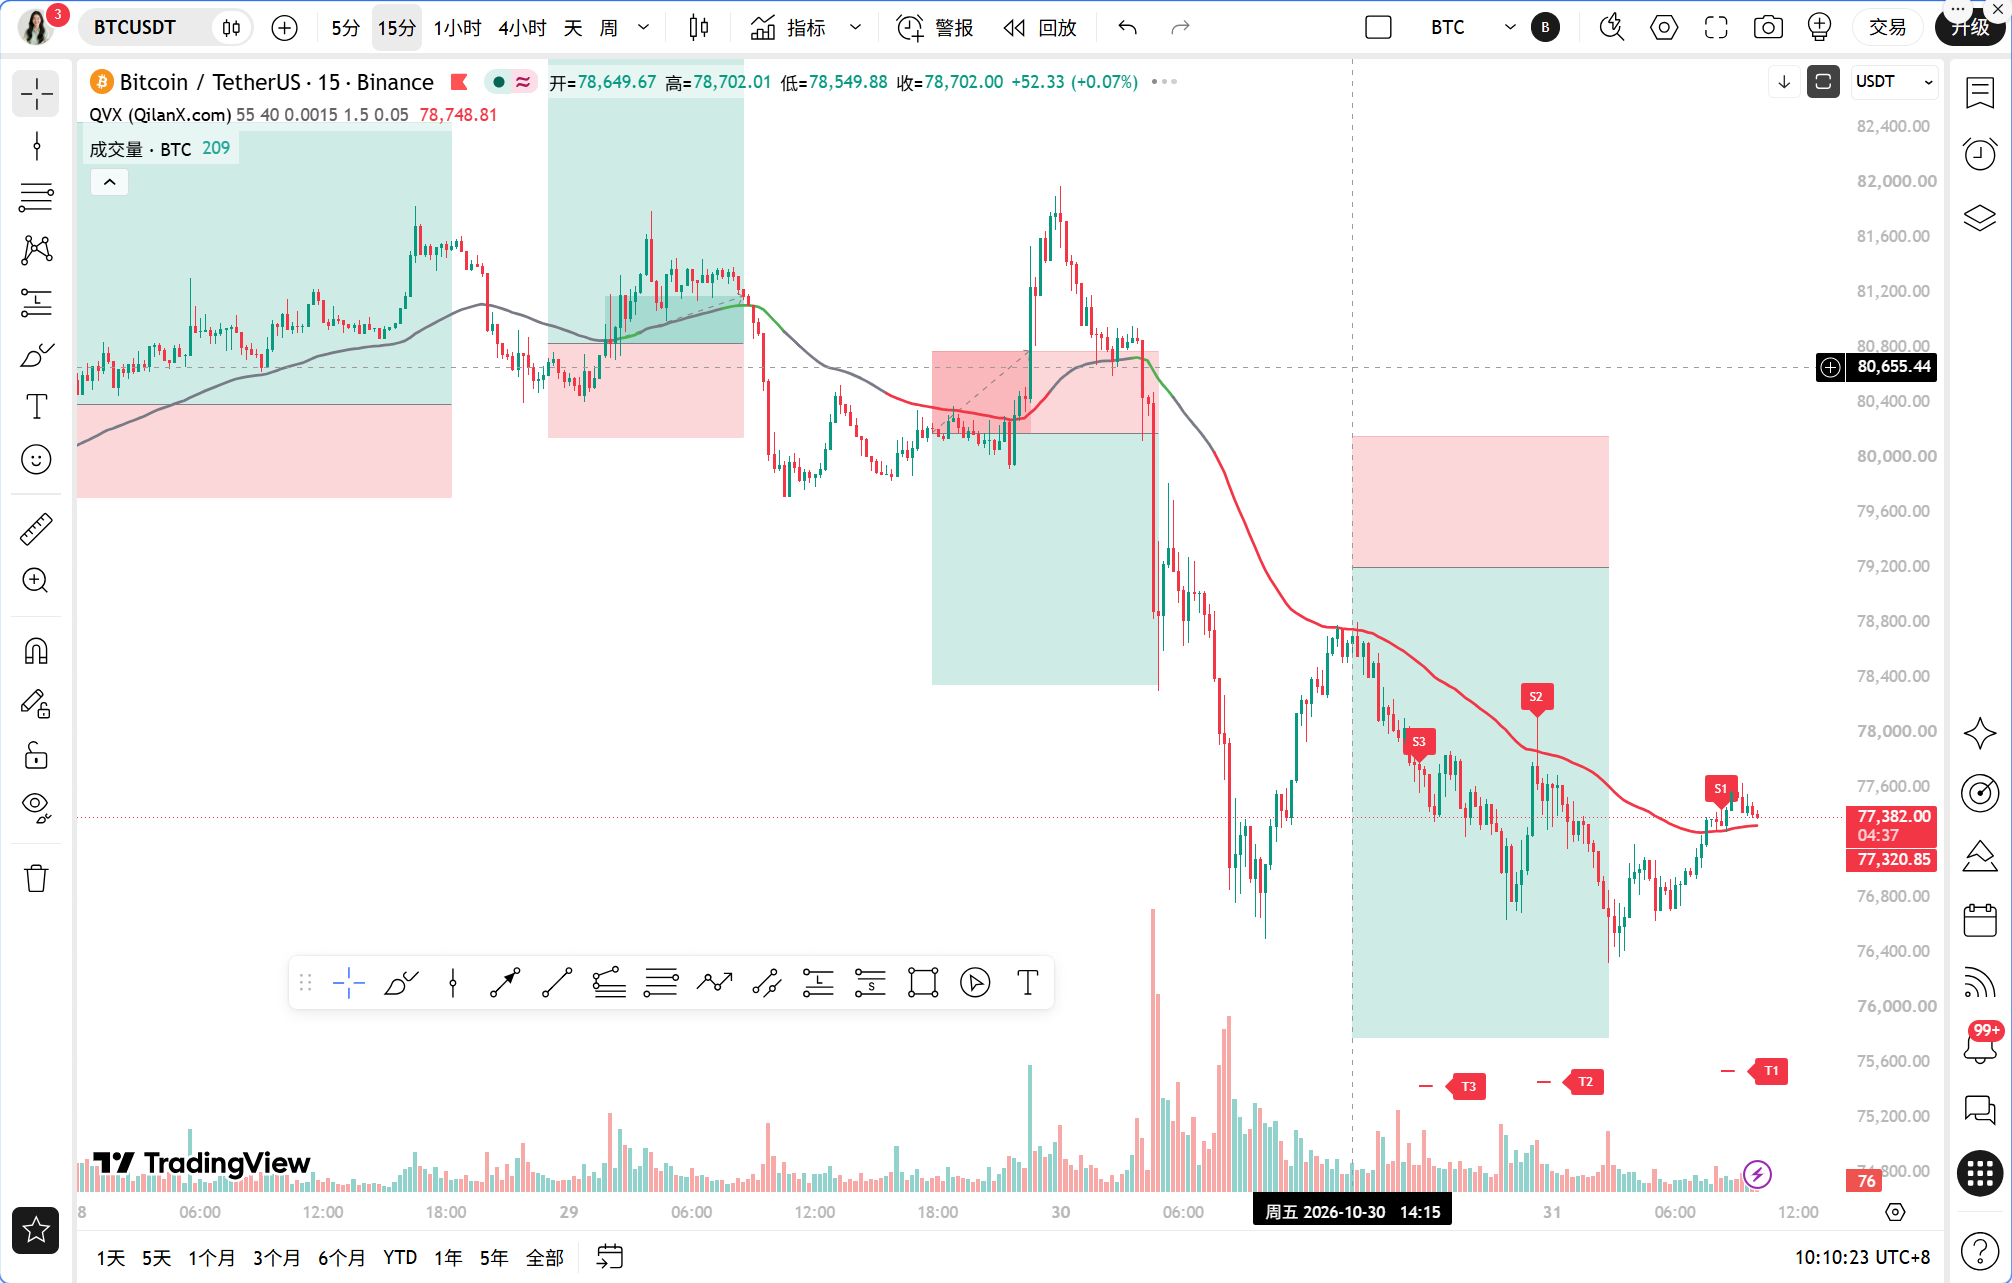
The current time is October 31, 10:08, with the BTC price at 77,412 USDT, a 24-hour change of 0.89%, and a market share of 59.2%. The Fear and Greed Index is at 30, indicating a fear zone. Note that although the price has slightly risen, this rebound is a corrective reaction following massive liquidations and theft events, and sentiment remains fragile.
Multi-cycle status overview
First, let's look at the daily chart. MA5=79,005.18, MA10=79,882.42, MA30=82,121.52, with the moving averages in a bearish arrangement, and the price below all moving averages. The MACD values are DIF=-1,060.73, DEA=-533.12, and Histogram=-527.61, indicating that negative values continue to expand without signs of a golden cross. RSI=33.16, close to oversold but not yet below 30. The overall daily chart shows a clear bearish trend, with limited rebound strength.
Next, let's look at the 4-hour chart. MA5=77,345.46, MA10=78,376.61, MA30=79,786.47, the price is struggling near MA5, but MA10 and MA30 provide multiple layers of resistance. The MACD values are DIF=-918.29, DEA=-630.48, and Histogram=-287.81, also functioning in negative territory. RSI=28.96, has entered the oversold zone. The bearish momentum at the 4-hour level is sufficient, but being oversold indicates a short-term rebound demand, with the key being whether the rebound can hold.
The 1-hour level is the core of the TPV system. MA5=77,345.18, MA10=77,118.20, MA30=77,615.71, with the short moving averages beginning to flatten and converge. The MACD values are DIF=-398.31, DEA=-532.11, and Histogram=133.80; note this Histogram is positive, indicating that the bearish momentum at the 1-hour level is waning, showing signs of repair. RSI=49.01 is in a neutral position. However, the critical boundary EMA55=78,565.68, with the current price at 77,412, is 1.47% away from EMA55, operating below it.
15-minute level. MA5=77,447.09, MA10=77,428.56, MA30=77,074.24, short moving averages in a bullish arrangement. MACD values are DIF=107.93, DEA=79.49, Histogram=28.44, functioning positively. RSI=71.55, close to overbought. The 15-minute chart indicates a short-term rebound structure, but the high RSI warrants caution in chasing long positions.
TPV signal validation
According to the core rules of Qinglan's TPV system, the 1-hour EMA55 serves as the boundary between bullish and bearish. The current price of 77,412 is less than EMA55's 78,565.68, clearly indicating it is in a bearish trend zone.
Long conditions validation: First, the price must stabilize above the 1-hour EMA55, requiring two consecutive 1-hour closing prices to be above EMA55. The current closing price is near 77,400, still needing over 1,100 points to reach 78,565, which does not meet the requirement. Second, a support stabilization pattern, with the 15-minute chart showing a short bullish arrangement; however, the 1-hour level lacks clear signals of long lower shadows, bottom formations, or volume accumulation stagnating at lows. Third, there is a depletion of bearish momentum, with a positive 1-hour MACD Histogram of 133.80, which is indeed shortening, and RSI has risen from a low to 49, partially meeting this condition. But all three must be satisfied simultaneously; currently, only one condition is met, and the long conditions are not established.
Short conditions validation: First, the price is pressured below the 1-hour EMA55, with two consecutive 1-hour closing prices below EMA55; this is satisfied, as the last 8 closing prices above EMA55 are 0/8, with 0 crosses, and the price consistently remains below EMA55. Second, a pressure obstruction pattern, with the 4-hour and daily moving averages providing multiple layers of resistance, the 1-hour MA30=77,615.71 is forming short-term pressure above; however, there has not yet been a clear long upper shadow or top formations at the 1-hour level. Third, weakness in rebounds, with the 1-hour MACD Histogram being positive, but both DIF and DEA are below the zero line, belonging to a corrective rebound in a bearish trend, and the 15-minute RSI=71.55 is close to overbought, posing a risk of a pullback. The short conditions are satisfied by the first and third points, with the second point requiring observation of the resistance performance around 77,615.
Fluctuation assistance data is crucial. In the past 8 1-hour candles, the count of closing prices above EMA55 is 0/8, with 0 crosses. The current price's absolute distance from EMA55 is 1.47%, far exceeding the 0.3% fluctuation threshold. The system determines that it does not meet fluctuation conditions, remaining in a unilateral trend, which signifies a clear bearish trend. This aspect is very important, indicating that one should not easily attempt to pick a bottom, as the force of the trend still lies on the bearish side.
On-chain/Funds situation
The Fear and Greed Index is at 30, in the fear zone, indicating a pessimistic market sentiment, but not yet at the extreme fear level for bottom buying. BTC's market share is at 59.2%, with funds concentrating on BTC, while altcoins are under pressure. On-chain, the Binance wallet has seen an outflow of $5.6 billion and has frozen $2.3 billion in stablecoins, with short-term liquidity indeed under pressure; however, Tether's third-quarter reserve assets total $191.5 billion, and its excess reserves have doubled to $7.95 billion, showing stable stablecoin reserves, which is a supporting factor for liquidity. An interesting signal from the options market is that large traders are focusing on buying put options for $74,000 to $78,000 for hedging, indicating strong negative expectations among institutions in the short term. This also means there are large hedging positions near $78,000, and once the price stabilizes, short covering could trigger a rebound. Additionally, trader Killa suggests that the stolen event may mark a market bottom, and CZ is also amazed at BTC's resilience against declines, which are potential turning signals for sentiment, but price confirmation is required.
Key Attack and Defense Levels
The first pressure point above is the 1-hour MA30 at 77,615.71, which is the first hurdle for short-term rebounds. The second pressure point is at the 4-hour MA10 at 78,376.61; more critically, the 1-hour EMA55 at 78,565.68 serves as the boundary line for the TPV system. Only when the price rises above and stabilizes with two consecutive closing candles above this line could it indicate a possible trend reversal. The first support point below is the 15-minute MA30 at 77,074.24, and the second support point is the previous low at the integer level of 77,000. If it breaks below 77,000, the next target would be the range of 74,000 to 75,000, which is also where the put options are concentrated.
Trading Ideas
Direction: The current TPV system determines that it is in a bearish trend zone; the main idea is to go short on rebounds without actively picking a bottom.
Entry Condition: Wait for the price to rebound to between 77,615 and 78,376, which is between the 1-hour MA30 and the 4-hour MA10, then observe whether the 1-hour candles show a long upper shadow or top formations, while the 15-minute RSI falls back from the overbought zone, and the MACD Histogram begins to shorten. Enter once three short conditions are satisfied. If the price directly breaks below 77,074 and confirms with a 1-hour close, one can follow the trend to go short, but with a light position.
Stop Loss: Set the short stop loss above the 1-hour EMA55, around 78,600, because once the price stabilizes above EMA55, the bearish logic becomes invalid, and one must exit.
Target Levels: The first target is 77,074, the second target is the integer level of 77,000, and the third target is the range of 74,000 to 75,000. The risk-reward ratio calculated based on an entry at 78,000, stop loss at 78,600, and first target at 77,074 is about 1.5:1, and about 5:1 at the third target, making it worth waiting for a good entry point.
Risk Warning
If there are fund recoveries or regulatory good news following the Binance theft, it could trigger a rapid rebound due to short covering; strictly adhere to stop losses and avoid holding losing positions.
Follow Qinglan's Crypto Classroom to seize more trading opportunities together! Welcome to visit our official website www.qinglan.org
📊 Qinglan TPV Trading Strategy Backtest Reference
🕒 Last Backtest Time: 10-31 07:00:02
Total Analysis: 4781 Backtests: 4772 Accuracy Rate: 77% (3674/4772)
免责声明:本文章仅代表作者个人观点,不代表本平台的立场和观点。本文章仅供信息分享,不构成对任何人的任何投资建议。用户与作者之间的任何争议,与本平台无关。如网页中刊载的文章或图片涉及侵权,请提供相关的权利证明和身份证明发送邮件到support@aicoin.com,本平台相关工作人员将会进行核查。