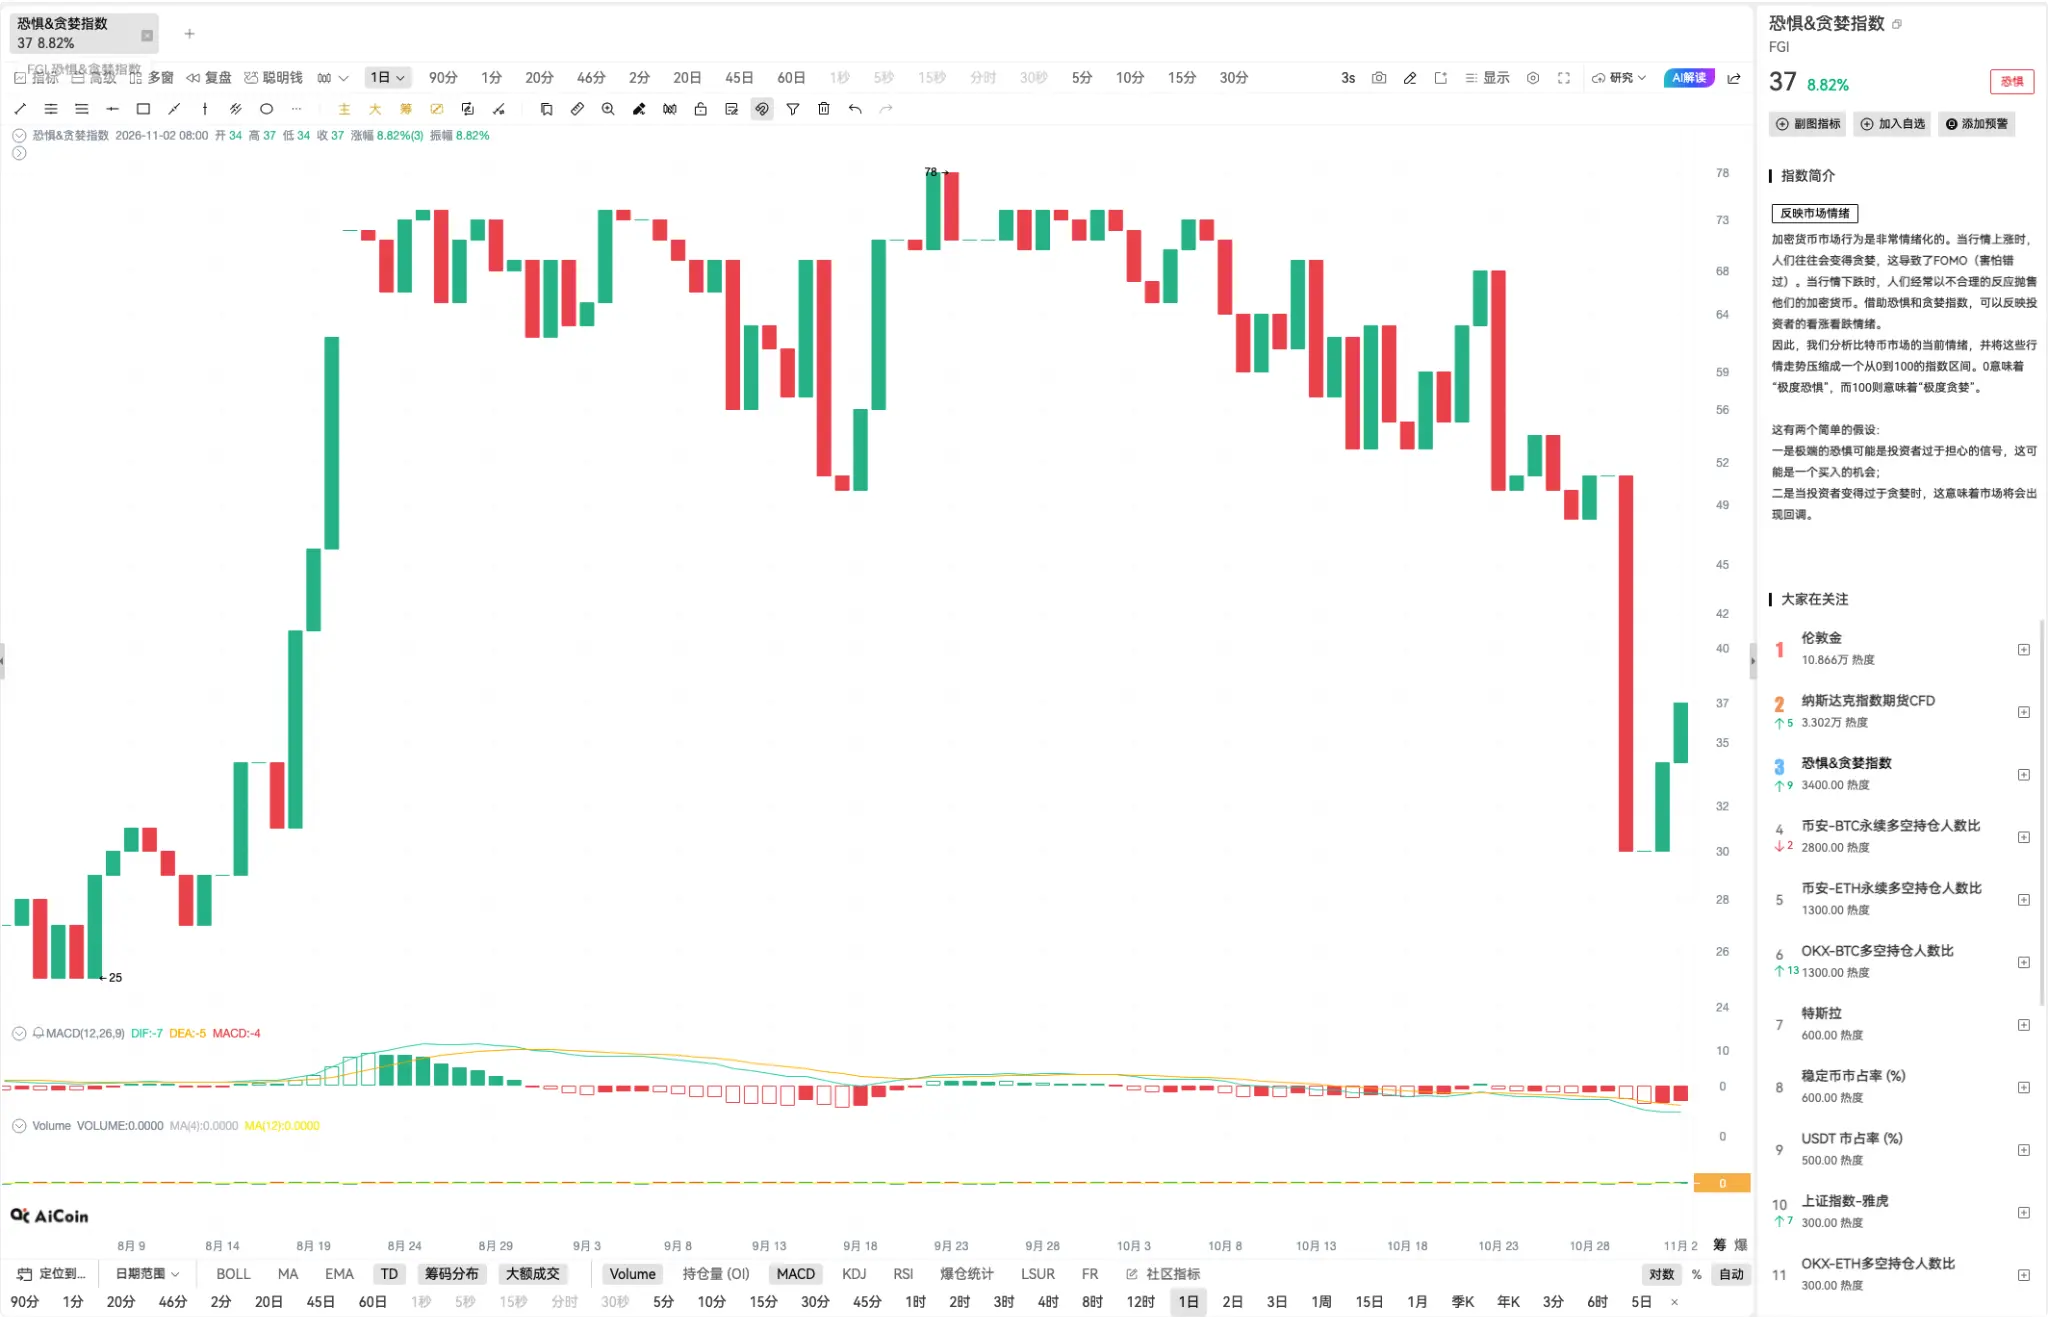
The Fear and Greed Index has risen from 34 to 37, an increase of about 8.82% in a single day. This is a sign of marginal improvement in sentiment, but it is not proof that market fear has ended, nor is it a buy signal confirming a bottom.
If the rise in the index is directly described as “fear has ended,” it conflates “direction has changed” with “state has reversed.” An index being higher today than yesterday can only indicate that the overall sentiment it measures has improved; to determine whether a trend has changed, we must also see if this improvement can last, and whether prices, volume, and market structure are giving supportive signals in sync.
This is precisely what needs to be clarified when facing the topic of “bottom fishing”: low prices are not a reason to buy, and rebounds are not proof of reversal. What truly matters is not guessing a bottom, but establishing a plan that can be validated, executed, and can control losses in case of mistakes.
1. 37 is a change in sentiment, not a trend judgment
The latest reading of the Fear and Greed Index is 37, with the latest data showing an increase of 8.82% compared to before. The 8.82% here represents a relative change and should not be confused with an increase of 8.82 points in the index itself.
This information can support a cautious judgment: market sentiment may be recovering from a more pessimistic state. However, it is insufficient to support the claim that “the atmosphere of fear has ended.” According to index classification, 26-46 falls into “fear,” while 47-54 is “neutral.” Using this classification, 37 remains in the fear range, not the neutral or greed range.
More importantly, the Fear and Greed Index is not an “oracle indicator” independent of market prices. Its index is composed of factors such as Bitcoin volatility, market momentum and volume, social media, market dominance, and search trends; among these, volatility and momentum/volume each account for 25%. This means the index reading will be influenced by recent price and trading activity, reflecting an emotional state compressed from various market information, rather than a direct prediction of future prices.
This leads to an easily overlooked issue: after a price decline, sentiment can become fearful; after a price rebound, sentiment may recover. The index’s rise may be recording changes that have already occurred in the market rather than prematurely proclaiming the next uptrend. When we see “the index rose from 34 to 37,” all we can say is that sentiment data has marginally improved; we cannot jump to “market fear has ended, therefore a bottom has emerged.”
2. Sentiment indicators are valuable for reference, but cannot independently take on timing tasks
The Fear and Greed Index is worth paying attention to, not because it can accurately pinpoint a bottom, but because it provides a window to observe market behavior. Investors are easily influenced by emotions during extreme fluctuations: fear of missing out during an upswing and eagerness to exit during a downturn. Quantifying emotional changes can help readers identify which side the market is leaning towards and also remind themselves not to mistake collective sentiment for certainty.
However, “having reference value” and “being able to act on it alone” are two different things. Firstly, sentiment readings can be lagged and persistent. If prices have experienced significant declines, volatility rises, and the trading structure weakens, the index may continue to linger in the fear range; even if a short-term rebound occurs, sentiment may not immediately return to neutral. Conversely, extreme emotions may persist for a considerable time. A low index does not mean prices will stop falling immediately; a rise in the index does not mean the risk of decline has vanished.
Secondly, the index summarizes overall sentiment and does not equate to the actual state of every asset or trader. Even if Bitcoin sentiment improves, it cannot be simply inferred that all altcoins will strengthen in sync; the liquidity, capital structure, and risk exposure of different coins may vary greatly.
Additionally, different institutions’ “Fear and Greed Indexes” may not necessarily use the same set of algorithms. Even if the names are identical, the index sources, samples, and segmentation methods may differ, so when quoting figures, it should be clear which index is being referred to, rather than treating readings from different platforms as a single standard.
Academic research also reminds us that the relationship between sentiment and Bitcoin prices can change over time.
Therefore, a reading of 37 is best viewed as an observation signal: it suggests sentiment has improved compared to before, warranting continued monitoring; however, whether it has stabilized still requires cross-validation through price and trading behavior.
3. BTC price has rebounded, but why is it still insufficient to prove a trend reversal?
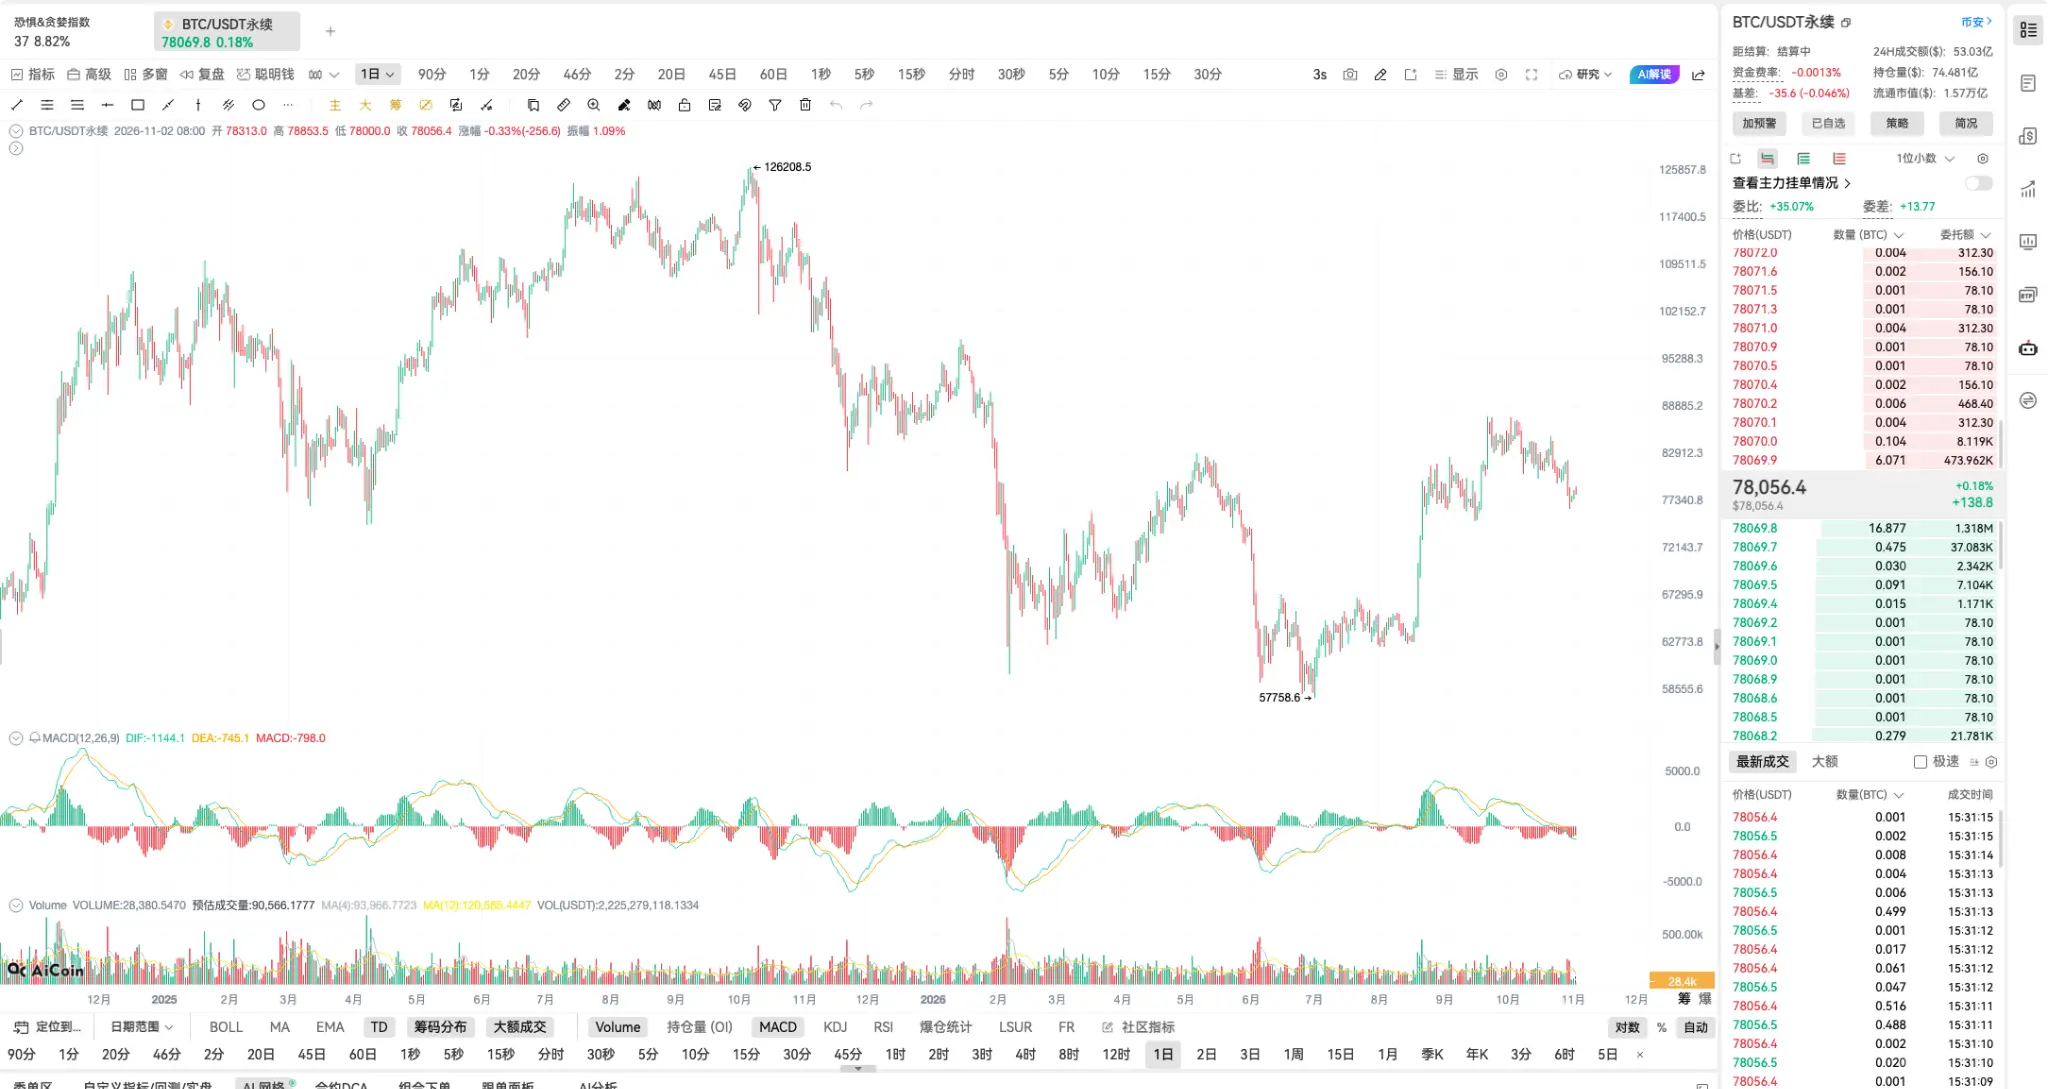
BTC/USDT data shows that prices have experienced significant volatility, with a rebound from lower regions, currently showing a price of about 80,056 USDT; the previous low marked in the chart is about 57,758.6 USDT. This indicates that prices have recovered from lows, serving as evidence that can be included in market repair analysis.
However, for a rebound to serve as evidence of a “trend reversal,” it must address at least three questions.
First, has the rebound changed the price structure? A single rise can only indicate that prices have bounced from a certain low point. A more convincing change occurs when prices do not easily fall below previous lows during pullbacks, subsequently forming higher lows; further still, prices must break through and hold previously key resistance areas. Without these structural changes, to merely claim “the bottom is confirmed” based on a rebound easily mistakes a repair during a downturn for a trend reversal.
Second, is there trading activity supporting the rebound? If trading volume and market participation do not significantly improve when prices rise, the sustainability of the rebound needs further observation. Conversely, if price repair coincides with improved volume and momentum indicators strengthening, it constitutes corroborating evidence. Indicators like MACD shown in the screenshots can assist in observing momentum changes, but no single technical indicator can replace price structure or eliminate uncertainty in the market.
Third, how does the market perform after the rebound if there is a pullback? Determining a bottom is not only about when prices rise, but also whether the market can hold the support areas that have formed during pullbacks. What is truly important is not just “how much has risen,” but also “during the pullback, has persistent selling pressure emerged” and “does buying still exist at lows.” If a rebound is quickly fully reversed, a brief rise in the sentiment index is hard to constitute strong evidence of trend improvement.
In other words, real-time data here does not negate the rebound, but rather limits conclusions to what the evidence can support: signs of market repair are emerging, but further validation is still needed.
4. How to turn “bottom fishing” from guessing price points into a verifiable plan?
The term “bottom fishing” can easily lead people to focus on finding the lowest price. But the market's lowest point only becomes clear in hindsight. A more executable approach beforehand is to reframe “I want to bottom fish” into a series of concrete questions: what changes must occur before considering the initiation of the first position? If prices continue to drop afterward, is there a subsequent plan? What is the maximum risk exposure? What signals indicate that the initial judgment has failed? Are multiple accounts using the same trading logic? Are the investment ratios of each account appropriate for their situations?
For example, traders can break their plans into multiple phases, each bound to self-defined conditions, rather than investing the entire planned amount all at once simply because they read that “the fear index has rebounded.” Conditions can stem from a combination of price structure, volume, and momentum, and may also include reassessments of market risk. Specific trigger conditions and capital ratios need to be decided by traders based on their own strategies; this article does not provide specific coin, buying price points, or position suggestions.
The value of phased execution is not in guaranteeing purchases at the lowest point, but in avoiding a single judgment determining the entire outcome. It still carries risks: the market may continue to decline rapidly after the first position, or it may rebound quickly, rendering subsequent plans impossible to execute as originally intended. Therefore, phased execution does not automatically equate to safety; the key is to define beforehand the purpose of each position, cumulative risk, and exit conditions.
When the same plan needs to be executed by multiple accounts, another issue arises: how to avoid repeatedly switching back and forth between accounts, re-inputting amounts, which increases operational burdens? This is where AiCoin’s multi-account order function can play a role.
5. Multi-account ordering solves execution coordination, not determining the bottom for you
The logic of AiCoin’s multi-account ordering is not to analyze market direction for users but to enable users to more conveniently manage multiple accounts and execute orders based on an already established trading plan. According to AiCoin’s functional introduction, users can select multiple API accounts on the order panel and set up follow-up or allocation methods as needed; the page also describes coordination in placing orders across multiple exchange accounts.
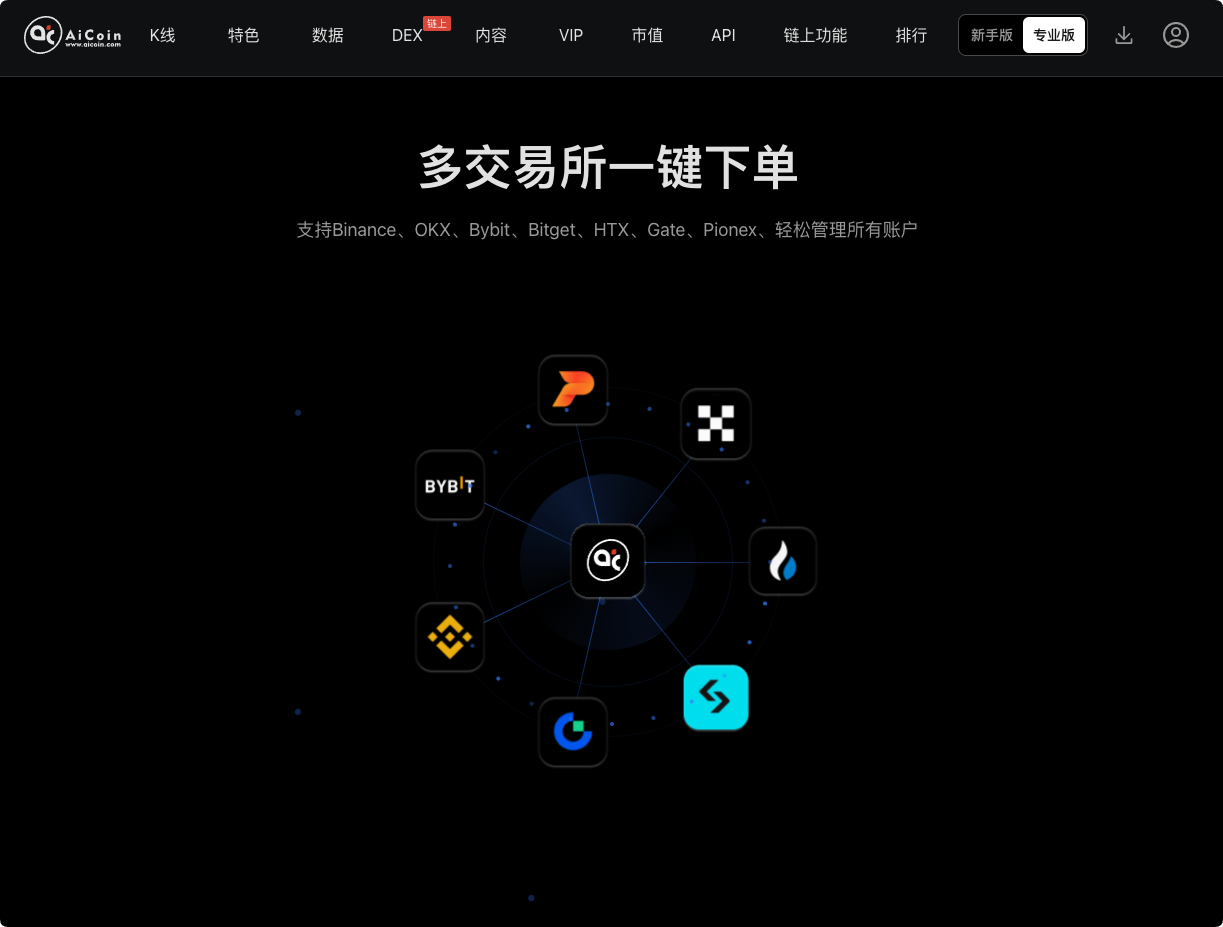
The follow-up mode is suitable for scaling the order quantity based on account ratios. The main account inputs the base quantity, while other accounts execute according to preset multiples. Assuming clear ratio arrangements exist between accounts, the follow-up mode can reduce the repetitive input operations across accounts.
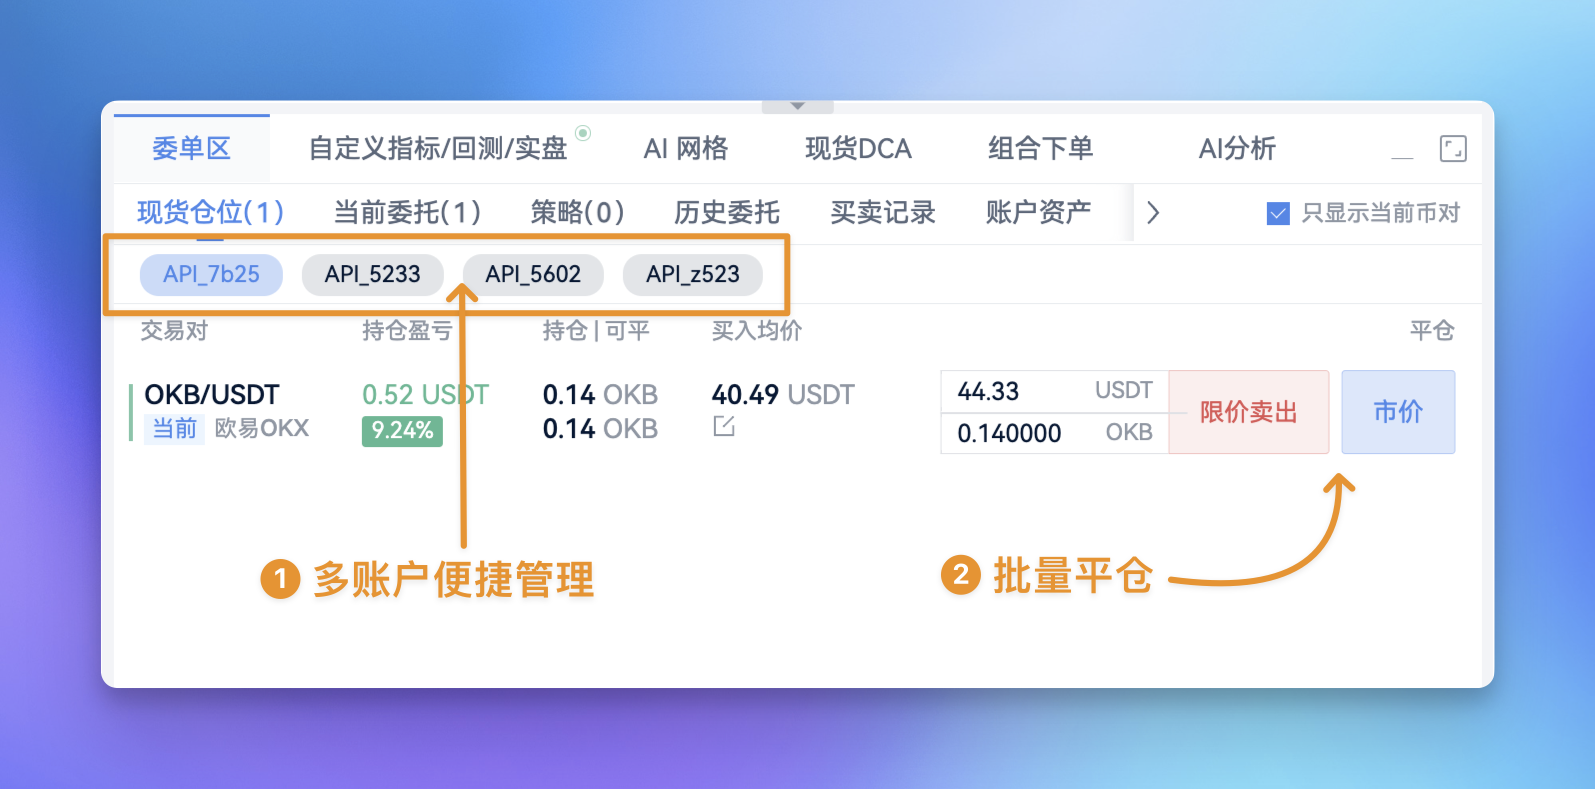
The allocation mode is suitable for first setting a total order quantity for multiple accounts, then distributing it according to account ratios. For example, if a user wants to control the total execution amount across multiple accounts rather than having each account place the same number of orders, they can organize orders through allocation ratios.
When combined with phased plans like “bottom fishing,” the correct order should be: first determine whether entry conditions are met, then identify which accounts will execute the current plan and the proportion each account will bear, and finally use tools to complete the synchronized operation. It should not be reversed, as it’s convenient to use tools, one should not mistake synchronized ordering for “lower risk” or “more certain signals.”
Before use, one should confirm API accounts, trading pairs, directions, order types, and quantities. Executing simultaneously across multiple accounts may improve operational efficiency but can also concentrate similar directional risks across those accounts. If account balances, existing positions, and risk tolerance differ, a uniform ordering plan may not be suitable for all accounts. While tools can reduce repetitive work, account selection, capital arrangement, and risk judgment still need to be performed by the user.
Conclusion: Emotional recovery is worth noting, but bottoms need to be confirmed by a chain of evidence
The Fear and Greed Index returning to 37 indicates that sentiment readings have improved compared to before; however, according to common classifications, 37 still falls into the fear range. In conjunction with the candlestick chart, the price’s rebound from lower levels suggests signs of repair, but further verification through subsequent price structure, volume, and momentum changes is needed.
Therefore, the most compelling conclusion is not “the atmosphere of fear has ended, hurry to bottom fish,” but rather: market sentiment is improving, prices are also rebounding, but whether a bottom has formed still requires confirmation. At this stage, traders need to focus not on chasing a certain slogan but on clarifying their judgments, phased conditions, and risk boundaries.
If your plan involves multiple accounts, AiCoin’s multi-account ordering can help you organize execution according to follow-up or allocation schemes; its value lies in reducing repetitive operations and improving multi-account coordination efficiency. As for when to place orders, how much to order, and what to do if a judgment fails, it should still be determined by the trading plan, not by the sentiment index or tools acting on your behalf.
AiCoin Users Exclusive "Multi-Account Ordering" Super Tool
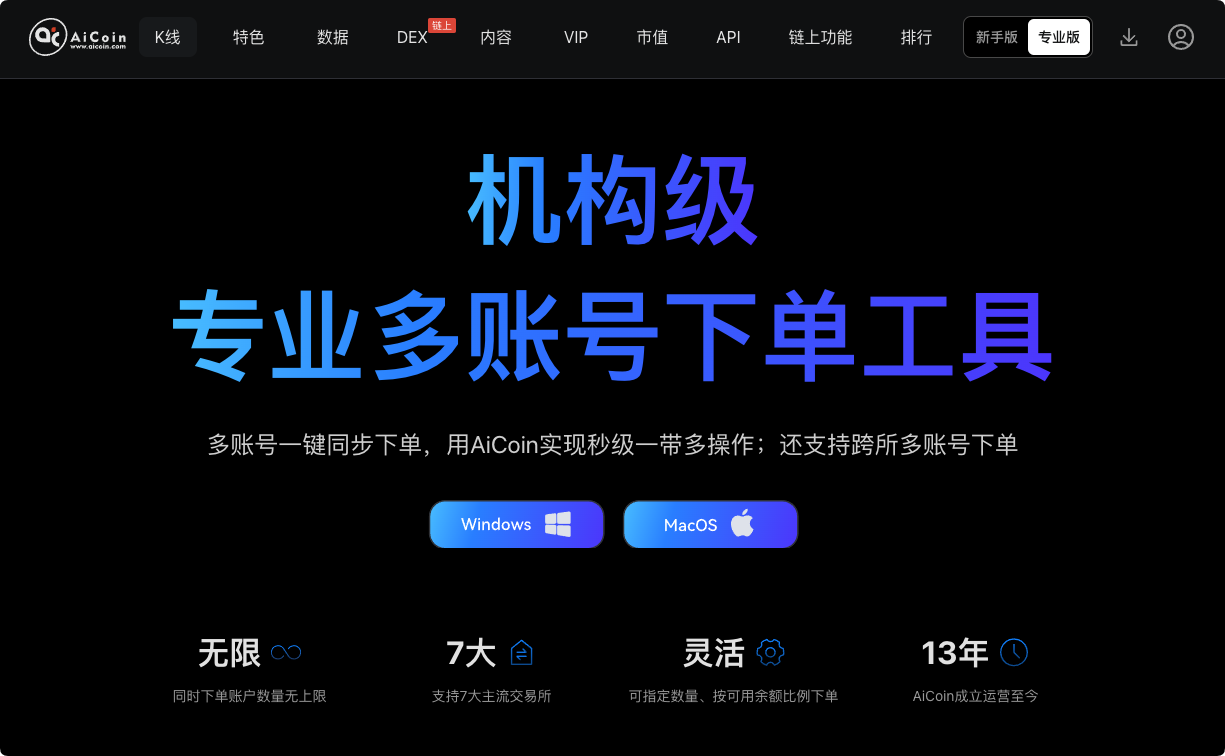
One-click synchronous ordering for multiple accounts, use AiCoin to achieve second-level multi-operation; it also supports cross-exchange multi-account ordering:
https://www.aicoin.com/zh-Hans/tg/multi-account
Don’t wait, start using it now and kick off your fast money-making plan!
免责声明:本文章仅代表作者个人观点,不代表本平台的立场和观点。本文章仅供信息分享,不构成对任何人的任何投资建议。用户与作者之间的任何争议,与本平台无关。如网页中刊载的文章或图片涉及侵权,请提供相关的权利证明和身份证明发送邮件到support@aicoin.com,本平台相关工作人员将会进行核查。