
Written by: Maher, Foresight News
On the evening of November 3rd, while mainstream television networks like CNN were still waiting for slow vote count data and hesitating to announce the results (Call the race), the prediction markets had already completed probability convergence and advance pricing through real monetary positions.
On election night, Polymarket and Kalshi quickly raised the winning probability in key swing states, with Polymarket's market estimating a 99% certainty for the Michigan Senate seat four hours before mainstream media made the official announcement. That night, the signals given by the two platforms with real money were faster and more decisive than average polls, prediction models, and formal announcements from television networks.
This is not the first time. During the 2024 presidential election, both prediction market platforms locked in direction ahead of time while polls were still fluctuating. In the 2026 midterm elections, they once again proved that it was not just a stroke of luck.
$3 Billion in Liquidity Takes the Lead
On November 3rd, Kalshi election contracts saw a daily trading volume of $729 million, as disclosed by Paradigm co-founder Matt Huang, far exceeding the single-day transaction amount of $244 million for the 2024 U.S. presidential election.
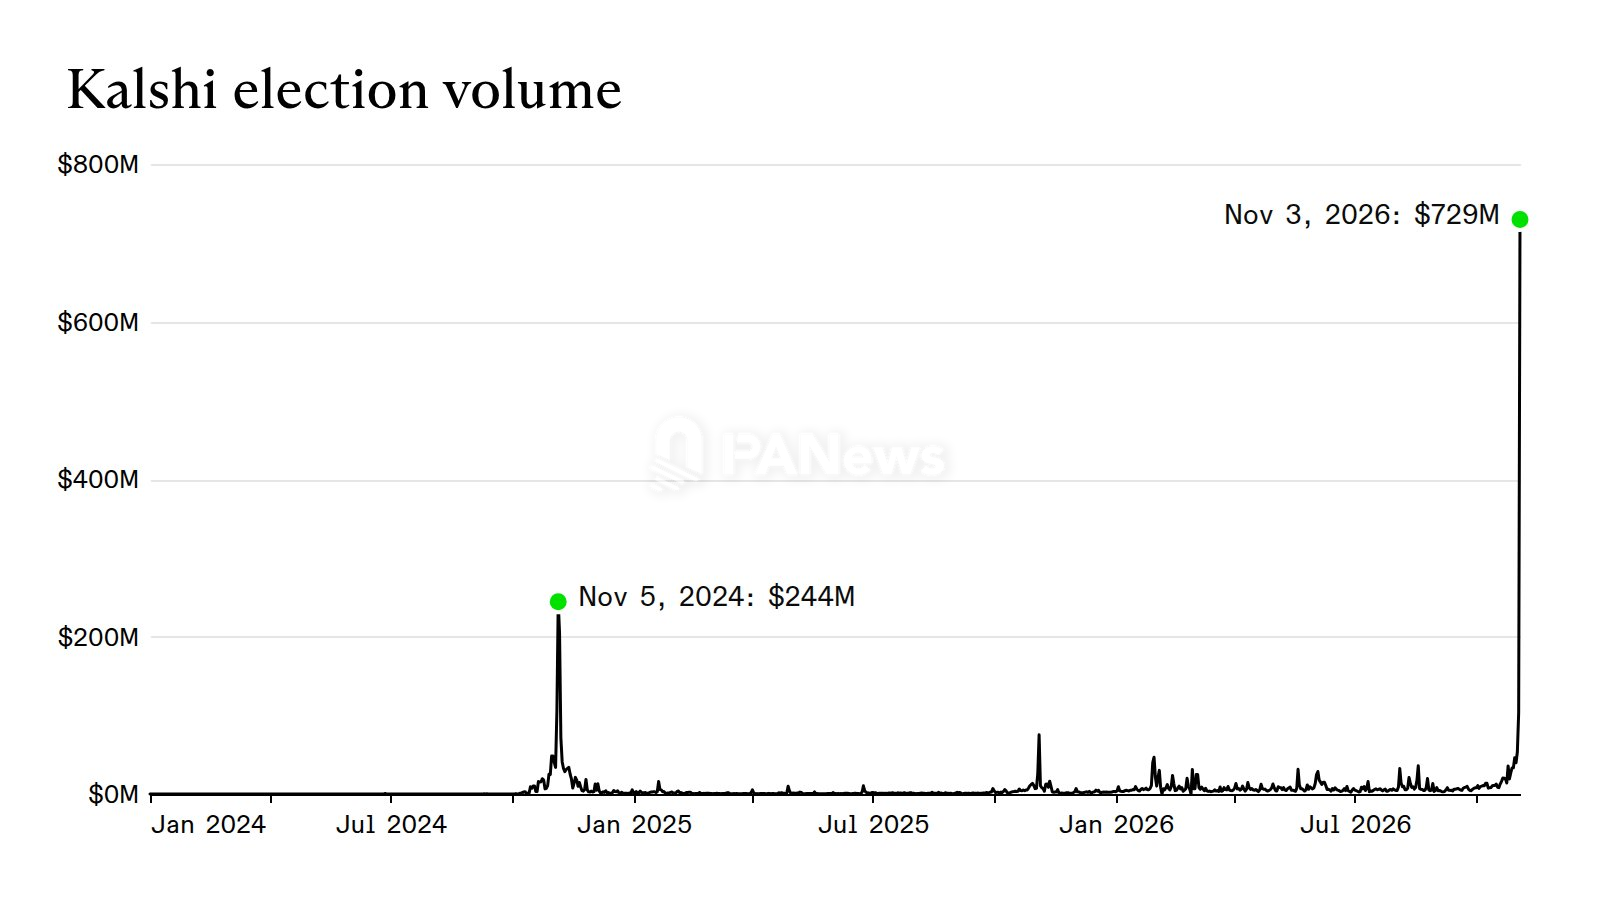
After the dust settled on the midterm elections, an official article from Kalshi revealed that the total trading volume of related markets for the 2026 midterm elections exceeded $2.5 billion, almost double the $1.3 billion for the entire 2024 election cycle.
It is worth noting that Kalshi had just won a lawsuit against the CFTC and was approved to launch U.S. political contracts in October 2024, just one month before the election. However, the true dominant player in the 2024 election was Polymarket (which alone had a single presidential election contract exceeding $3.6 billion). Now, just two years later, the trading volume pattern in the election market has reversed between the two.
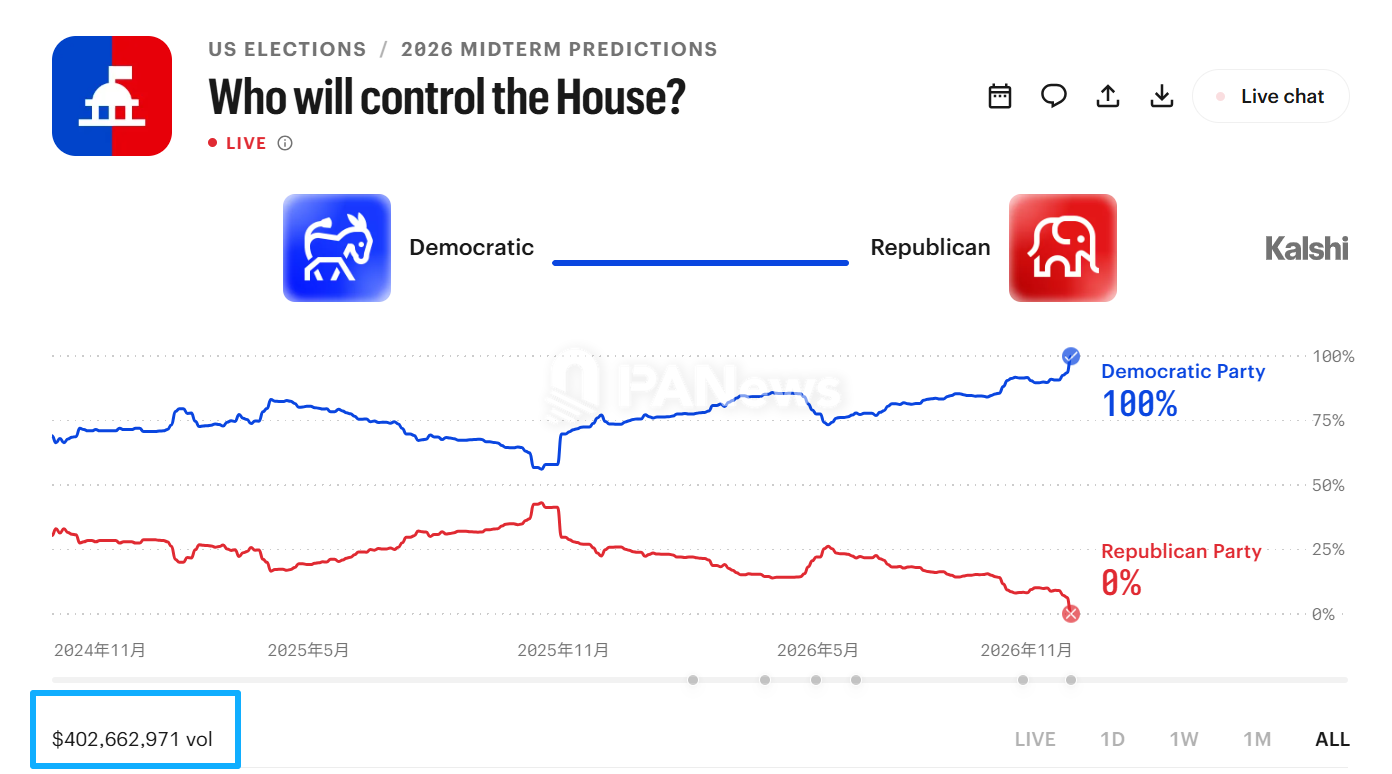
On Kalshi, just the single prediction market for "Who will control the U.S. House of Representatives" has a total trading volume exceeding $400 million.
On the eve of the election, the total volume on Kalshi and Polymarket combined was nearing $1.9 billion, with Kalshi accounting for about $1.3 billion and Polymarket around $600 million.
Before and after the election, Kalshi's total platform daily nominal trading volume surged to $4.15 billion (including non-election contracts), with key targets like the Texas Senate (surpassing $100 million in a single day), control of the House of Representatives, and the Texas gubernatorial race drawing most of the buying depth.
Polymarket, however, faced restrictions due to the separation between its onshore compliant version (Polymarket US) and its offshore international version, leading to relatively scattered trading statistics. The combined trading volume of both versions was in the range of $600 million to $700 million, with core trading volume also highly concentrated in two-house control and gubernatorial balancing contracts.
Although election contracts make up a smaller proportion of total trading compared to sports and composite contracts, the absolute scale of over $3 billion has turned the midterm elections from a marginal issue into a main battlefield.
Accuracy Exceeds 98%
The figures provided by Kalshi indicate that as of 6:26 AM Eastern Time on November 4th, among the 487 race tracks that had announced results, the most popular candidates won 479 races, achieving an accuracy rate of approximately 98%.
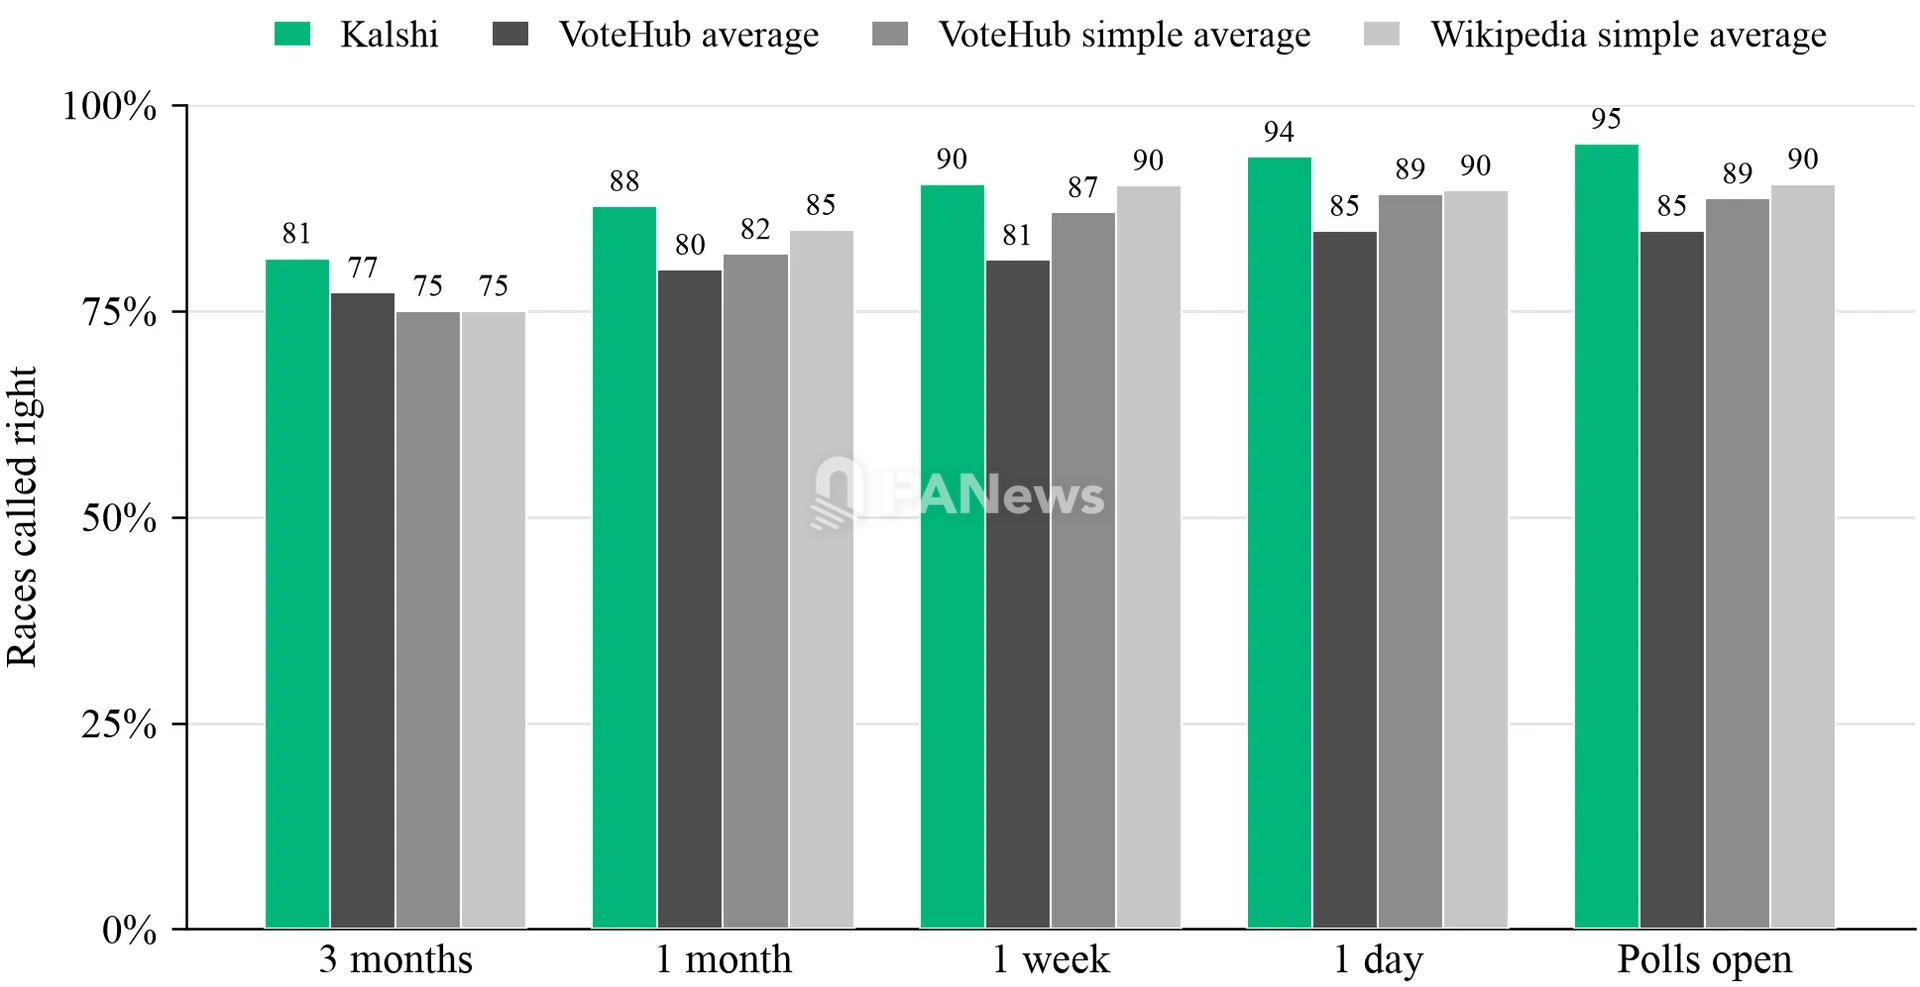
Kalshi's research team further disclosed that its overall race prediction accuracy rose from 93.8% three months ago to 98.2% by the end of voting; even compared to averages from mainstream polls like VoteHub and Wikipedia, Kalshi showed a significant leading advantage at each time point (reaching 95% during voting, above the poll average of 85%-90%)
Polymarket also disclosed its data: the most popular candidates the day before the election won 419 out of 426 settled race tracks, achieving an accuracy rate of 98.4%, with 78 races still pending settlement.
Data pages show that the direction accuracy for settled race tracks in the Senate, gubernatorial, and House of Representatives is approximately 97%, 97.1%, and 98.6%, respectively.
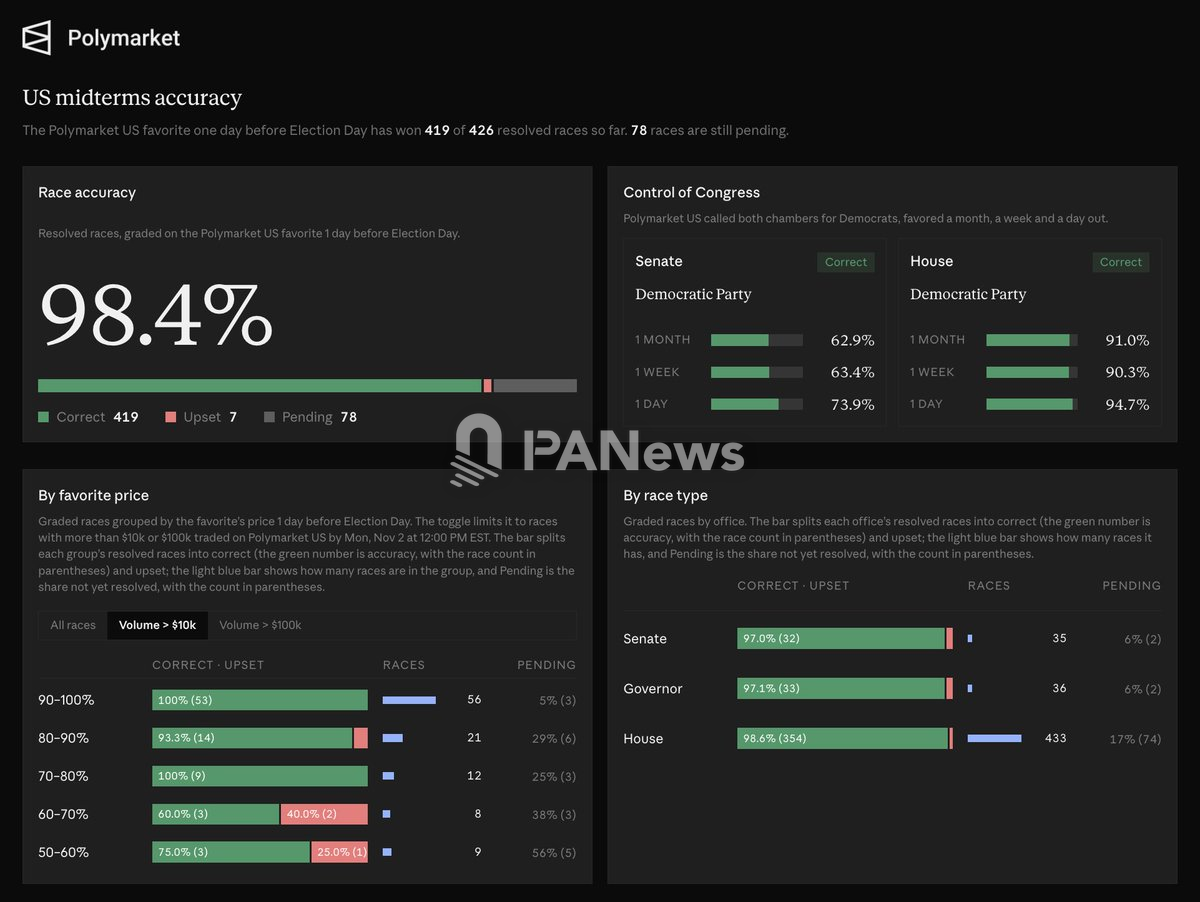
Both platforms had set the winning probabilities for the Democrats in the House of Representatives at around 94% and for the Senate at around 75% before voting began, and the final results for both houses aligned with these predictions.
However, directional accuracy does not equate to margin accuracy. Third-party analysis pointed out that the market implied Republican House seats around 192 as voting began, while NBC's later seat calculation was 176. The unexpected reversals predominantly favored the Democrats. Economist Koleman Strumpf told Bloomberg he gave a “B” for this reason: while the directional call was correct, “this is a historical blue wave,” which was difficult to discern directly from market prices.
The sample itself also had its flaws. Many non-competitive race tracks elevated the overall accuracy, and the true battlegrounds were those within the 10-90% range. Some results from states like Alaska and Mississippi have not yet been fully settled, and direct comparisons between platforms must consider timing and sample differences.
Faster than News
Speed is an aspect both platforms are eager to highlight.
Kalshi claims that, on key Senate race tracks, the market raised the winning side to over 99% on average approximately 115 minutes before CNN made a formal announcement.
Polymarket provided specific comparisons for 10 key race tracks: it published the 99% judgment time on X, with a median that was 31 minutes earlier than CNN, Fox News, and the Associated Press, and approximately 4 hours earlier for the Michigan Senate.
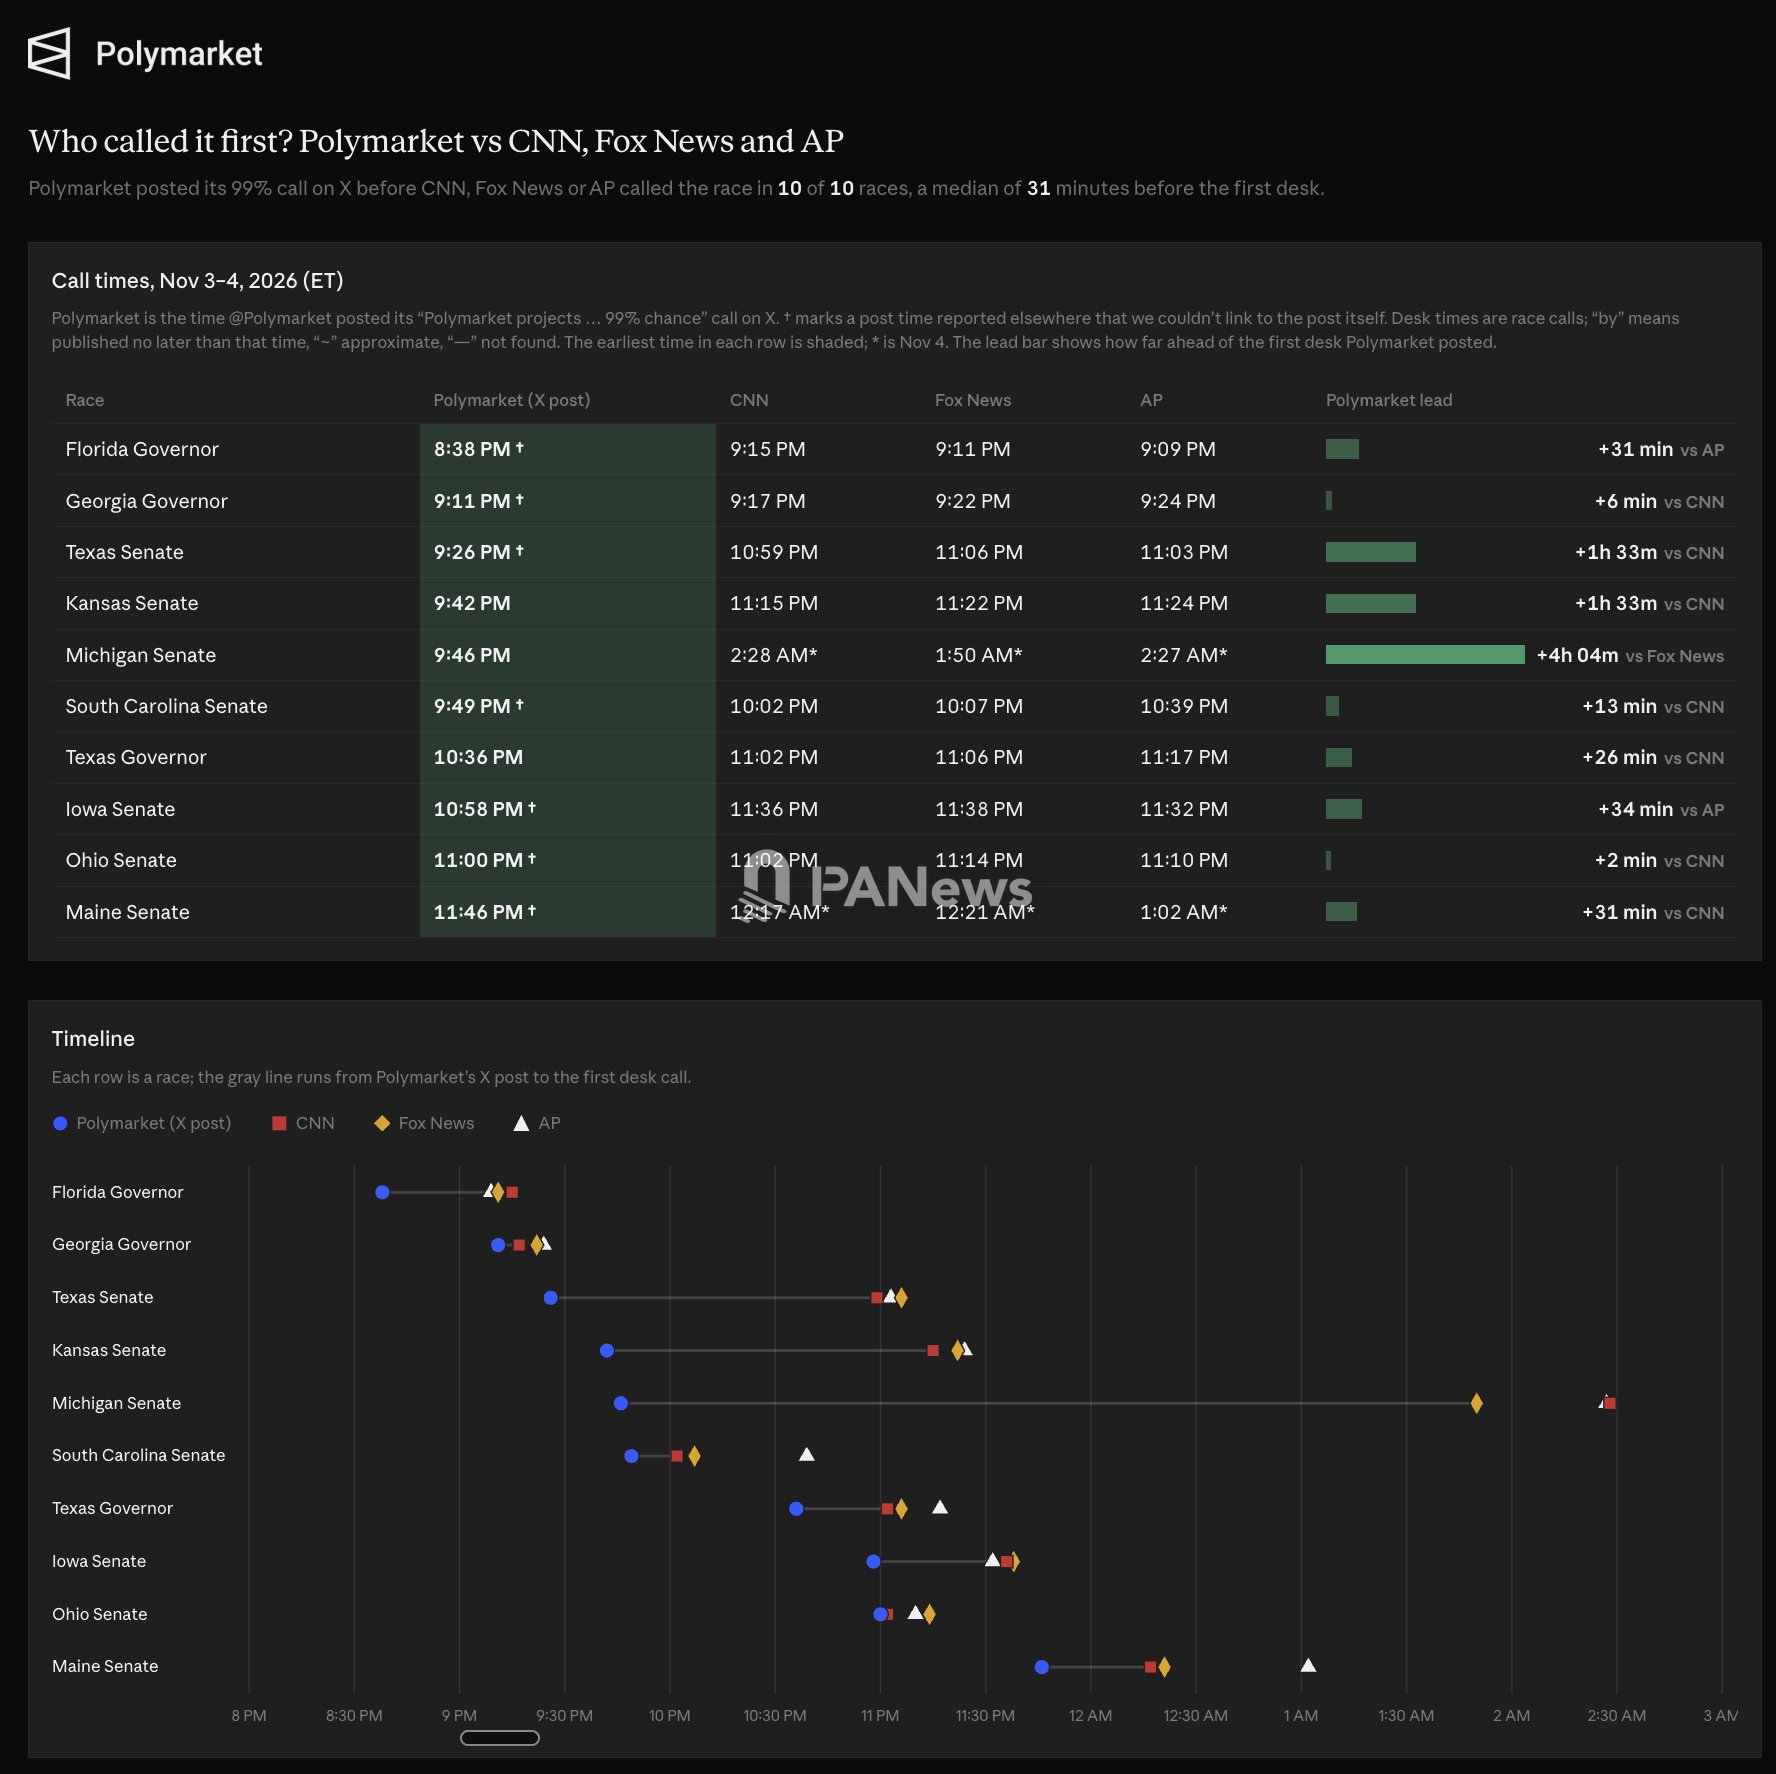
The events of election night further illustrate the issue. As soon as results came out for early closing states, the control contracts on both platforms started to move rapidly toward extremes, pushing the probability of Democrats controlling both houses close to certainty by evening. This was more direct than waiting for new data from average polls or rerunning models.
Both platforms are close in directional accuracy, with Kalshi currently leading in trading volume, but Polymarket still holds its position regarding international users and on-chain transparency.
After the Winners
In this midterm election, prediction markets once again demonstrated that continuous pricing mechanisms motivated by real money can aggregate dispersed information into highly anticipatory real-time signals. Mainstream media and Wall Street trading desks have begun to include them as core observation indicators instead of merely viewing them as speculative casinos.
However, as the glow of election night fades, the pricing boundaries and underlying business logic of prediction markets become clear.
First, the high overall winning rates are somewhat diluted by non-competitive district samples, and the estimation errors in the House of Representatives seat size indicate that the binary option structure is highly sensitive in determining “win/lose direction” but still faces pricing friction in capturing “sweep margins.” Second, if we step out of the pulse-like surges of daily transaction volume and look at the distribution of outstanding contracts (Open Interest), we can better understand the true business foundations of prediction markets.
According to data from Paradigm as of November 4th, after a large set of midterm election contracts settled on November 3rd and entered delivery and clearance, Kalshi's total outstanding contracts (OI) remained at a high of $2.5 billion. Of this, the political sector accounts for $679.2 million (27.1% of total OI), with funds rapidly rotating from settled midterm elections to the next period's “bipartisan presidential nominations” and undecided gubernatorial seats; what truly supports the platform's daily locked positions is the sports event sector, which accounts for as much as $1.5 billion (59.9% of total OI).
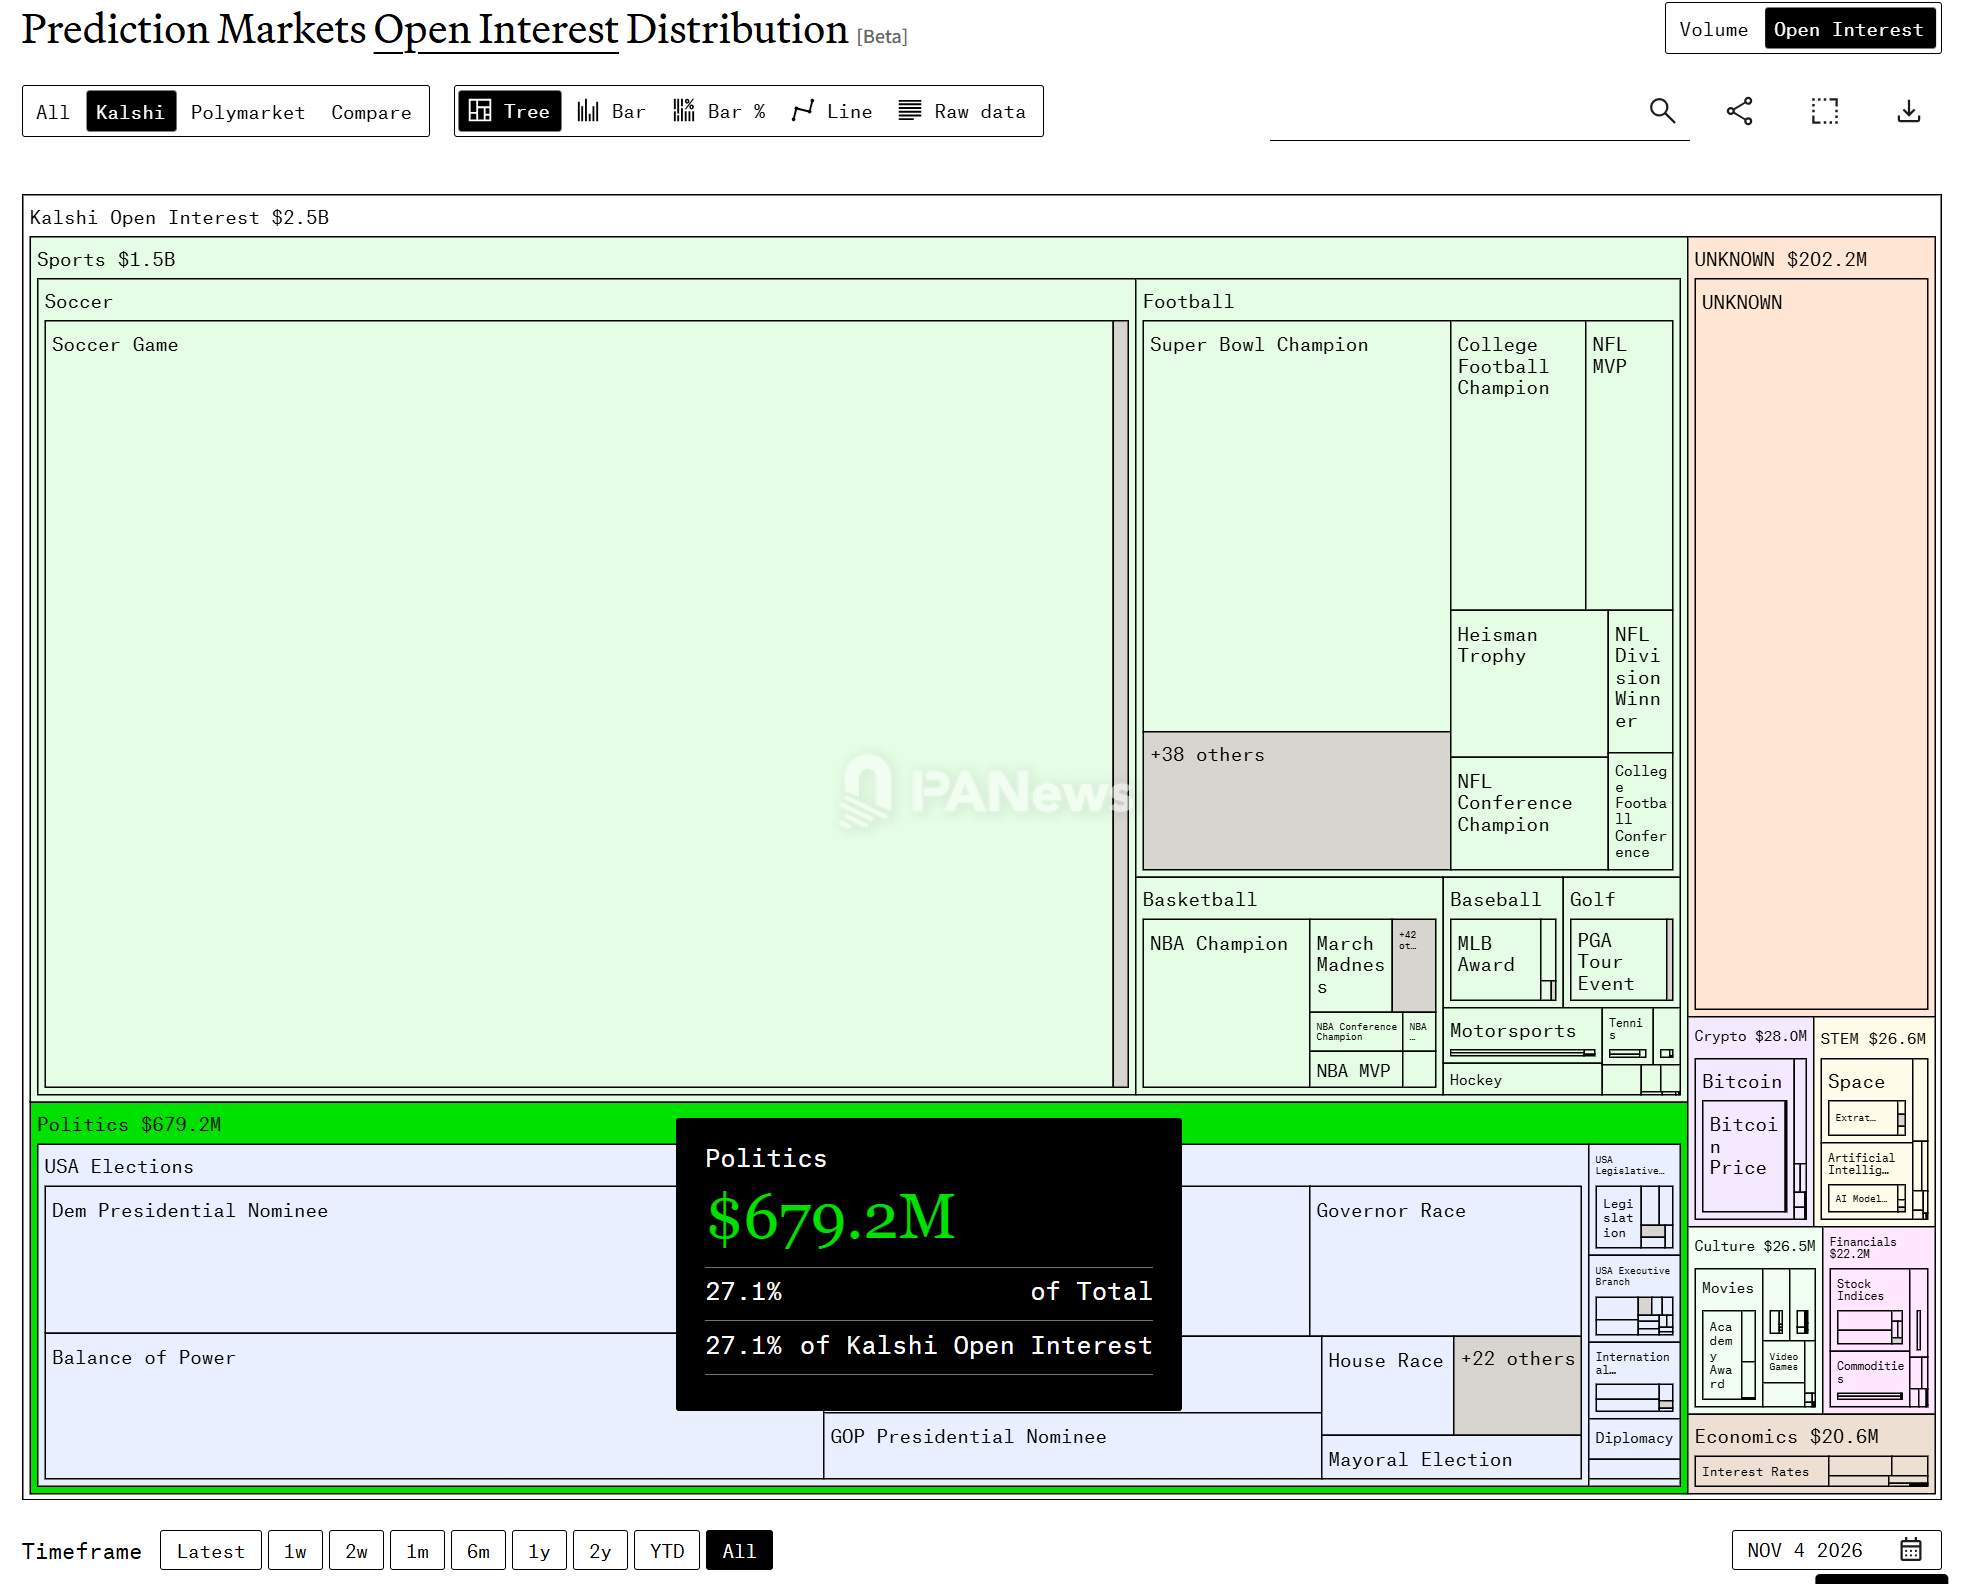
This stock structure reveals the core strategy of prediction markets breaking the cycle of election periods: using the biennial political election as a low-cost customer acquisition funnel with significant breakout effects, and then capturing the massive funds accumulated through high-frequency, high-turnover sports events and composite contracts (multi-condition combined prediction contracts).
As discussions on regulatory rules deepen after the U.S. midterm elections, prediction markets not only won the volume battle of the midterm elections but are also accelerating their evolution into an alternative financial derivatives exchange that operates around the clock.
免责声明:本文章仅代表作者个人观点,不代表本平台的立场和观点。本文章仅供信息分享,不构成对任何人的任何投资建议。用户与作者之间的任何争议,与本平台无关。如网页中刊载的文章或图片涉及侵权,请提供相关的权利证明和身份证明发送邮件到support@aicoin.com,本平台相关工作人员将会进行核查。


