Who is still using cryptocurrencies in a bear market?
Written by: Chainalysis
Translated by: Saoirse, Foresight News
Editor's Note: With a market value evaporating by $2.1 trillion, the on-chain economy only decreased by 1.6% — Chainalysis' seventh edition of the “Global Crypto Geography Report” uses on-chain data from 117 countries to document a crypto world that is decoupled from price cycles. Its core finding is not a change in rankings but a shift in use cases: as speculation retreated, cross-border transfers with stablecoins, domestic P2P, and small payments continued to operate, with 96% of P2P transactions completed using stablecoins, cross-border transfers averaging only $3,000, and stablecoin balances remaining unchanged during a nine-month plummet. Geographical adoption shifted southward: Brazil topped the charts for the first time, while Latin America and Africa grew against the trend, and Eastern Europe saw stark divergence between Russia's contraction and Ukraine's influx of stablecoins. The report is characterized by measuring adoption through real usage rather than trading volume, placing "who is using it and for what" above "who is speculating." Below is a summarized translation of the core contents of this report.
Global Overview: Market Cap Halved, On-Chain Economy Nearly Steady
The statistical period covers July 1, 2025, to June 30, 2026. During this period, Bitcoin first reached an all-time high, followed by the largest dollar retracement in history; the total crypto market cap shrank by approximately 50% ($2.1 trillion), marking the deepest bear market since the series of collapses in 2022.
If crypto were still merely an investment tool, the on-chain contraction in 2026 should be more severe than in 2023 — in 2023, the market cap only shrank by $0.3 trillion, while the on-chain economy fell by 23%; however, in 2026, although the market cap fell seven times more, the on-chain economy only decreased by 1.6%, maintaining a size of $9.4 trillion. The diversification of use cases absorbed price shocks: when speculative trading shrank in sync with price drops, payments, remittances, and local value transfers continued to operate. Global crypto service inflows fell by 4.3%, from $9.3 trillion to $8.9 trillion, but the explosion of domestic P2P and cross-border stablecoin expansion nearly completely offset this decline.
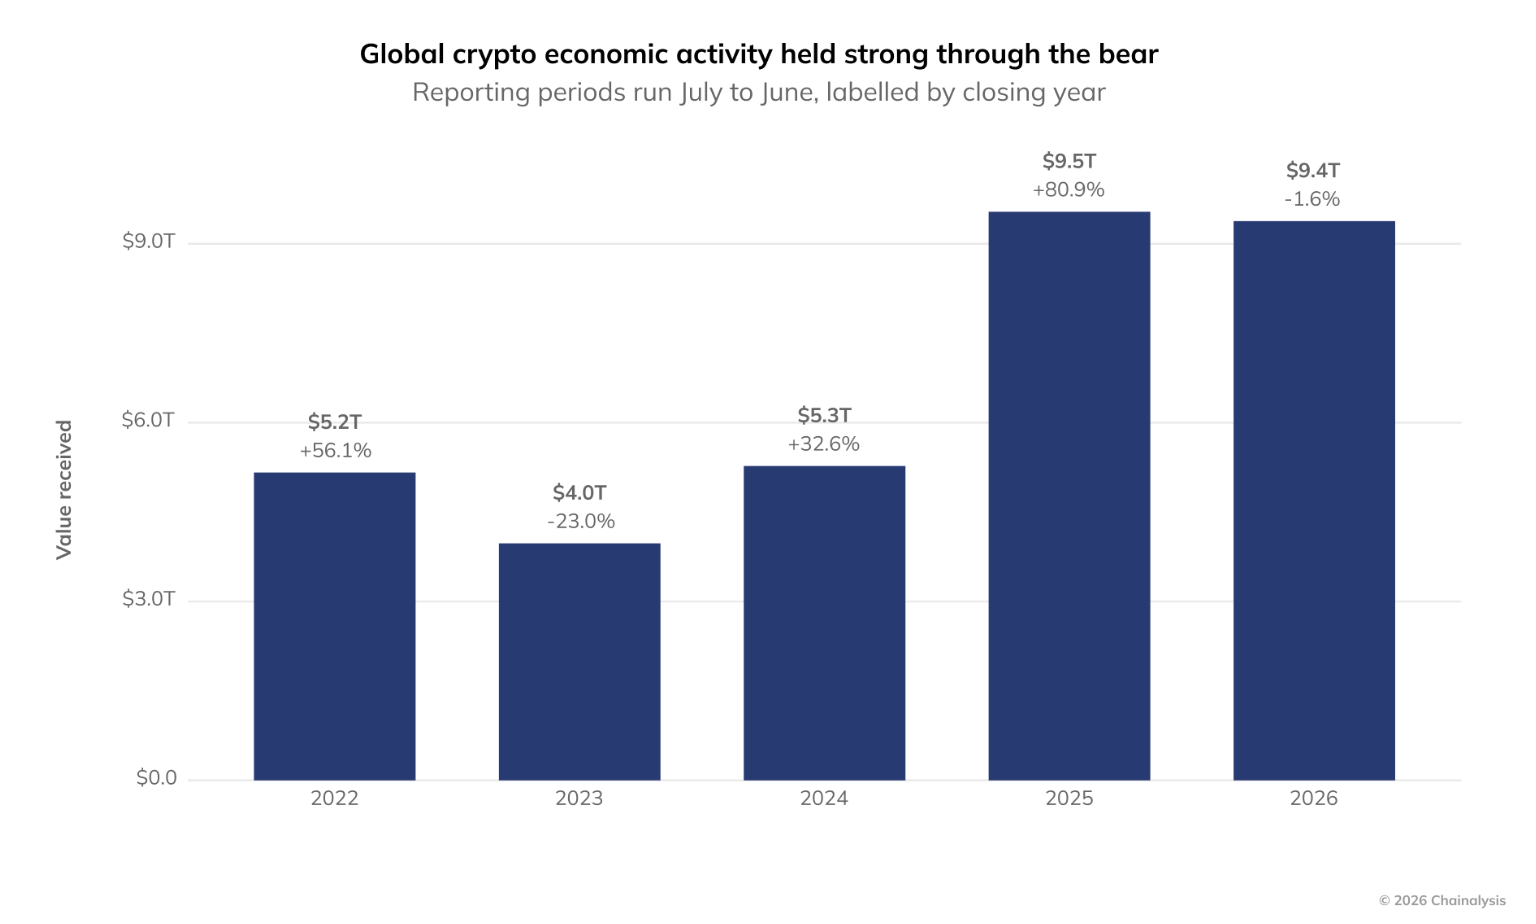
From 2022 to 2025, the total on-chain receiving value generally rose, with a slight decline to $9.4 trillion in 2026, reflecting the strong resilience of the crypto on-chain economy during downturns.
Structural Changes: Three Groups of Counter-Cyclical Expansions in a Bear Market
Amidst a global micro-decrease of 1.6%, three groups of activities not only avoided shrinkage but formed the underlying logic of “utility hedging speculation.” They jointly illustrate that the bear market impacts the price-sensitive half of crypto, while the payment half remains largely unaffected.
Domestic P2P Surges by 302.9%, with Stablecoins Accounting for 96%
Domestic peer-to-peer transfers jumped from approximately $56.8 billion in the previous report to $228.7 billion, an increase of 302.9%. The share of P2P in both service inflows and total P2P rose from 0.6% to 2.5%, with shares increasing in all eight regions tracked by the report.
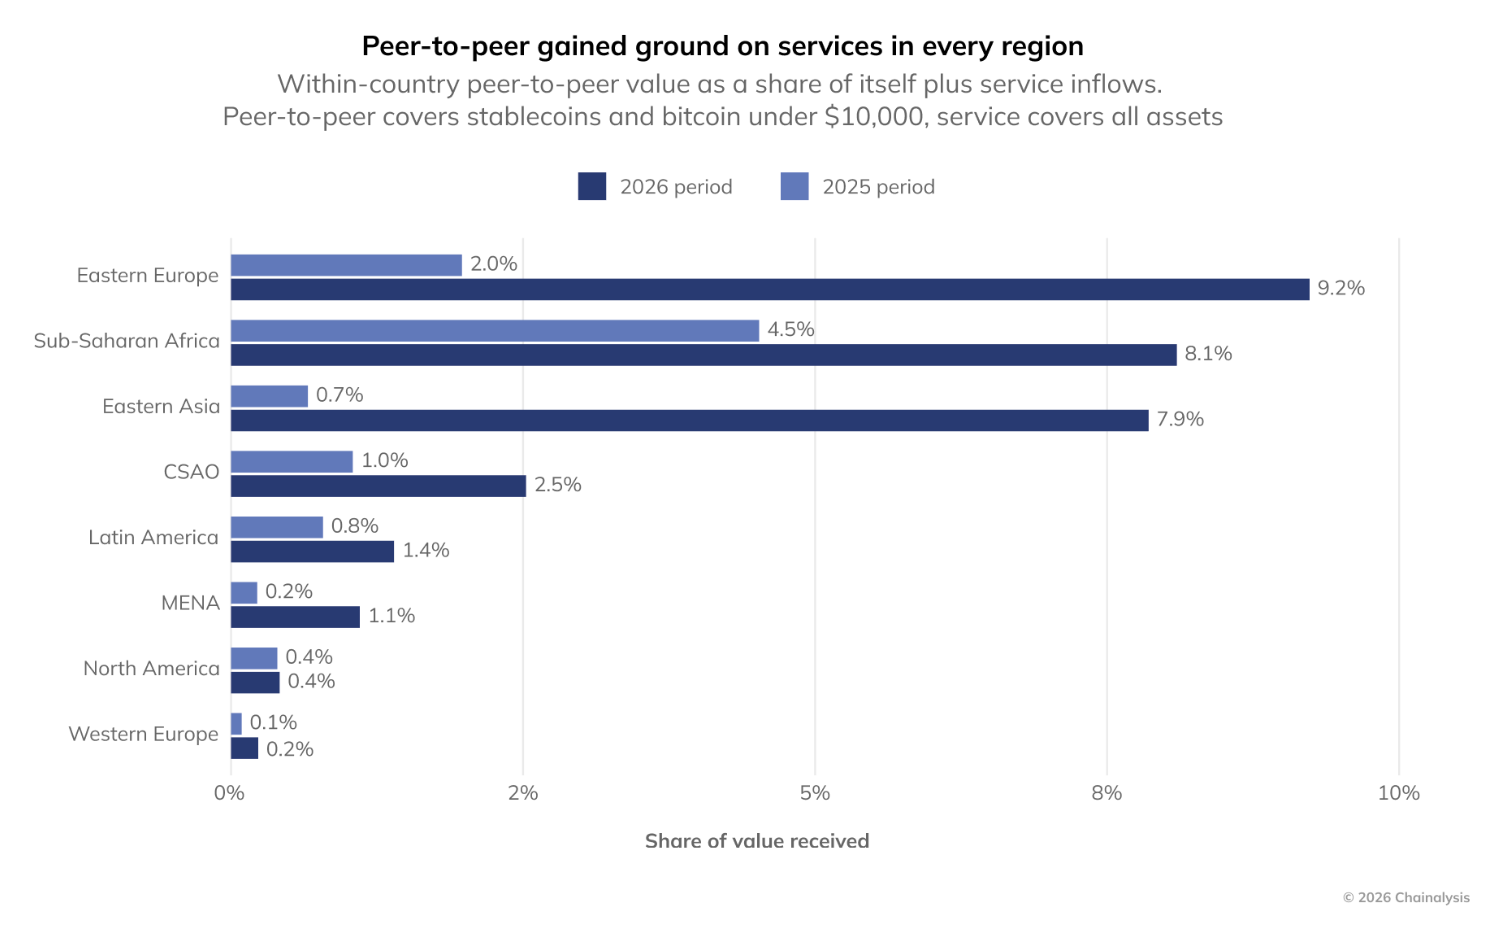
From the statistical periods of 2025 to 2026, the share of P2P transactions (stablecoins, Bitcoin) under $10,000 significantly increased in most regions, with Eastern Europe, Sub-Saharan Africa, and East Asia seeing the most prominent increases, while North America and Western Europe maintained lower shares.
More detailed breakdowns reveal the driving force: domestic P2P by asset type as a whole dropped by 19.7%, but the stablecoin portion soared by 377.7%. Currently, 96% of transfers in P2P channels are completed with stablecoins; however, this is not the case in service channels. The economic implication of this comparison is that when trust in trading platforms and custodians declines during a bear market, direct value transfer between individuals becomes an alternative infrastructure. P2P is not a “residual of trading exchanges” but an independent channel expanding during a bear market.
Cross-Border Stablecoin Transfers Grew by 77.5%, with Channels Shifting from “Head Concentration” to “Long Tail Activation”
Cross-border stablecoin transfers rose from $124.2 billion to $220.3 billion, an increase of 77.5%. Monthly cross-border stablecoin values more than doubled from $11 billion in January 2025 to $24 billion in June 2026, while Chainalysis emphasizes that this is still a conservative estimate — transfers that cannot be reliably attributed to both sending and receiving countries are excluded, so the real scale is higher.
The key variable is the transaction size: cross-border stablecoin transfers average around $3,000. This amount is too small to be institutional-level allocations; it falls precisely within the daily use case range — for example, paying a supplier, sending money home, or moving savings out of a currency that is no longer considered trustworthy. Philip Gradwell, vice president of economics at Tether, further confirms this assessment of the report: “Activity has become continuous, flowing through wallets at a steady pace rather than sporadically. This is a signature of trade and business operations, not speculation.”
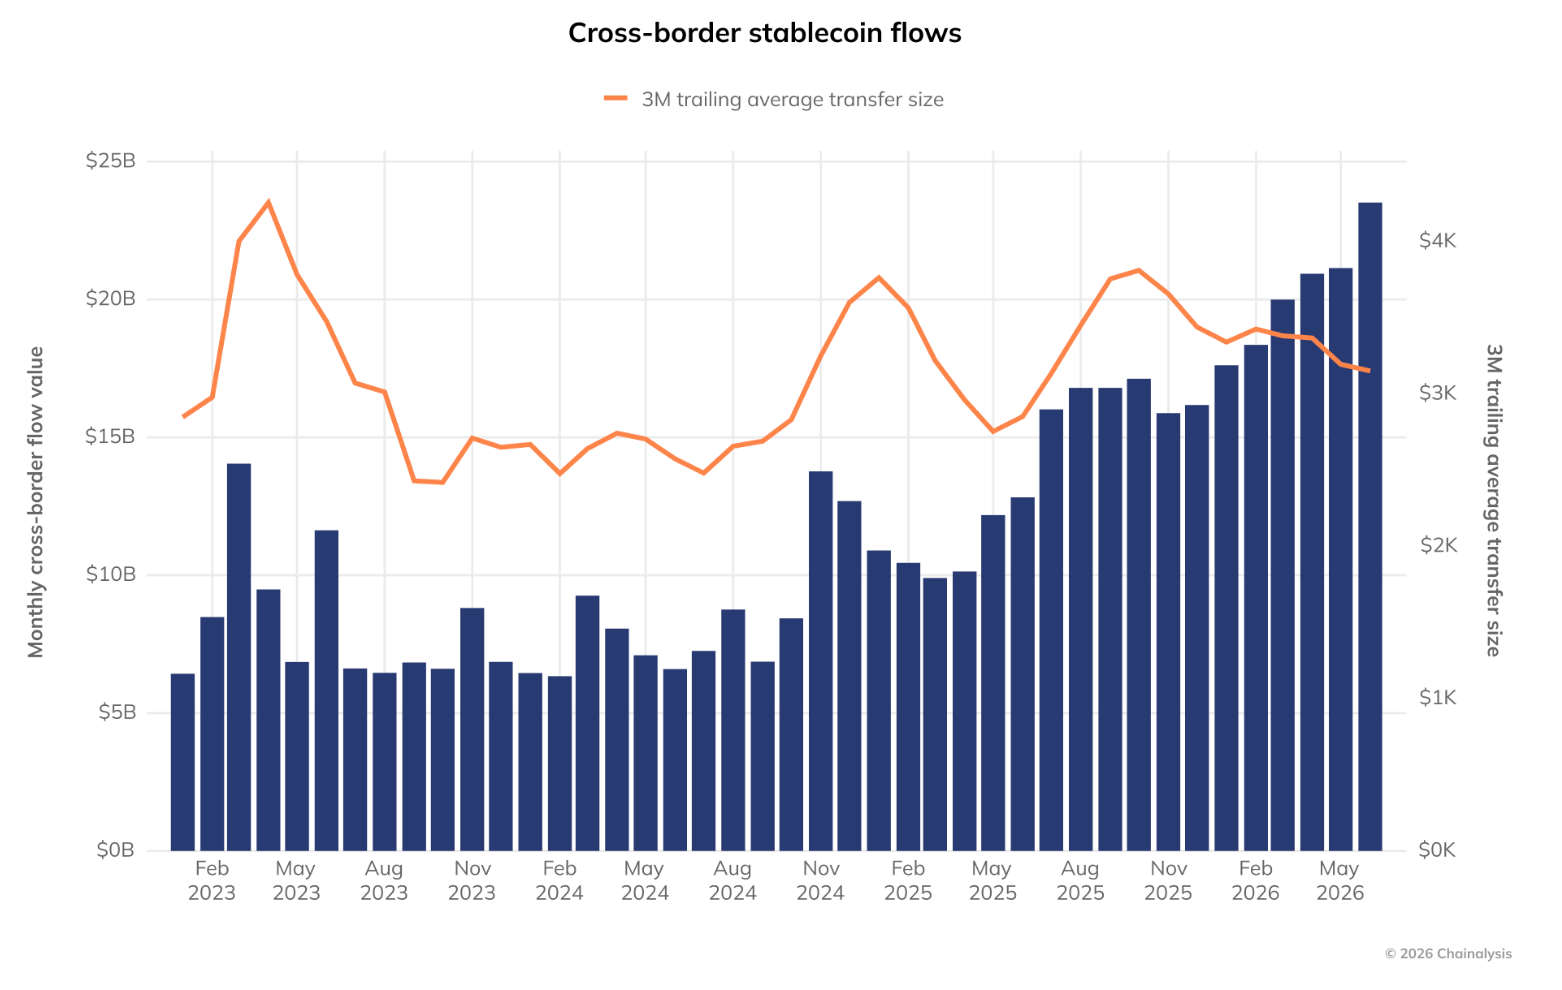
Monthly cross-border stablecoin transfer amounts continuously increased overall, with significant rises later, while the rolling three-month average transaction size remained around $3,000, fluctuating slightly after rising peaks.
The structure of “channels” is the key framework for understanding the diffusion of cross-border stablecoins. The report found that the top 25% of channels carry 96.1% of the value of cross-border stablecoins, which grew by 70.8% during the statistical period. However, what is truly noteworthy is the activation of bottom channels: previously, the three lower quartiles of channels collectively carried only $26 million, while in this statistical period, they jumped to $8.66 billion; 4,708 new channels were opened, carrying a total of $2.64 billion. The “long tail” of stablecoins is moving from a dormant state to operation. USDT plays a major role in this — Gradwell describes that USDT serves the “portion of the economy that is excluded or denied access by traditional financial technology pricing,” with an average transaction cost of about one cent, instant settlement, and only requiring a mobile phone. The implementation of regulatory frameworks provides the institutional background: the U.S. “GENIUS Act,” the EU MiCA, and similar actions in Japan, Hong Kong, Singapore, and the UK collectively drive the institutionalization of stablecoin adoption.
Retail and Institutional “Bidirectional Resilience,” Stablecoin Balances Anchored
Inflows of small funds to platforms saw significant growth: transfers under $100 increased by 78.4%, and those between $100 and $1,000 grew by 58.6%. Retail trading volumes totaled about $273 billion, accounting for a small share of nearly $10 trillion in total activity; however, their absolute growth debunks the narrative that "the bear market drives out retail investors" — ordinary users did not systematically exit during price crashes. The institutional side also showed resilience: transfers over $1 million only fell by 7.2%. In a market where asset values have halved, to transfer the same economic value as before, twice the amount of assets must be moved; the institutional flow recorded only a single-digit percentage decline under this constraint, indicating that their on-chain behavior is also not solely driven by price narratives.
The trend of stablecoin balances provides another anchor line. Global on-chain balances declined from a peak of $860 billion in September 2025 to $440 billion in June 2026, while non-stablecoin assets dropped by 55.6%. However, stablecoin balances consistently remained within the range of $98 billion to $109 billion during the nine-month downturn. The proportion of stablecoins in global on-chain balances passively rose to 22.5% — not because holders bought more stablecoins, but because surrounding assets depreciated. This pattern is not new: stablecoin balances grew by 72.5% from December 2022 to September 2025, subsequently maintaining their level during the 2026 retraction. Each cycle begins from a higher stablecoin base, and the share of stablecoins within total balances increases during market downturns.
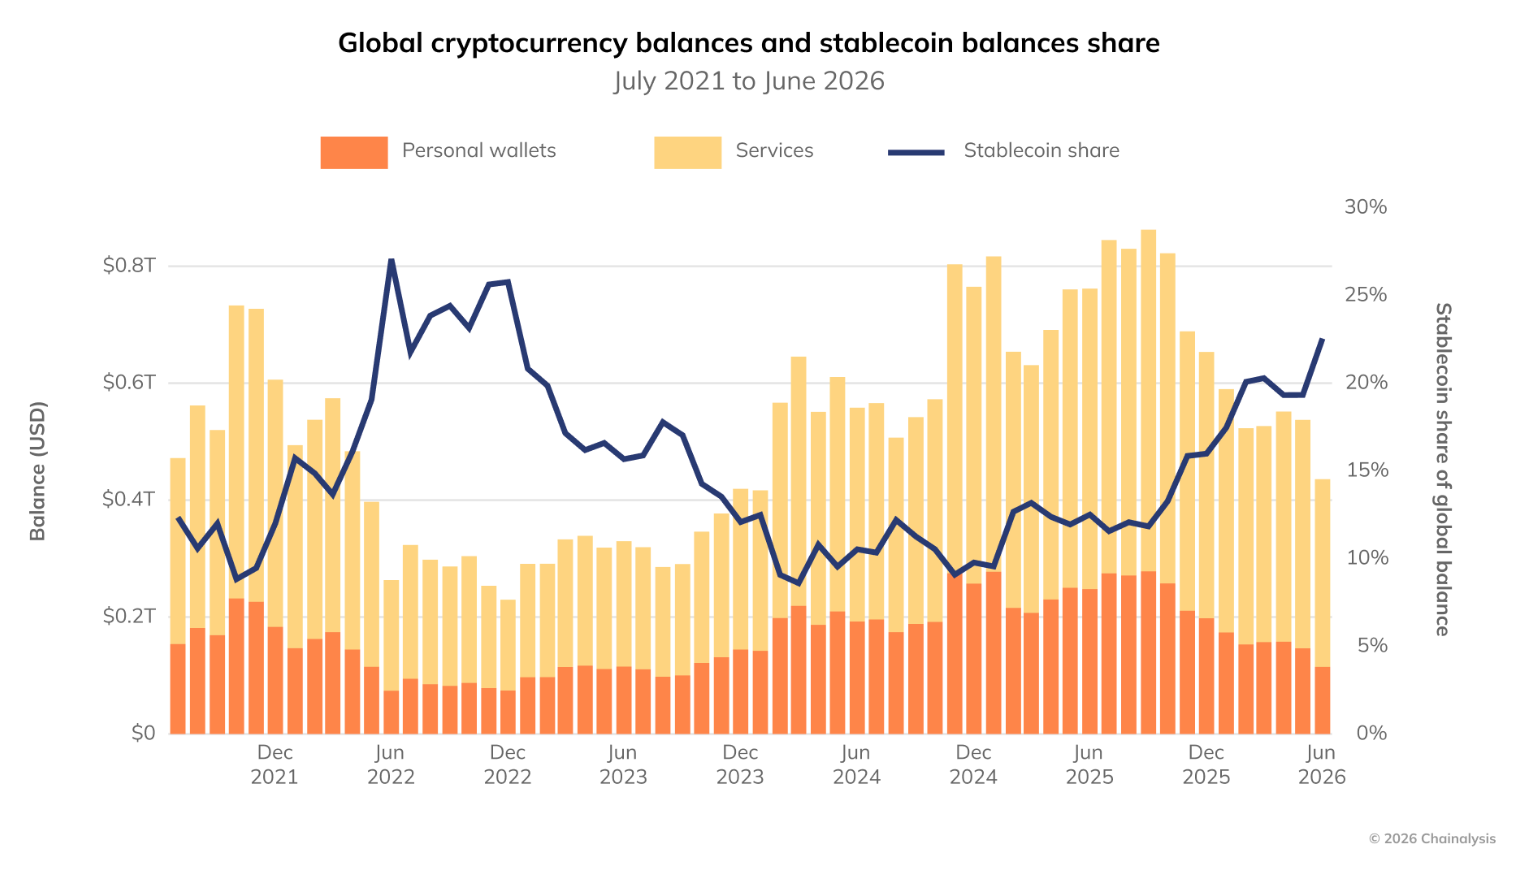
From July 2021 to June 2026, the total holdings of global crypto assets are divided into individual wallets and platform services, with the proportion of stablecoins experiencing a rebound to high levels after a round of decline.
Regional Landscape: Decentralization of Growth Extremes
Under a global decline of 1.6%, regional differentiation conveys much more information than the total figures. Three regions achieved positive growth: Sub-Saharan Africa led with 13.4%, Latin America followed closely at 9.8%, and Western Europe at 1.2%. Eastern Europe experienced the deepest decline at -7.9%.
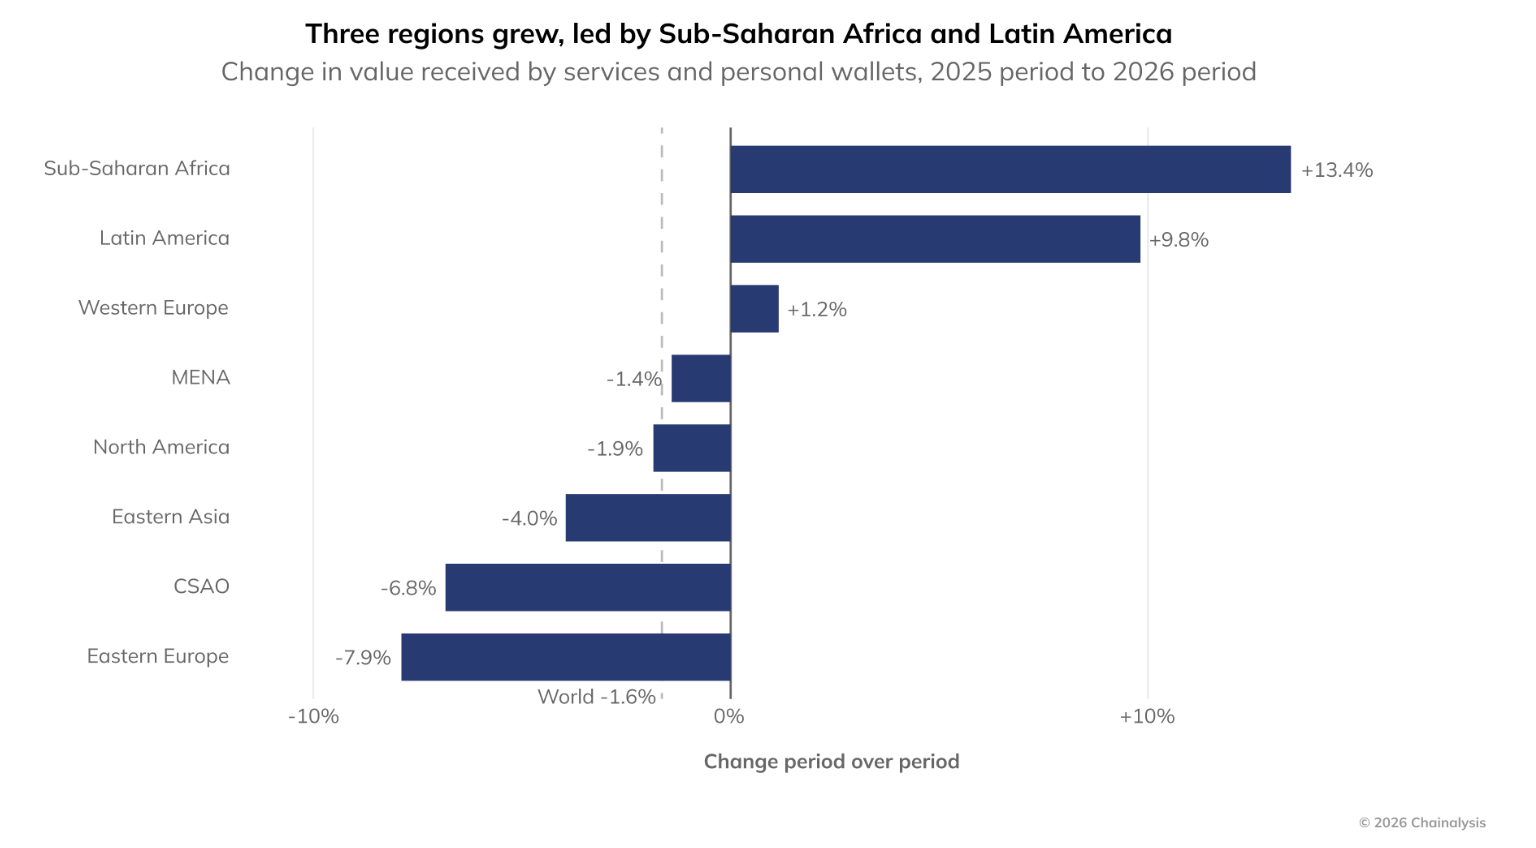
From the 2025 statistical period to the 2026 statistical period, only Sub-Saharan Africa, Latin America, and Western Europe saw increases in crypto asset receiving, while all other regions declined, with an overall global decrease of 1.6%.
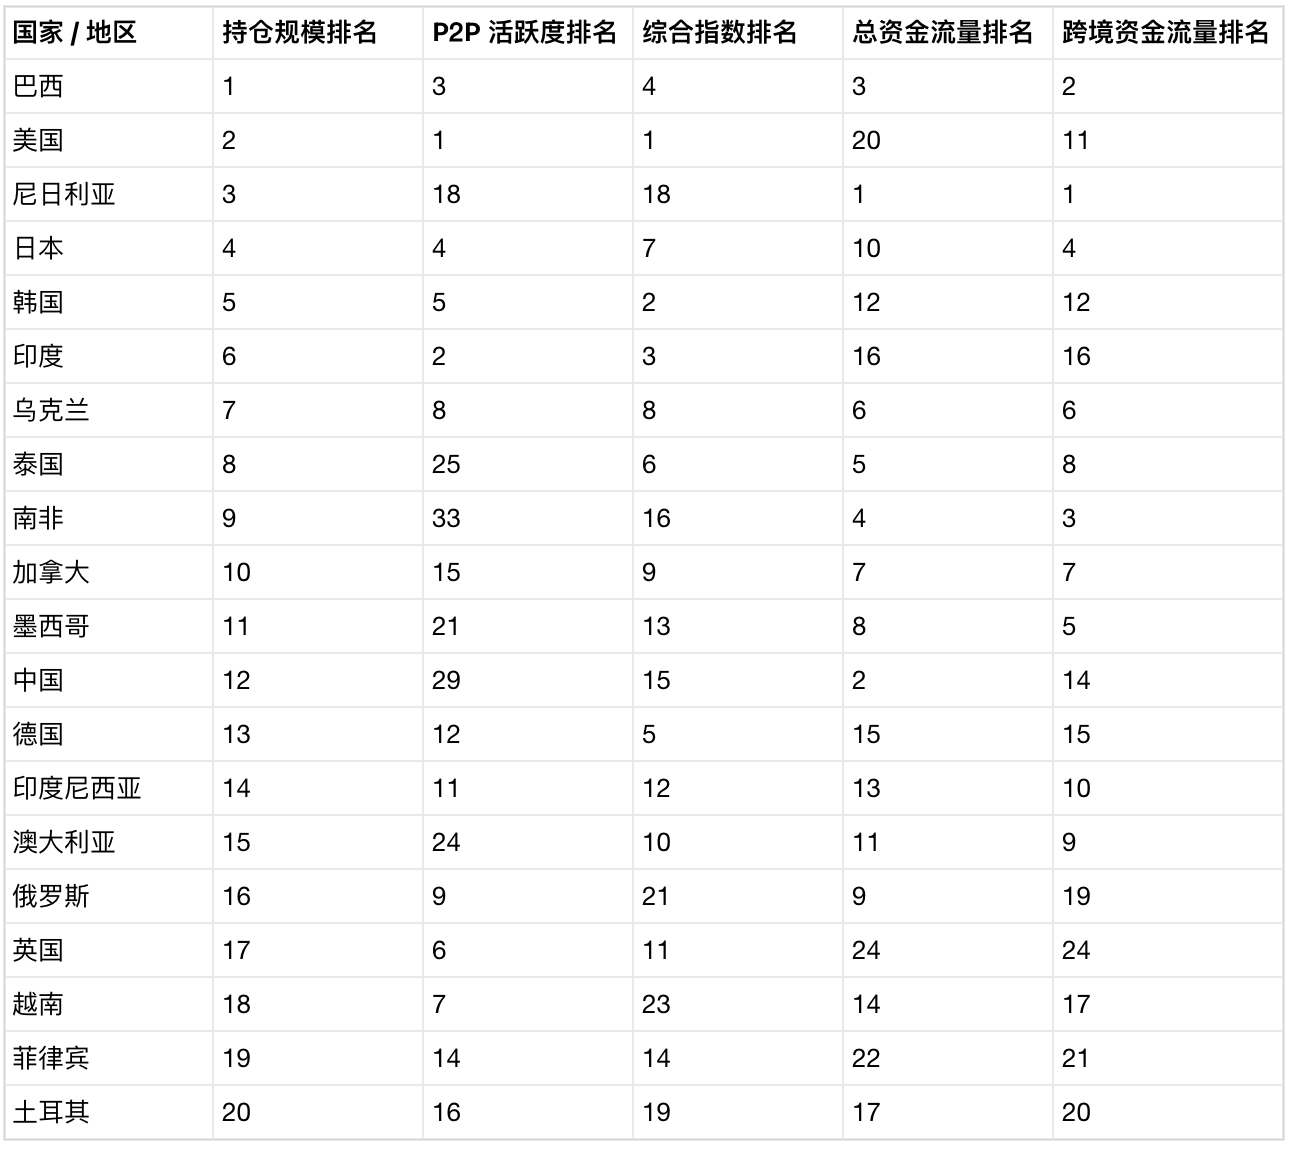
In terms of adoption indexes, Brazil ranks first, the U.S. second, Nigeria third, Japan fourth, South Korea fifth, India sixth, Ukraine seventh, Thailand eighth, South Africa ninth, Canada tenth, Mexico eleventh, and China twelfth. Below, each region will be detailed, retaining its scale, growth rate, national structure, stablecoin/P2P/cross-border/balance characteristics, and regulatory clues.
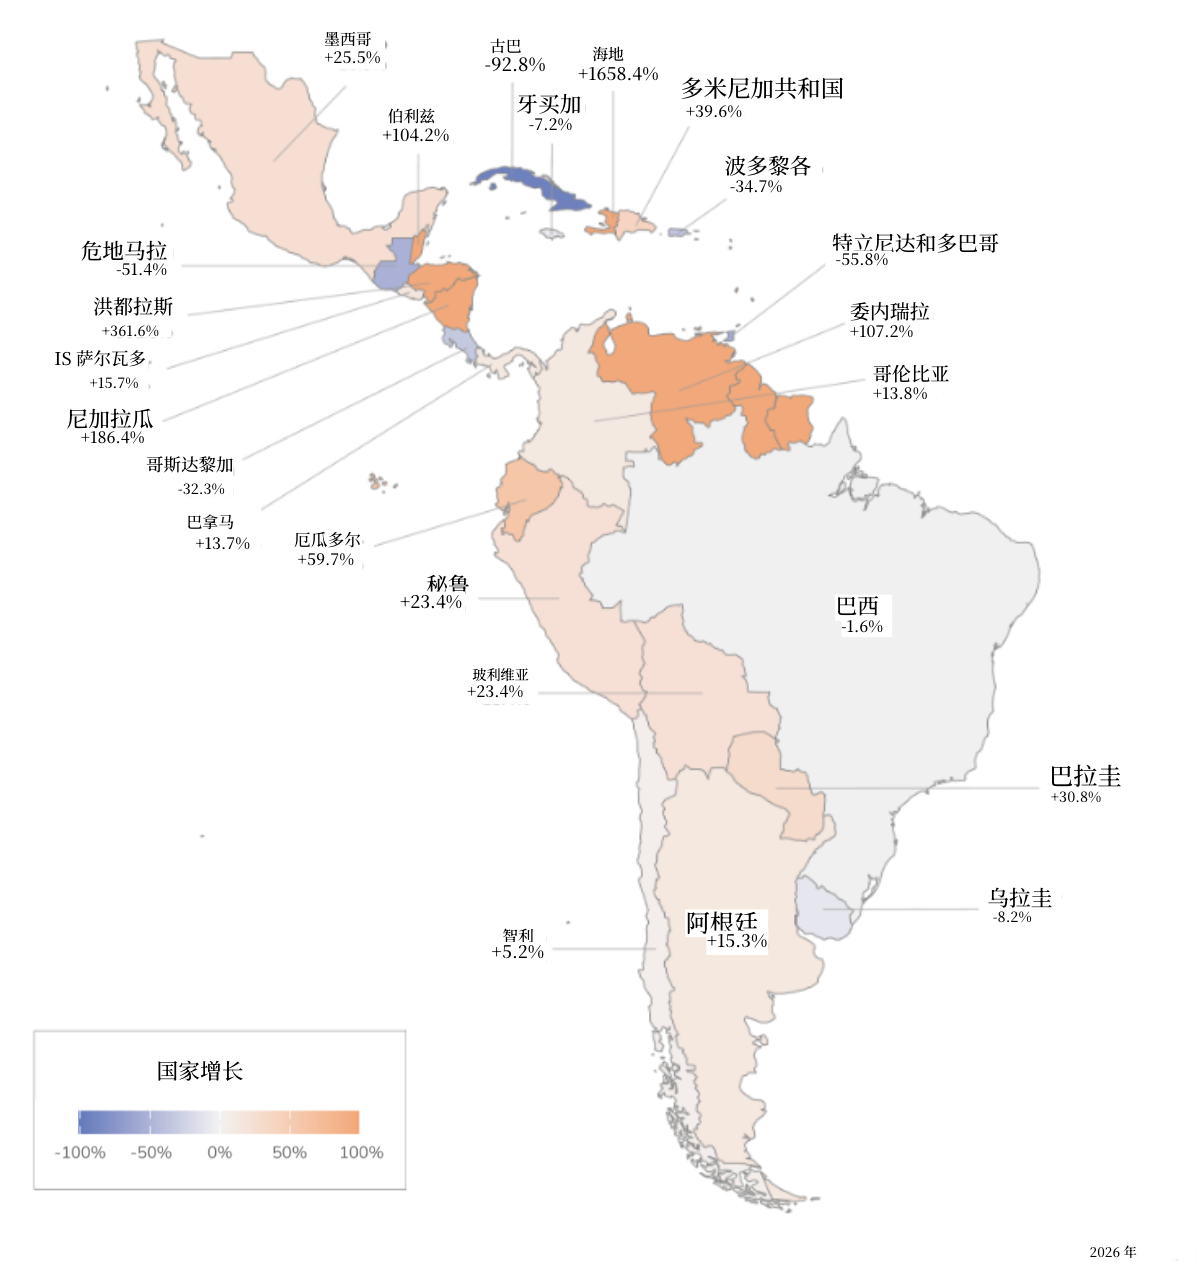
Latin America: $593.8 Billion, Growth 9.8%
Latin America is the sixth largest regional economy globally and the second fastest-growing region. The growth is not driven by Brazil — Brazil itself contracted by 1.6%, but the growth of Mexico (+25.5%), Argentina (+15.3%), Colombia (+13.8%), and Venezuela (+107.2%) is enough to offset and surpass that. Honduras grew by 361.6%, Nicaragua by 186.4%, although from a small base. Ben Reid, the global stablecoin leader at Bitso, summed up Latin America's demand as a "threefold condition": persistent inflation, exchange rate fluctuations, and restrictive capital controls, all pushing households and enterprises towards crypto assets.
Stablecoins are expanding systematically across dimensions in Latin America: as of June 2026, stablecoins account for 32.1% of cross-border value, 22.1% of domestic P2P, and 17.6% of personal wallet balances. Mexico’s quarterly stablecoin service inflows reached $8.4 billion in Q2 2026, more than eight times that of the same period in 2021. Meanwhile, the custody structure in Latin America is shifting from self-custody to service platforms: self-custody balances decreased by 66.7%, while service platform balances dropped by 28.0%; the share of crypto balance held by service platforms in Latin America rose to 71.2%, above the global 68.0%. This indicates that adoption in Latin America is not merely about "self-custody risk aversion," but is gradually embedding in local service ecosystems, with the platform trend reinforcing the demand for stablecoin payments.
Brazil: Largest Total, but Not the Growth Engine
Brazil accounts for $252.5 billion, or 43.7%, of Latin America's total, significantly up from 31.6% in 2022, nearing half of the region's crypto value. However, in terms of performance during the statistical period, Brazil contracted by 1.6% and is not the source of regional growth; Latin America's 9.8% growth is driven by Mexico, Argentina, Colombia, and Venezuela.
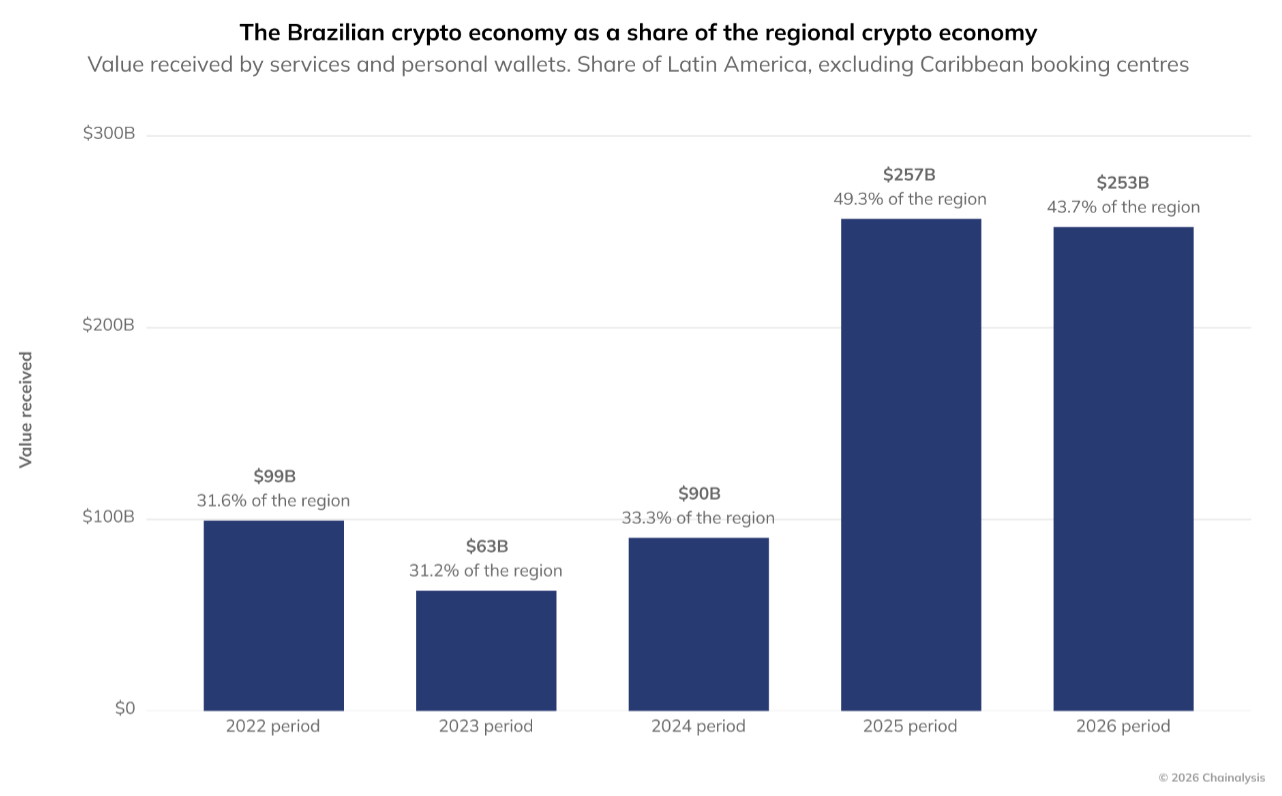
Brazil's share of the cryptocurrency economy in the region, excluding the Caribbean booking center's share in Latin America
Extending the timeline, Brazil's crypto economy expanded by a cumulative 179.4% from the 2024 statistical period to the end of the 2026 statistical period; the short-term adjustment does not alter the long-term trajectory. There is also a noteworthy structural change within the Brazilian market: the share of domestic platforms rose from a mere 1.5% of inflows to 12.5%, while other countries in Latin America generally saw their local platform shares eroded by international platforms. The timing of this migration speeds up coincided with the regulatory reshaping: in February 2026, Brazil's central bank introduced new regulations for virtual asset service providers covering governance, risk management, security, and compliance, along with substantive minimum capital requirements. The rules are aimed at strengthening the market, but higher thresholds may push for industry consolidation — the insight of Fabricio Tota, vice president of crypto affairs at Mercado Bitcoin, is that in 12 months, there will be “far fewer crypto-native players.” Therefore, Brazil's case has dual implications: it is both the volume center with the highest overall adoption index and an observational sample where regulatory tightening and market concentration occur simultaneously.
Sub-Saharan Africa: Fastest Growth in the World, 13.4%
Sub-Saharan Africa leads globally with a growth rate of 13.4%, driven by “exceptionally strong P2P activity.” Nigeria ranks first globally in the P2P dimension within the adoption index, first in the cross-border dimension, and third overall. The growth model in this region contrasts with that of Latin America: while Latin America relies on stablecoins for cross-border and savings demand, Africa relies on domestic P2P and small cross-border transfers, both indicating the alternative infrastructure function of stablecoins in unstable monetary environments. The structural significance of Africa is that it brings the global judgment that “P2P is not a trading exchange remnant” to the forefront: when local banking, foreign exchange, and payment channels are costly or inaccessible, transfers between personal wallets using stablecoins form a payment network in themselves. Nigeria also leads in both domestic P2P and cross-border flows, showing that crypto activity in this region is driven by local value transfer and parallel cross-border settlements rather than solely speculation.
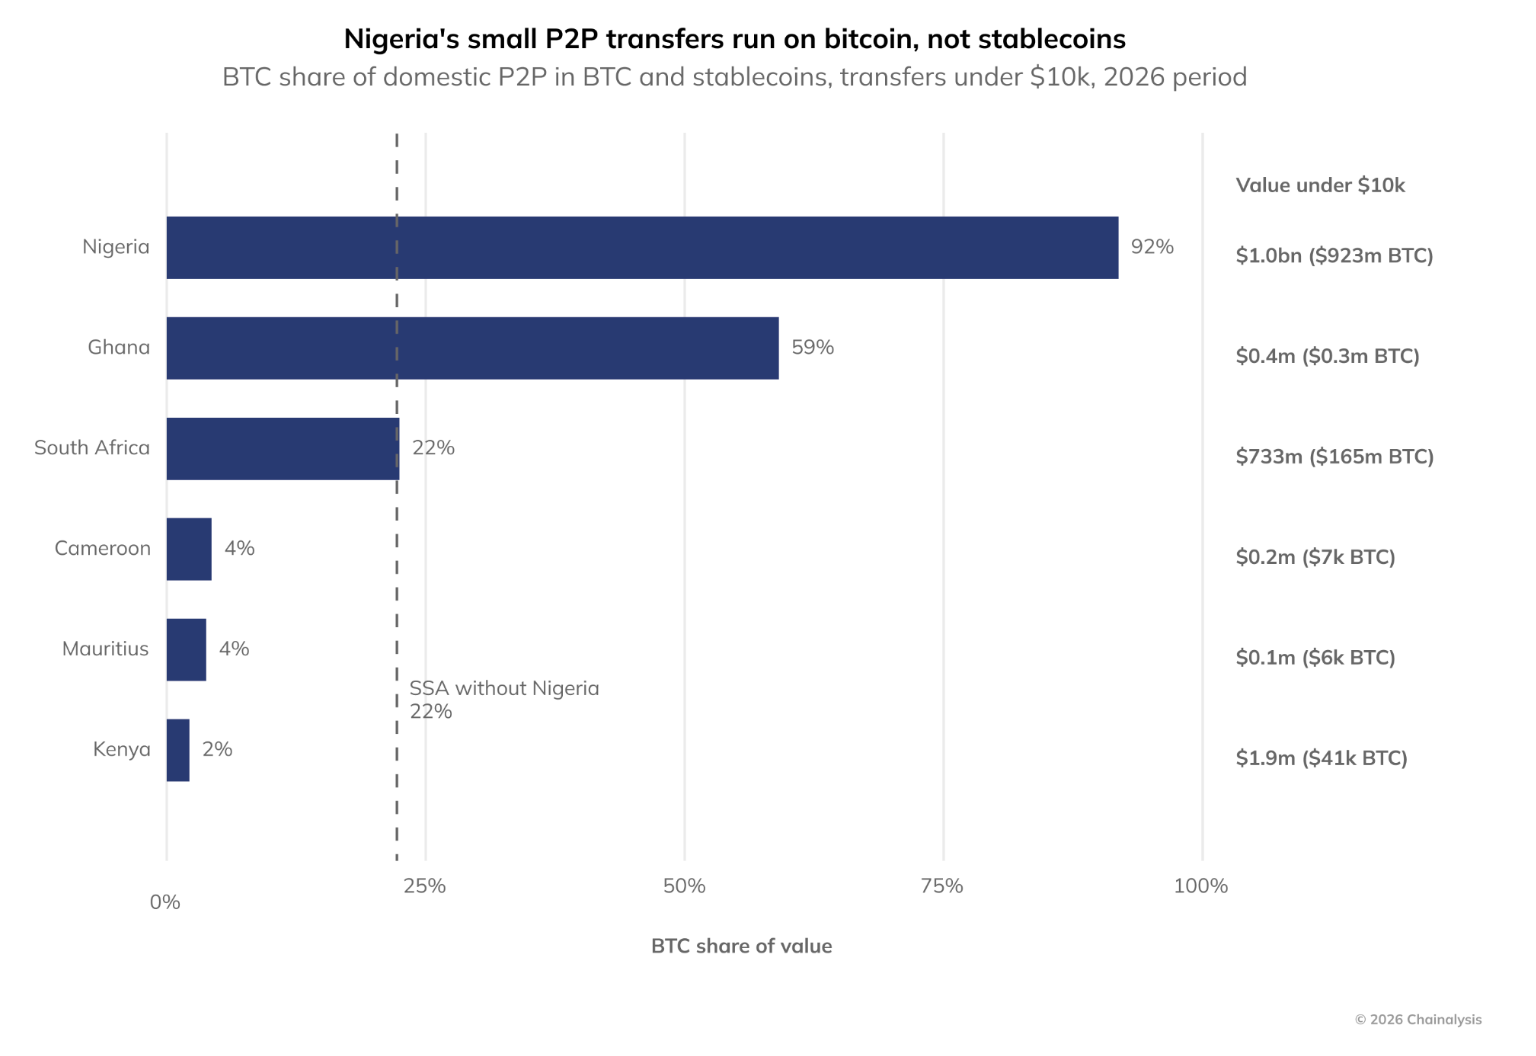
In the 2026 statistical period, Bitcoin accounts for as much as 92% of small local wallet transactions under $10,000 in Nigeria, far exceeding the 22% average in other regions of Sub-Saharan Africa, indicating that local small P2P transfers primarily rely on Bitcoin rather than stablecoins.
North America: $3.02 Trillion, Down 1.9%
North America remains the largest regional economy globally. The U.S. has $2.78 trillion, and Canada has $247.7 billion with a counter-trend growth of 2.3%. The structural role of North America is summarized in the report as “the U.S. builds infrastructure, and the world absorbs practical demand”: the U.S. holds the most on-chain assets, but ranks only 20th in the P2P dimension and 11th in cross-border — its volume comes from services and balances, not from grassroots daily transfers. The U.S. holds 88.1% of the share in AI agent payments and model inference while being a net importer of Bitcoin and net exporter of the digital dollar. Canada, driven by immigrants’ rigid remittance demands, becomes the largest P2P crypto economy in the G7, with cross-border stablecoin remittances growing by 141%. Therefore, North America displays a “dual structure”: one layer is the service, balance, and infrastructure output dominated by the U.S., while another layer is driven by P2P and cross-border stablecoin demand from Canada’s immigrant remittances. Both indicate that crypto activity in developed markets is not solely investment-driven; rather, their payment demands appear more in the form of cross-border remittances and infrastructure services.
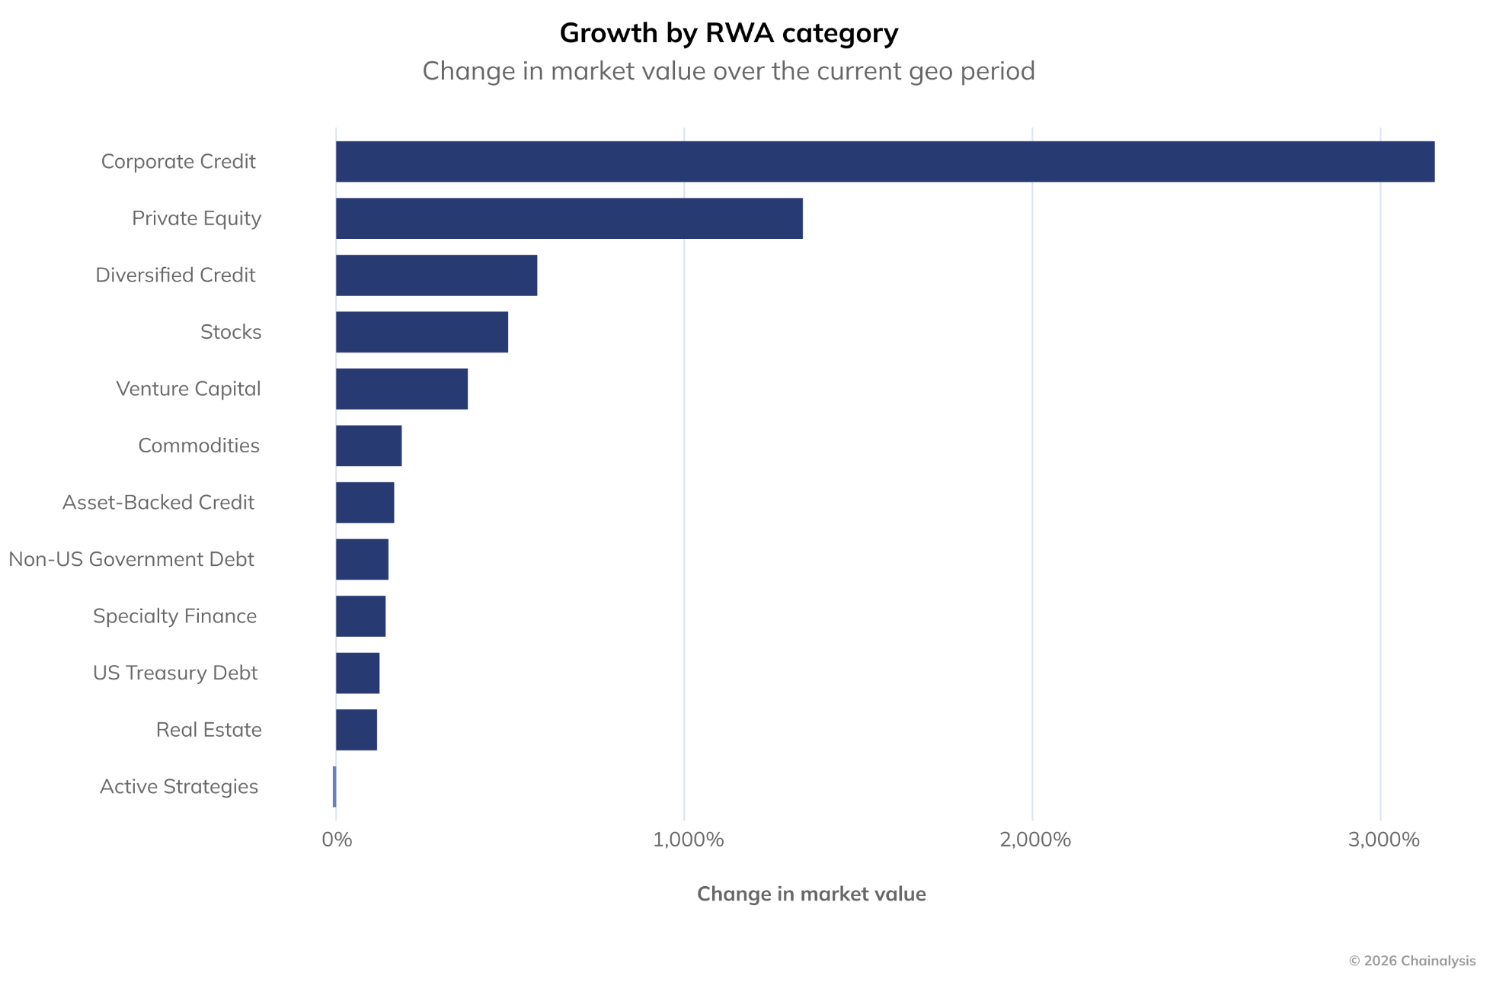
The market capitalization increase of tokenized real-world assets (RWA) in the U.S. varies greatly, with corporate credit growth leading by a wide margin, followed by private equity, while the growth rates for U.S. treasury, real estate, and actively managed strategies are relatively low.
Eastern Europe: $642.1 Billion, Down 7.9%, the Largest Decline Among Regions
Russia accounts for approximately 44% of the total in this region, with activity dropping by 14.7%. Ukraine is a structural exception: it received $12 billion in cross-border stablecoin transfers, with $2.41 billion for retail; small transfers accounted for 13.1% of service inflows in the region, the highest globally; the volume of crypto ATM transactions nearly doubled. Ukraine ranks seventh in the adoption index, rising one position from the previous year. The decline in Eastern Europe is primarily driven by Russia, while Ukraine's influx of stablecoins under war conditions demonstrates the resilience of crypto as a channel for cross-border aid and value transfers. The internal differentiation in this region, therefore, is very stark: on one hand, Russia's activity contraction pulls down the overall regional total, while on the other hand, Ukraine maintains high-intensity daily value transfers through retail-level stablecoin inflows, small transfers, and crypto ATM usage. Eastern European data remind readers that an overall regional decline does not equate to a downturn in usage across all countries; war and monetary environments can push the same region toward completely different adoption paths.
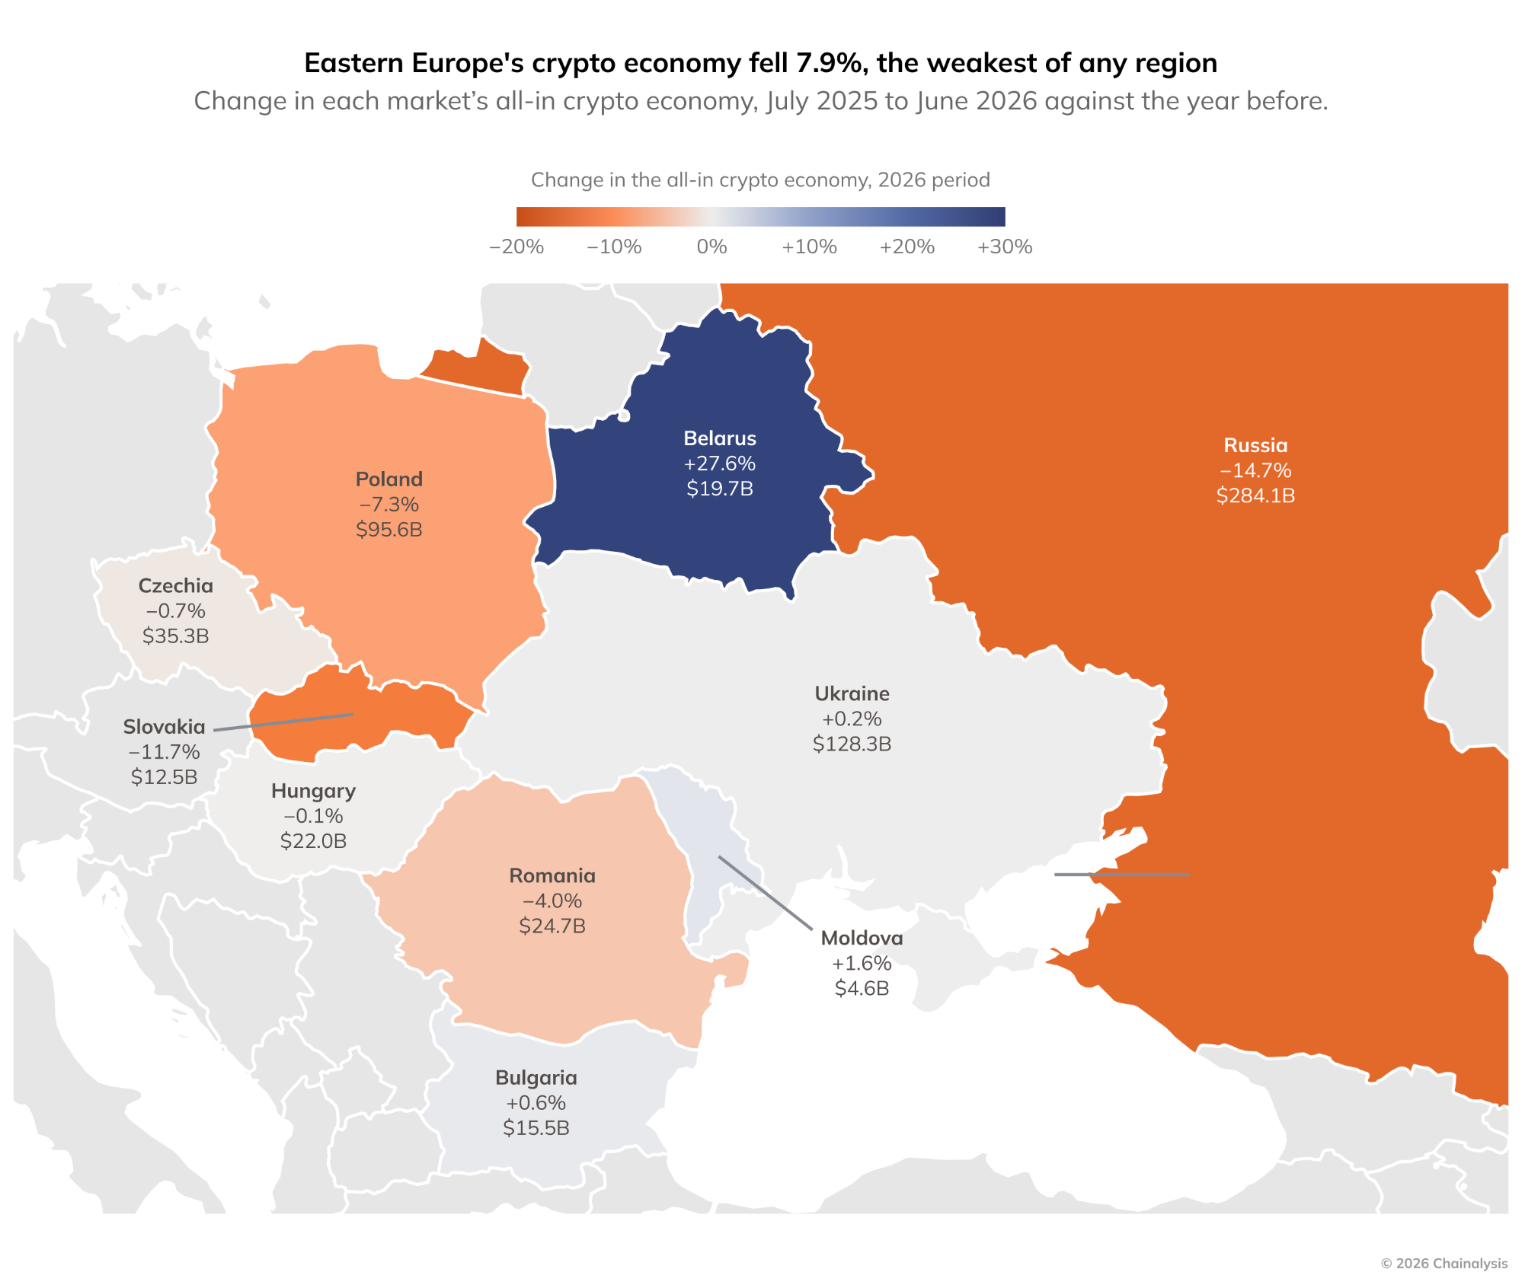
From July 2025 to June 2026, Eastern Europe's crypto economy overall declined by 7.9%, the worst performance among all regions, with clear internal differentiation: Belarus grew by 27.6%, while countries like Russia, Slovakia, and Poland significantly contracted, and Ukraine, Moldova, and Bulgaria saw slight increases.
East Asia: Over $1.2 Trillion
South Korea leads with $449.1 billion (12.3% year-on-year growth), followed by Japan at $228.3 billion, Hong Kong at $192.2 billion, mainland China at $176.3 billion, and Taiwan at $140.4 billion. South Korea ranks fifth in the overall adoption index and second globally in the balance dimension. East Asia's structural characteristic is "high balance, high service inflow, low P2P" — in stark contrast to emerging markets where crypto economies are more driven by investments and platform services rather than daily payments. South Korea's second global ranking in balance dimension indicates that the scale of assets held in addresses and services is prominent; Japan, Hong Kong, mainland China, and Taiwan collectively form a market group centered on service platforms and investment activities. East Asia mirrors Africa and Latin America: the former excels in balances and service inflows, while the latter excels in P2P and cross-border stablecoins. The “dual-track” structure of the global crypto economy is most clearly evident in the contrast between East Asia and emerging markets.
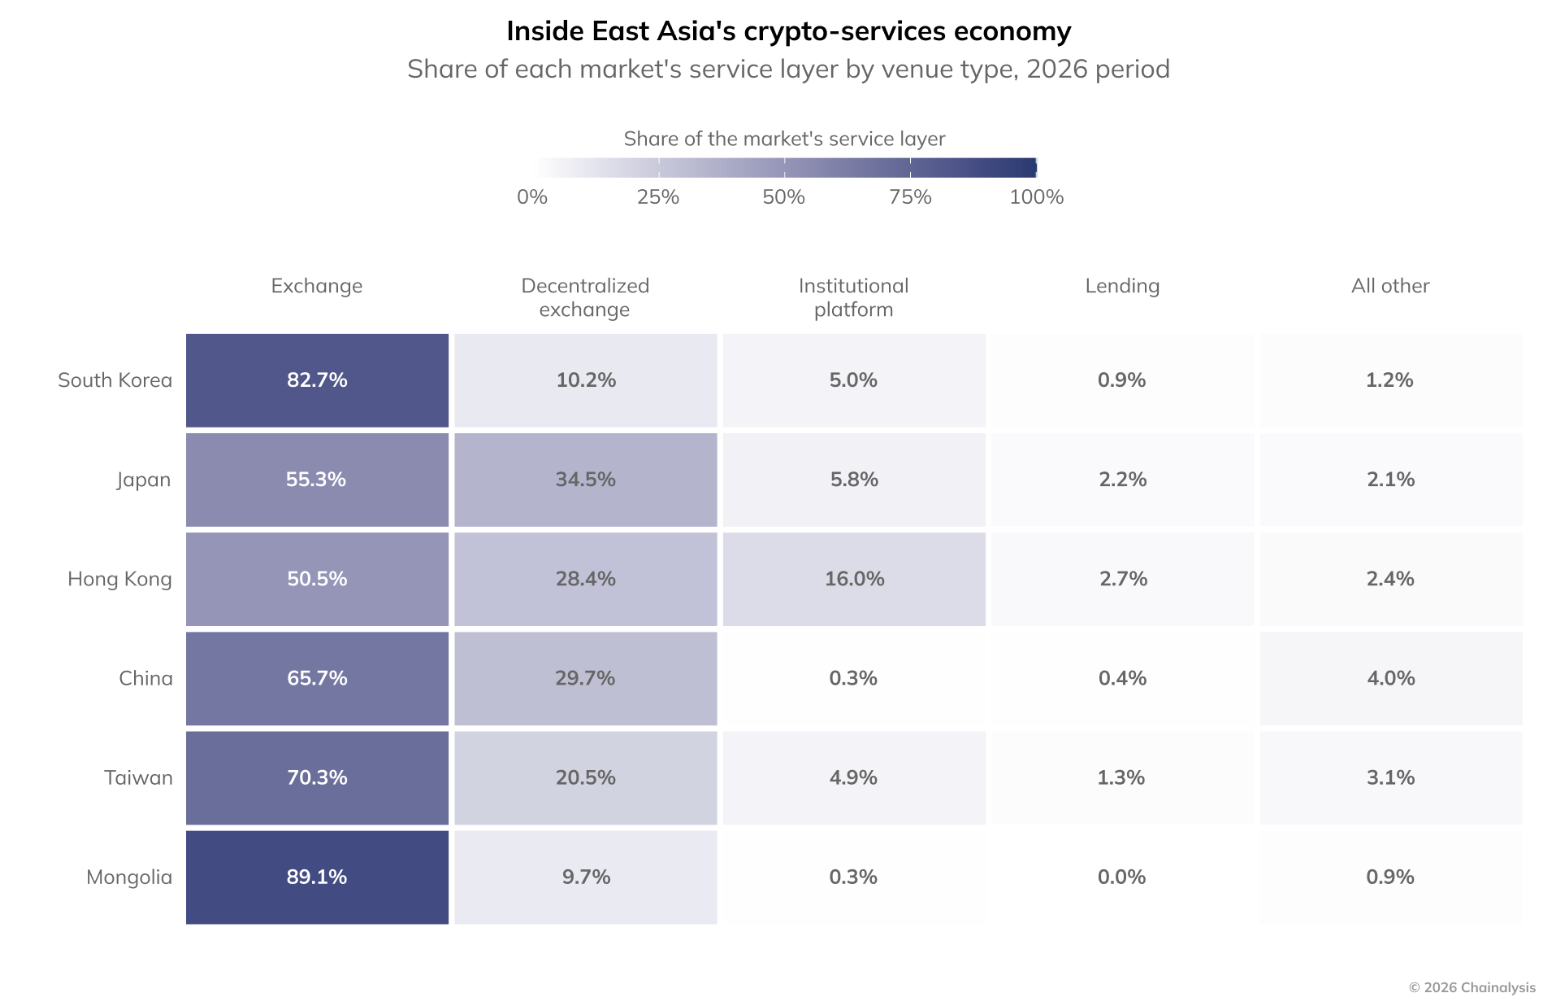
In the structure of the East Asian crypto service market during the 2026 statistical period, centralized exchanges generally dominate; among them, Hong Kong institutional platforms have a significantly higher share than other economies in the region, while Japan's decentralized exchange share is relatively prominent, and Mongolia and South Korea have the highest dependency on centralized exchanges.
Middle East and North Africa: $443.3 Billion, Essentially Flat (-1.4%)
The UAE grew by 32% to $10.48 billion; Turkey remains the largest market in the region at $144.5 billion. There is significant internal differentiation in this region: Turkey's high inflation drives savings-demand, while the UAE capitalizes on regulatory friendliness and capital inflows to become a regional growth hub. MENA's total is essentially flat, but the two largest markets internally are taking different paths: Turkey excels in scale, with a regional largest size of $144.5 billion corresponding to savings and value preservation demands under inflation; the UAE excels in growth, with a 32% increase and $10.48 billion reflecting regulatory friendliness, capital inflows, and the concentration of service platforms. The regional total masks this differentiation of "Turkey stabilizing scale, UAE driving growth."
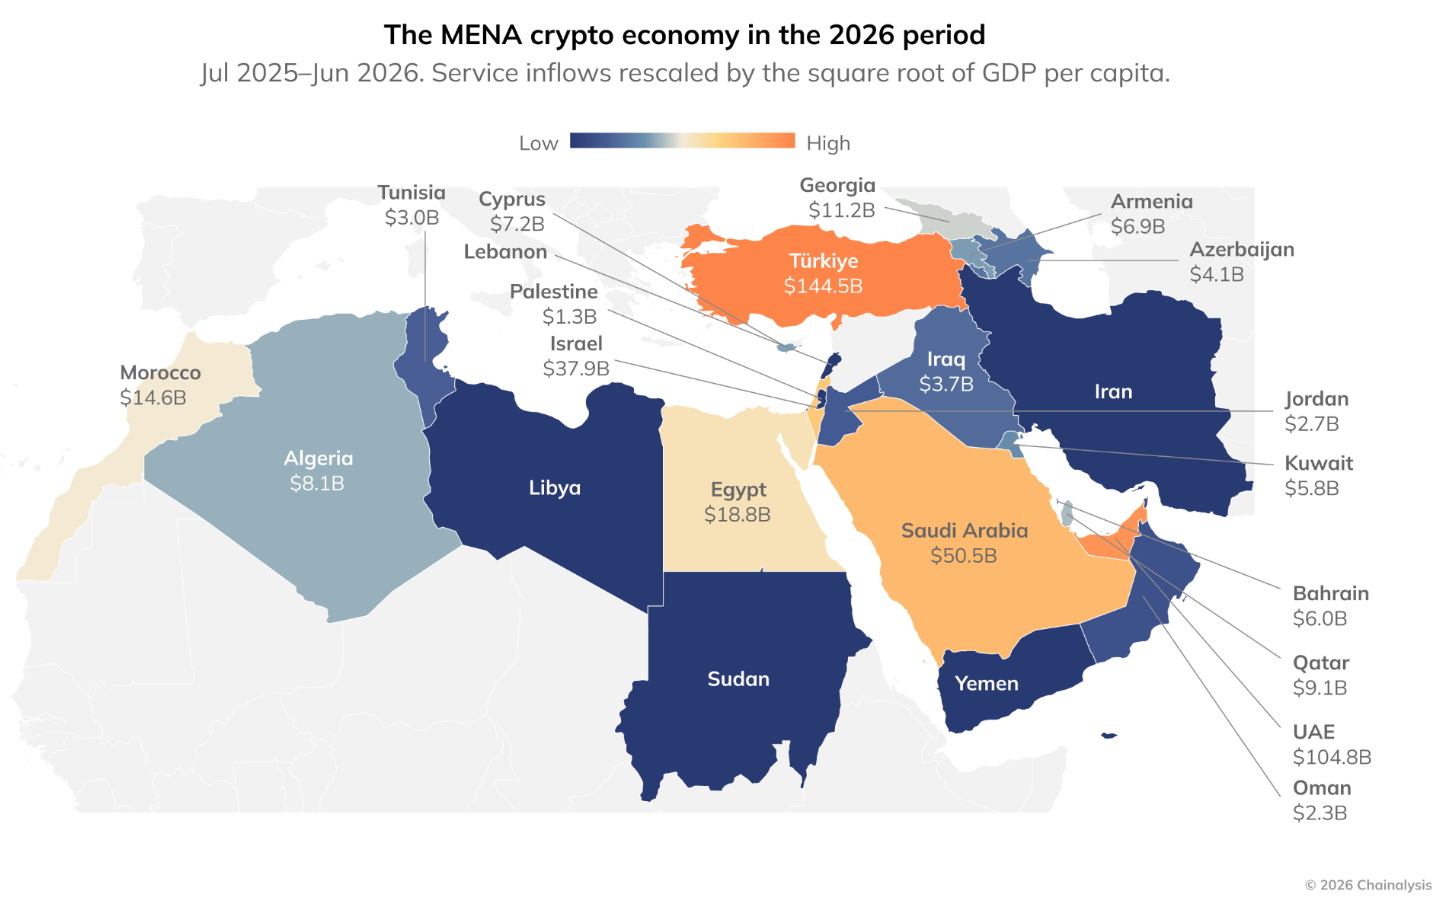
From July 2025 to June 2026, in the Middle East and North Africa region, the amount of crypto service inflows adjusted for per capita GDP square root shows that Turkey has the highest scale, followed closely by the UAE and Saudi Arabia, with significant differences in crypto economic activity levels across countries in the region.
Central Asia, Southeast Asia, and Oceania: India $135 Billion, Contraction 14.7%
India's crypto economy contracted by 14.7%, but inflows to centralized exchanges still reached $88.4 billion, ranking first in the region; the market share of local compliant platforms plummeted from about 7% to 0.7%, with a 1% TDS tax burden pushing transactions toward offshore locations. The South Asian case illustrates that taxes and compliance costs can swiftly change the country distribution of on-chain activities, while India's high exchange inflows and low local platform shares coexisting are direct evidence of this migration. India remains the core market in South Asia, but its activity is shifting from local compliant platforms to offshore locations: $88.4 billion in inflows to centralized exchanges indicates that demand has not disappeared, while the sharp drop from 7% to 0.7% in local platform shares indicates a shift on the supply side. Hence, South Asia provides the clearest example in the global regional landscape of "regulatory and tax changes altering geographical distributions."
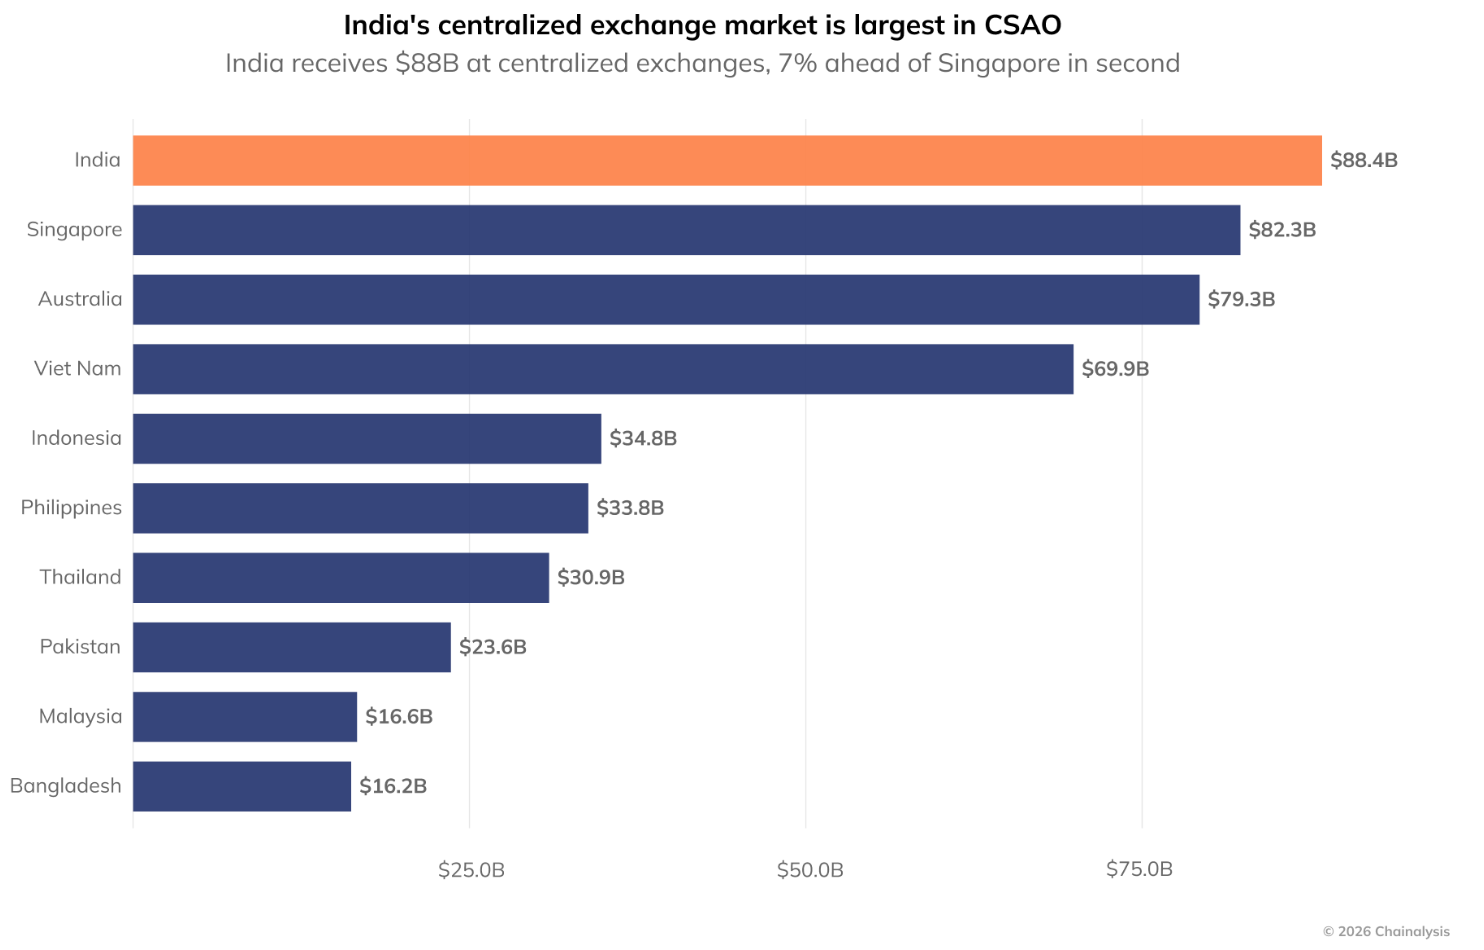
In the ranking of inflows to centralized exchanges in the region, India ranks first at $88.4 billion, exceeding the second-ranked Singapore by 7%, with Australia and Vietnam following closely.
Western Europe: $2.08 Trillion, Growth 1.2%
Western Europe is the third of the three regions with positive growth, second only to North America in scale. Although its growth rate is small, it remains counter-cyclical in the context of a global slight decline, contrasting sharply with Eastern Europe’s deep contraction. The significance of Western Europe lies not in its growth rate, but in its volume and stability: the $2.08 trillion regional economy has maintained positive growth following the gradual implementation of regulatory frameworks like MiCA, indicating that crypto activities in a mature regulatory environment can contract without fully following price cycles. Compared to Eastern Europe’s -7.9%, Western Europe’s +1.2% further reinforces the theme of “regional differentiation”: the stark differences between the eastern and western sides of the same continent regarding regulatory certainty, capital flow, and market structure are directly reflected in the direction of change in the on-chain economy.
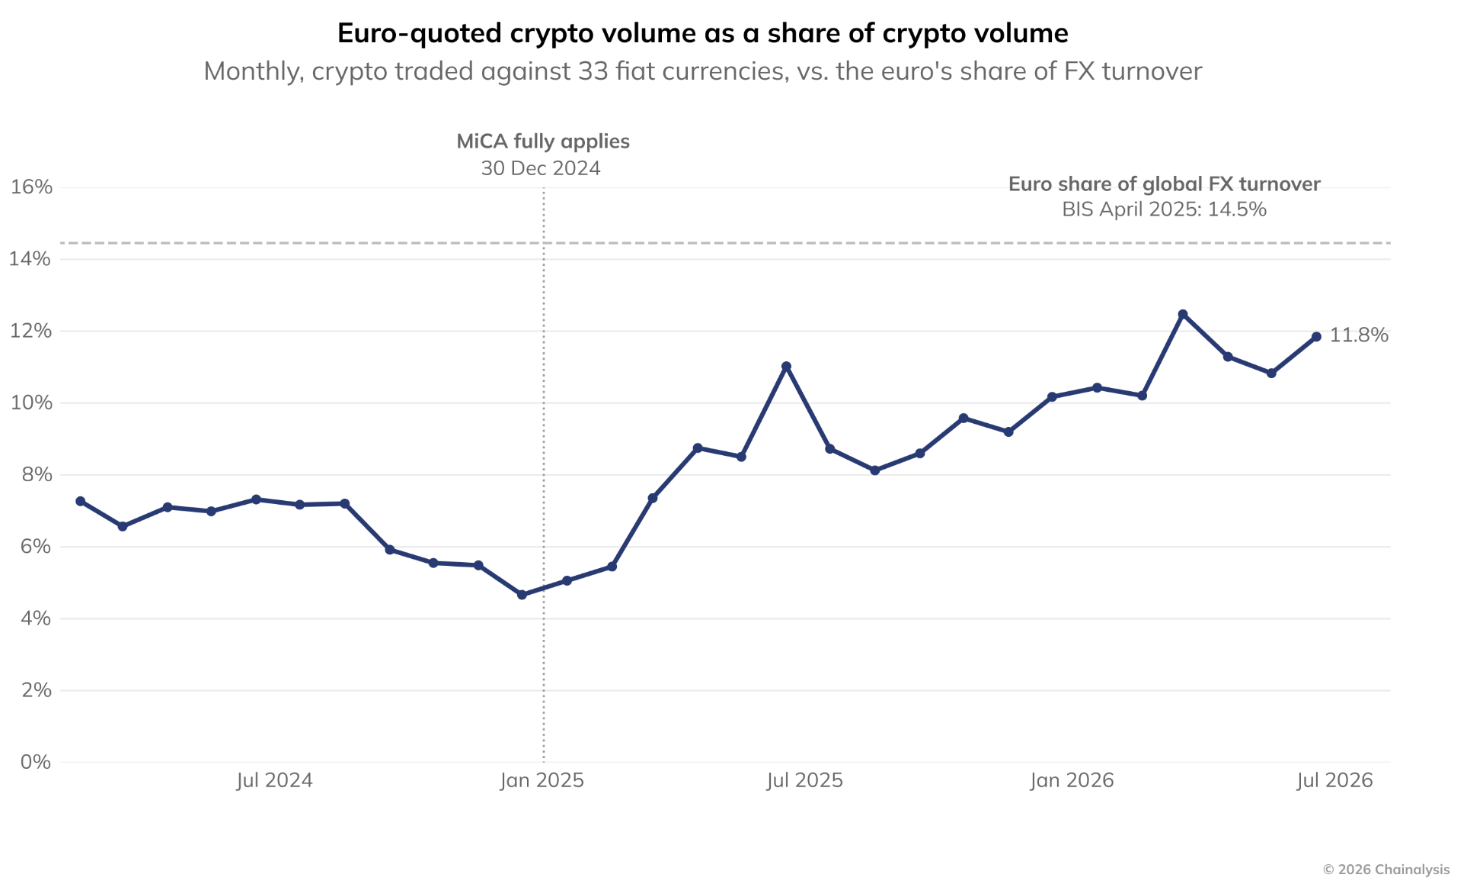
Since the full implementation of MiCA in December 2024, the proportion of euro-denominated crypto trading volumes has continued to recover, yet as of July 2026, the 11.8% remains below the euro's 14.5% share in the global foreign exchange market.
Conclusion
The core judgment of the 2026 geographical report can be distilled into a structural proposition: the crypto economy is decoupling from price cycles, and the mechanism of this decoupling is the payment and value transfer functions carried by stablecoins and P2P.
A halving of market cap by 50% while the on-chain economy only contracted by 1.6% is not a coincidence in statistical measures, but because nearly half of the activity — 96% of stablecoins in P2P, daily payments averaging $3,000 in cross-border transfers, and stablecoin balances remaining unchanged during a nine-month decline — do not depend on price for transfer.
The regional landscape further illustrates that this decoupling is not uniformly occurring: Latin America and Africa are expanding with stablecoin cross-border and P2P, North America excels in infrastructure and balances, East Asia is characterized by high balances, high services, and low P2P, Eastern Europe is seeing stark divergence between Russia's contraction and Ukraine's stablecoin inflow, and South Asia showcases how taxes can swiftly alter platform geography.
Brazil's ascent to the top, the reverse growth of Latin America and Africa, Ukraine's stablecoin inflow under war conditions, and the opening of 4,708 new channels point to a geography of adoption dominated by emerging markets: where crypto's primary identity is not as an alternative investment but as an alternative to monetary infrastructure. The sustainability of this shift will depend on the quality of execution of stablecoin regulatory frameworks and the evolution of emerging markets’ domestic currency environments, but data from 2026 already provides a phased answer: as the price narrative retreats, the usage narrative stands firm.
Notes
The adoption index measures four equal-weighted dimensions — service inflows, domestic P2P, cross-border flows, and on-chain balances across 117 countries, taking the geometric mean to reward balanced performance; Brazil ranks first, the U.S. second, Nigeria third, Japan fourth, and South Korea fifth. Methodologically, the report clarifies its global crypto economic measurement systematically underestimates real activities: transfers counted only include stablecoins and smaller Bitcoin transfers outside the service layer, while transfers that cannot be reliably attributed to countries are excluded rather than estimated, with personal wallet data beginning in July 2021; cross-border metrics only count transfers that can be attributed to both sending and receiving countries, thus the $220.3 billion should be understood as a floor rather than a ceiling; each transfer is counted only once at the destination, not double-counted. These clarifications do not change the core judgments but remind readers: $9.4 trillion is a lower limit, and the real activity scale is even higher.
免责声明:本文章仅代表作者个人观点,不代表本平台的立场和观点。本文章仅供信息分享,不构成对任何人的任何投资建议。用户与作者之间的任何争议,与本平台无关。如网页中刊载的文章或图片涉及侵权,请提供相关的权利证明和身份证明发送邮件到support@aicoin.com,本平台相关工作人员将会进行核查。


