The issue is not whether the next infrastructure failure will occur, but when it will happen and what the triggering factors are.
Written by: YQ
Translated by: AididiaoJP, Foresight News
Amazon Web Services has once again experienced a significant outage, severely impacting crypto infrastructure. The AWS issues in the US East region (Northern Virginia data center) caused Coinbase and dozens of other major crypto platforms, including Robinhood, Infura, Base, and Solana, to go down.
AWS has acknowledged an "increased error rate" affecting Amazon DynamoDB and EC2, which are core database and computing services relied upon by thousands of companies. This outage provides immediate and vivid validation of the central argument of this article: the reliance of crypto infrastructure on centralized cloud service providers creates systemic vulnerabilities that repeatedly manifest under stress.
The timing is starkly instructive. Just ten days after a $19.3 billion liquidation chain event exposed infrastructure failures at the exchange level, today’s AWS outage indicates that the problem extends beyond a single platform to the foundational layer of cloud infrastructure. When AWS fails, the cascading effects simultaneously impact centralized exchanges, "decentralized" platforms with centralized dependencies, and countless other services.
This is not an isolated incident but a pattern. The following analysis documents similar AWS outage events that occurred in April 2025, December 2021, and March 2017, each leading to major crypto service disruptions. The issue is not whether the next infrastructure failure will occur, but when it will happen and what the triggering factors are.
Case Study: October 10-11, 2025 Liquidation Chain Event
The October 10-11, 2025 liquidation chain event provides an instructive case study of the infrastructure failure pattern. At 20:00 UTC, a significant geopolitical announcement triggered a market-wide sell-off. Within an hour, $6 billion was liquidated. By the time the Asian markets opened, $19.3 billion in leveraged positions had evaporated across 1.6 million trader accounts.
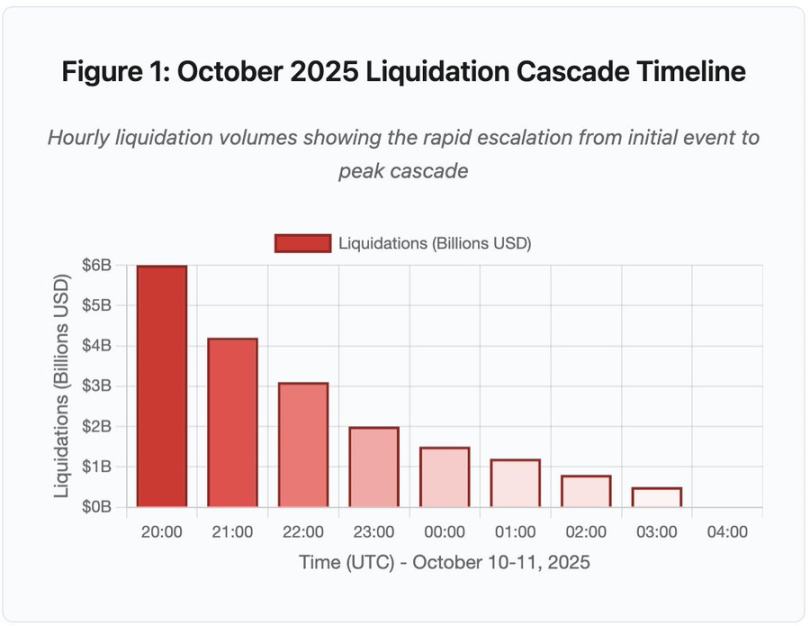
Figure 1: Timeline of the October 2025 Liquidation Chain Event
This interactive timeline graph shows the dramatic progression of liquidation amounts by the hour. In the first hour alone, $6 billion evaporated, followed by an even more severe acceleration in the second hour of the chain reaction. The visualization shows:
20:00-21:00: Initial shock - $6 billion liquidated (red area)
21:00-22:00: Peak of the chain reaction - $4.2 billion, at which point API rate limiting began
22:00-04:00: Continued deterioration - $9.1 billion liquidated in a thin market
Key turning point: API rate limiting, withdrawal of market makers, thinning order books
Its scale is at least an order of magnitude larger than any previous crypto market event, and historical comparisons illustrate the step-function nature of this event:
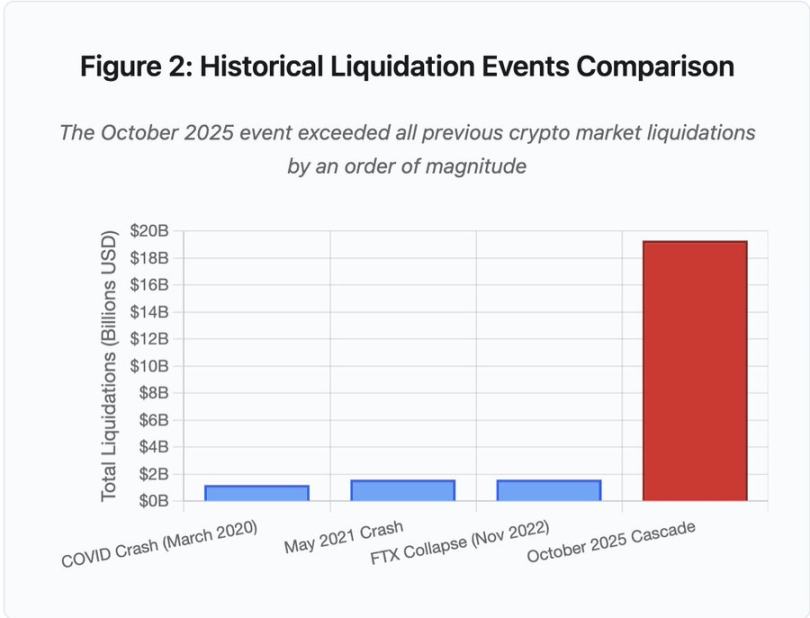
Figure 2: Historical Comparison of Liquidation Events
The bar chart dramatically illustrates the prominence of the October 2025 event:
March 2020 (COVID): $1.2 billion
May 2021 (Crash): $1.6 billion
November 2022 (FTX): $1.6 billion
October 2025: $19.3 billion, 16 times larger than previous records
But the liquidation numbers tell only part of the story. The more interesting question concerns the mechanisms: how did external market events trigger this specific failure pattern? The answer reveals systemic weaknesses in the infrastructure of centralized exchanges and the design of blockchain protocols.
Off-Chain Failures: Centralized Exchange Architecture
Infrastructure Overload and Rate Limiting
Exchanges implement rate limiting on their APIs to prevent abuse and manage server load. During normal operations, these limits allow legitimate trading while blocking potential attacks. During extreme volatility, when thousands of traders attempt to adjust positions simultaneously, these same rate limits become bottlenecks.
CEX limits liquidation notifications to one order per second, even while processing thousands of orders per second. During the October chain event, this caused opacity. Users could not ascertain the real-time severity of the chain reaction. Third-party monitoring tools showed hundreds of liquidations per minute, while official data sources reported far fewer.
API rate limiting prevented traders from modifying positions during the critical first hour, with connection requests timing out and order submissions failing. Stop-loss orders failed to execute, and position queries returned outdated data, turning a market event into an operational crisis.
Traditional exchanges configure infrastructure with a safety margin for normal loads. However, normal loads are vastly different from stress loads, and average daily trading volumes do not predict peak pressure demands well. During the chain event, trading volumes surged by 100 times or more, with position data queries increasing by 1000 times as each user checked their accounts simultaneously.
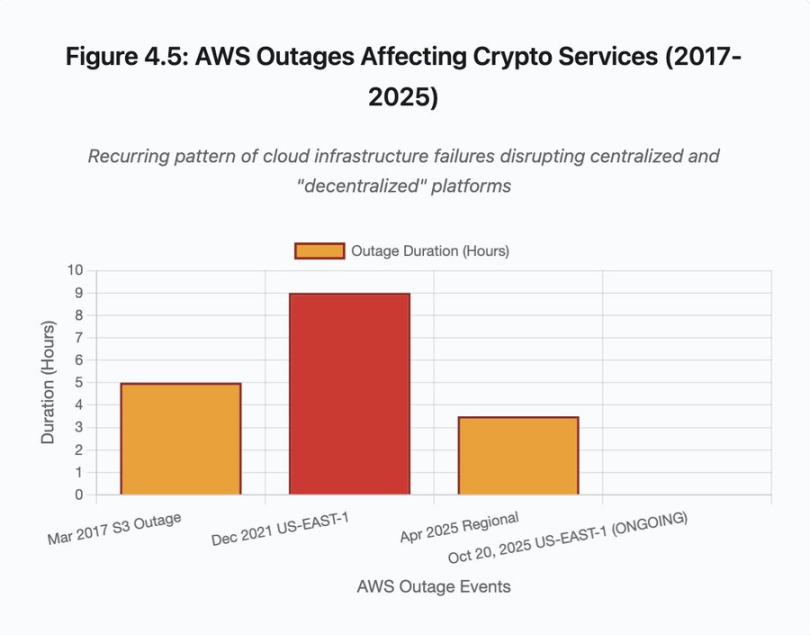
Figure 4.5: Impact of AWS Outage on Crypto Services
Auto-scaling cloud infrastructure helps, but cannot respond instantly; launching additional database read replicas takes minutes. Creating new API gateway instances also takes minutes. During those minutes, the margin system continued to mark position values based on corrupted price data from the overloaded order book.
Oracle Manipulation and Pricing Vulnerabilities
During the October chain event, a key design choice in the margin system became apparent: some exchanges calculated collateral values based on internal spot market prices rather than external oracle data streams. Under normal market conditions, arbitrageurs maintain price consistency across different venues. However, when infrastructure is under stress, this coupling can break.
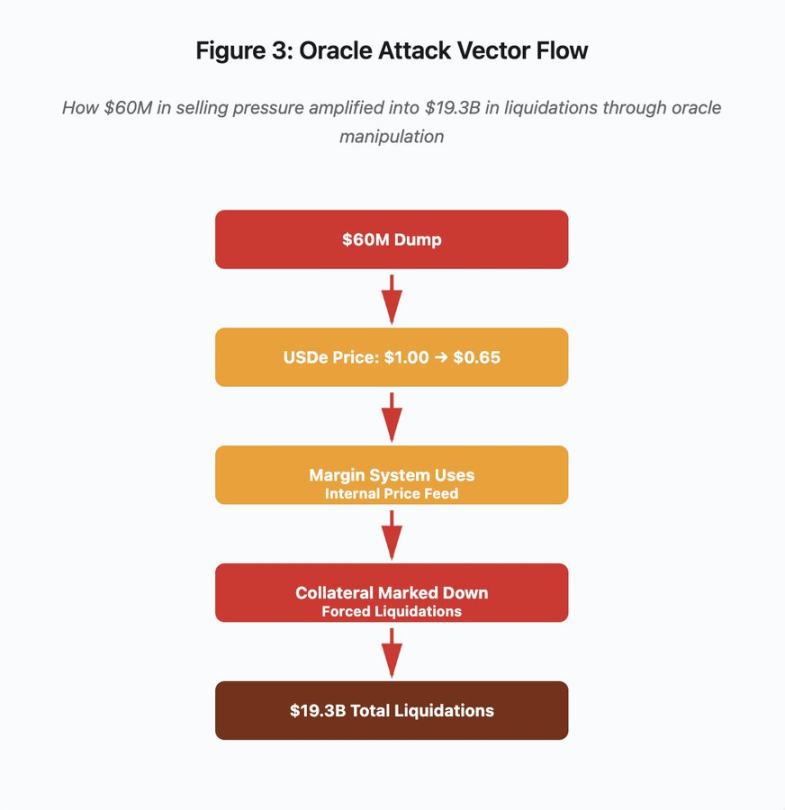
Figure 3: Oracle Manipulation Flowchart
This interactive flowchart visualizes the five stages of the attack vector:
Initial sell-off: $60 million sell pressure applied to USDe
Price manipulation: USDe plummets from $1.00 to $0.65 on a single exchange
Oracle failure: Margin system uses corrupted internal price data stream
Chain trigger: Collateral is undervalued, forced liquidations begin
Amplification: Total of $19.3 billion liquidated (amplified by 322 times)
The attack exploited Binance's use of spot market prices for wrapped synthetic collateral. When attackers dumped $60 million of USDe into a relatively thin order book, the spot price plummeted from $1.00 to $0.65. The margin system, configured to mark collateral at spot prices, revalued all USDe-collateralized positions down by 35%. This triggered margin calls and forced liquidations across thousands of accounts.
These liquidations forced more sell orders into the same illiquid market, further driving down prices. The margin system observed these lower prices and marked more positions' values, creating a feedback loop that amplified the $60 million sell pressure into $19.3 billion in forced liquidations.
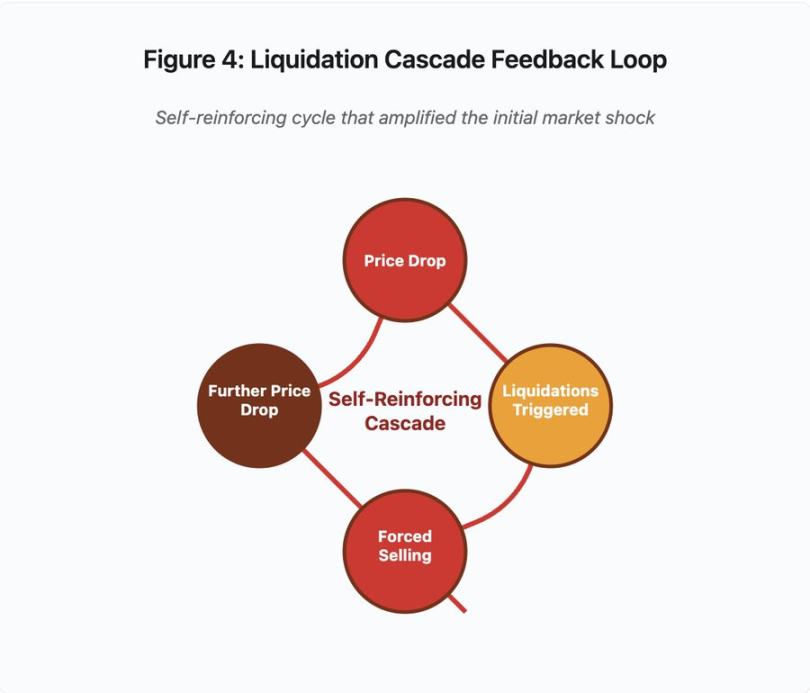
Figure 4: Liquidation Chain Feedback Loop
This cyclical feedback diagram illustrates the self-reinforcing nature of the chain reaction:
Price drops → Triggers liquidation → Forced selling → Price drops further → [Repeat cycle]
If a well-designed oracle system had been in place, this mechanism would not have worked. If Binance had used a time-weighted average price (TWAP) across multiple exchanges, instantaneous price manipulation would not have affected collateral valuation. If they had used aggregated price data streams from Chainlink or other multi-source oracles, the attack would have failed.
The wBETH incident four days prior showcased similar vulnerabilities. wBETH should maintain a 1:1 exchange rate with ETH. During the chain event, liquidity dried up, and the wBETH/ETH spot market showed a 20% discount. The margin system correspondingly lowered the valuation of wBETH collateral, triggering liquidations of positions that were actually fully collateralized by underlying ETH.
Automatic Deleveraging (ADL) Mechanism
When liquidations cannot be executed at current market prices, exchanges implement automatic deleveraging (ADL) to distribute losses among profitable traders. ADL forcibly closes profitable positions at current prices to cover the gap left by liquidated positions.
During the October chain event, Binance executed ADL across multiple trading pairs. Traders holding profitable long positions found their trades forcibly closed, not due to their own risk management failures, but because other traders' positions became insolvent.
ADL reflects a fundamental architectural choice in centralized derivatives trading. Exchanges ensure they do not lose money. This means that losses must be borne by one or more of the following parties:
Insurance fund (capital set aside by the exchange to cover liquidation gaps)
ADL (forcing profitable traders to close positions)
Socialized losses (distributing losses among all users)
The size of the insurance fund relative to the size of open contracts determines the frequency of ADL. Binance's insurance fund totaled about $2 billion in October 2025. Relative to the $4 billion in open contracts for BTC, ETH, and BNB perpetual contracts, this provided a 50% coverage. However, during the October chain event, the total open contracts across all trading pairs exceeded $20 billion. The insurance fund could not cover the gap.
After the October chain event, Binance announced that when total open contracts remain below $4 billion, they guarantee that BTC, ETH, and BNB USDⓈ-M contracts will not experience ADL. This created an incentive structure: exchanges could maintain a larger insurance fund to avoid ADL, but this would tie up capital that could otherwise be deployed profitably.
On-Chain Failures: Limitations of Blockchain Protocols
The bar chart compares downtime across different events:
Solana (February 2024): 5 hours - Voting throughput bottleneck
Polygon (March 2024): 11 hours - Validator version mismatch
Optimism (June 2024): 2.5 hours - Sequencer overload (airdrop)
Solana (September 2024): 4.5 hours - Transaction spam attack
Arbitrum (December 2024): 1.5 hours - RPC provider failure
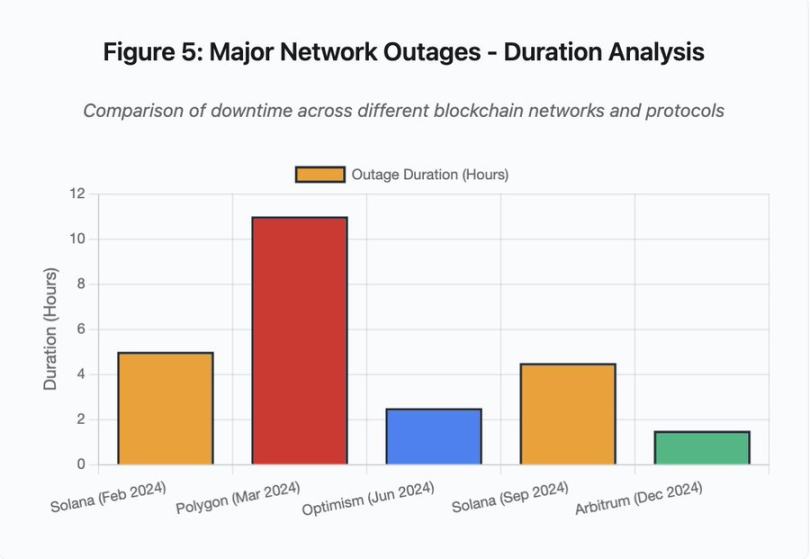
Figure 5: Major Network Outages - Duration Analysis
Solana: Consensus Bottleneck
Solana experienced multiple outages during 2024-2025. The February 2024 outage lasted about 5 hours, while the September 2024 outage lasted 4-5 hours. These outages stemmed from similar root causes: the network's inability to process transaction volumes during spam attacks or extreme activity.
Figure 5 details: The outages of Solana (5 hours in February, 4.5 hours in September) highlight the recurring issue of network resilience under stress.
Solana's architecture is optimized for throughput. Under ideal conditions, the network processes 3,000-5,000 transactions per second with sub-second finality. This performance is several orders of magnitude higher than Ethereum. However, during stress events, this optimization creates vulnerabilities.
The September 2024 outage was triggered by a flood of spam transactions that overwhelmed the validators' voting mechanism. Solana validators must vote on blocks to reach consensus. During normal operations, validators prioritize voting transactions to ensure consensus progress. However, the protocol previously treated voting transactions as regular transactions in terms of fee markets.
When the transaction memory pool filled with millions of spam transactions, validators struggled to propagate voting transactions. Without sufficient votes, blocks could not be finalized. Without finalized blocks, the chain halted. Users with pending transactions saw them stuck in the memory pool. New transactions could not be submitted.
StatusGator recorded multiple Solana service outages during 2024-2025, which Solana never officially acknowledged. This created information asymmetry. Users could not distinguish between local connection issues and network-wide problems. Third-party monitoring services provided accountability, but the platform should maintain a comprehensive status page.
Ethereum: Gas Fee Explosion
Ethereum experienced extreme gas fee surges during the DeFi boom in 2021, with transaction fees for simple transfers exceeding $100. Complex smart contract interactions cost $500-$1,000. These fees rendered the network unusable for smaller transactions while enabling a different attack vector: MEV extraction.
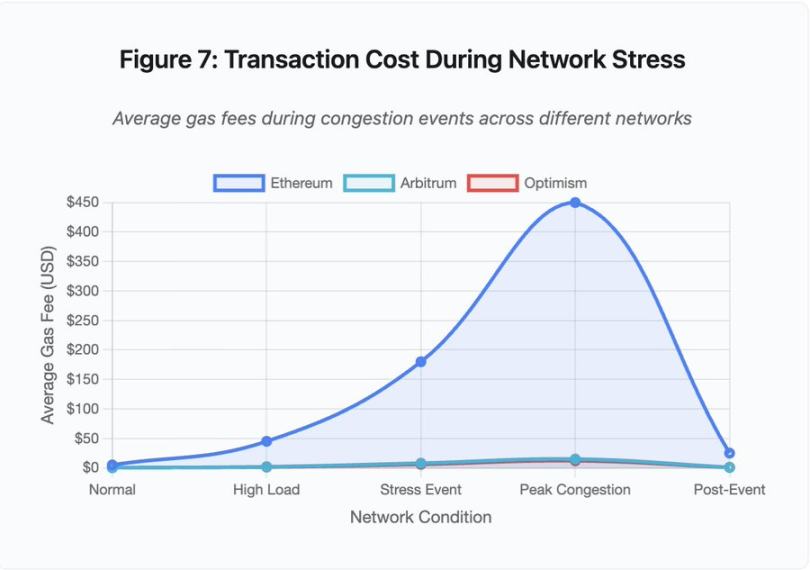
Figure 7: Transaction Costs During Network Stress
This line chart dramatically shows the gas fee escalations across networks during stress events:
Ethereum: $5 (normal) → $450 (peak congestion) - 90 times increase
Arbitrum: $0.50 → $15 - 30 times increase
Optimism: $0.30 → $12 - 40 times increase
The visualization indicates that even Layer 2 solutions experienced significant gas fee escalations, although starting from much lower levels.
Maximum Extractable Value (MEV) describes the profit that validators can extract by reordering, including, or excluding transactions. In a high gas fee environment, MEV becomes particularly lucrative. Arbitrageurs race to front-run large DEX trades, and liquidation bots compete to be the first to liquidate under-collateralized positions. This competition manifests as gas fee bidding wars.
Users wanting to ensure their transactions are included during congestion must bid higher than MEV bots. This creates scenarios where transaction fees exceed transaction values. Want to claim your $100 airdrop? Pay $150 in gas fees. Need to add collateral to avoid liquidation? Compete with bots charging $500 in priority fees.
Ethereum's gas limit restricts the total computational capacity per block. During congestion, users bid for scarce block space. The fee market works as designed: higher bids receive priority. But this design makes the network increasingly expensive during high usage periods, precisely when users most need access.
Layer 2 solutions attempt to address this issue by moving computation off-chain while inheriting Ethereum's security through periodic settlements. Optimism, Arbitrum, and other Rollups handle thousands of transactions off-chain and then submit compressed proofs to Ethereum. This architecture successfully reduces the cost per transaction during normal operations.
Layer 2: Sequencer Bottleneck
However, Layer 2 solutions introduce new bottlenecks. Optimism experienced an outage in June 2024 when 250,000 addresses simultaneously claimed an airdrop. The sequencer, the component that orders transactions before submitting them to Ethereum, became overwhelmed, leaving users unable to submit transactions for several hours.
This outage illustrates that moving computation off-chain does not eliminate infrastructure demands. The sequencer must process incoming transactions, order them, execute them, and generate fraud proofs or ZK proofs for settlement on Ethereum. Under extreme traffic, the sequencer faces the same scalability challenges as independent blockchains.
The availability of multiple RPC providers must be maintained. If the primary provider fails, users should seamlessly failover to alternatives. During the Optimism outage, some RPC providers remained functional while others failed. Users whose wallets defaulted to the failed provider could not interact with the chain, even though the chain itself remained online.
AWS outages have repeatedly demonstrated the existence of centralized infrastructure risks in the crypto ecosystem:
October 20, 2025 (today): Outage in the US East region affected Coinbase, as well as Venmo, Robinhood, and Chime. AWS acknowledged an increased error rate in DynamoDB and EC2 services.
April 2025: Regional outages simultaneously affected Binance, KuCoin, and MEXC. Multiple major exchanges became unavailable when their AWS-hosted components failed.
December 2021: Outage in the US East region caused Coinbase, Binance.US, and the "decentralized" exchange dYdX to be down for 8-9 hours, while also affecting Amazon's own warehouses and major streaming services.
March 2017: S3 outage prevented users from logging into Coinbase and GDAX for up to five hours, accompanied by widespread internet outages.
The pattern is clear: these exchanges host critical components on AWS infrastructure. When AWS experiences regional outages, multiple major exchanges and services become unavailable simultaneously. Users cannot access funds, execute trades, or modify positions during outages, precisely when market volatility may require immediate action.
Polygon: Consensus Version Mismatch
Polygon (formerly Matic) experienced an 11-hour outage in March 2024. The root cause involved a mismatch in validator versions, with some validators running old software versions while others ran upgraded versions. These versions computed state transitions differently.
Figure 5 details: The Polygon outage (11 hours) is the longest among the analyzed major events, highlighting the severity of consensus failures.
When validators arrive at different conclusions about the correct state, consensus fails, and the chain cannot produce new blocks because validators cannot agree on the validity of blocks. This creates a stalemate: validators running old software refuse to accept blocks produced by validators running new software, while validators running new software refuse to accept blocks produced by validators running old software.
Resolving this requires coordinating validator upgrades, but coordinating validator upgrades during an outage takes time. Each validator operator must be contacted, the correct software version must be deployed, and their validators must be restarted. In a decentralized network with hundreds of independent validators, this coordination can take hours or days.
Hard forks typically use block height triggers. All validators upgrade before a specific block height to ensure simultaneous activation, but this requires prior coordination. Incremental upgrades, where validators gradually adopt new versions, carry the risk of causing the exact version mismatch that led to the Polygon outage.
Architectural Trade-offs
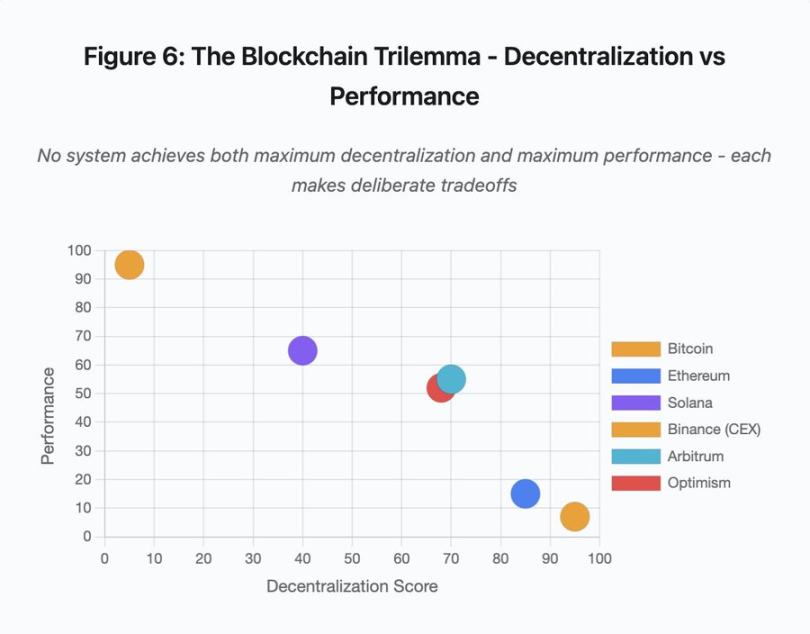
Figure 6: The Blockchain Trilemma - Decentralization vs Performance
This scatter plot visualizes the mapping of different systems across two key dimensions:
Bitcoin: High decentralization, low performance
Ethereum: High decentralization, medium performance
Solana: Medium decentralization, high performance
Binance (CEX): Minimal decentralization, maximum performance
Arbitrum/Optimism: Medium-high decentralization, medium performance
Key Insight: No system can achieve maximum decentralization and maximum performance simultaneously; each design makes thoughtful trade-offs for different use cases.
Centralized exchanges achieve low latency through architectural simplicity, with matching engines processing orders in microseconds and state residing in centralized databases. The absence of a consensus protocol introduces overhead, but this simplicity creates a single point of failure, where cascading failures propagate through tightly coupled systems when infrastructure is under stress.
Decentralized protocols distribute state across validators, eliminating single points of failure. High-throughput chains maintain this property during outages (no loss of funds, only temporary impairment of activity). However, reaching consensus among distributed validators introduces computational overhead, as validators must agree before state transitions are finalized. When validators run incompatible versions or face overwhelming traffic, the consensus process may temporarily halt.
Adding replicas improves fault tolerance but increases coordination costs. In Byzantine fault-tolerant systems, each additional validator increases communication overhead. High-throughput architectures minimize this overhead through optimized validator communication, achieving superior performance but becoming vulnerable to certain attack patterns. Security-focused architectures prioritize validator diversity and consensus robustness, limiting throughput at the base layer while maximizing resilience.
Layer 2 solutions attempt to provide both properties through a layered design. They inherit Ethereum's security properties through L1 settlement while offering high throughput through off-chain computation. However, they introduce new bottlenecks at the sequencer and RPC layers, indicating that architectural complexity creates new failure modes while solving some problems.
Scalability Remains a Fundamental Issue
These events reveal a consistent pattern: systems are provisioned for normal loads and then catastrophically fail under stress. Solana effectively handled regular traffic but crashed when transaction volumes increased by 10,000%. Ethereum's gas fees remained reasonable until DeFi adoption triggered congestion. Optimism's infrastructure functioned well until 250,000 addresses simultaneously claimed an airdrop. Binance's API performed normally during regular trading but faced limitations during liquidation chains.
The events of October 2025 showcased this dynamic at the exchange level. During normal operations, Binance's API rate limits and database connections were sufficient, but during liquidation chains, when every trader attempted to adjust positions simultaneously, these limits became bottlenecks. The margin system, designed to protect exchanges through forced liquidations, amplified the crisis by creating forced sellers at the worst moments.
Auto-scaling provides insufficient protection against step-function increases in load. Spinning up additional servers takes minutes, during which the margin system marks position values based on corrupted price data from a thin order book, and by the time new capacity comes online, the chain reaction has already spread.
Over-provisioning resources for rare stress events incurs costs during normal operations. Exchange operators optimize for typical loads, accepting occasional failures as an economically reasonable choice. The costs of downtime are externalized to users, who experience liquidations, stuck trades, or inaccessible funds during critical market movements.
Infrastructure Improvements
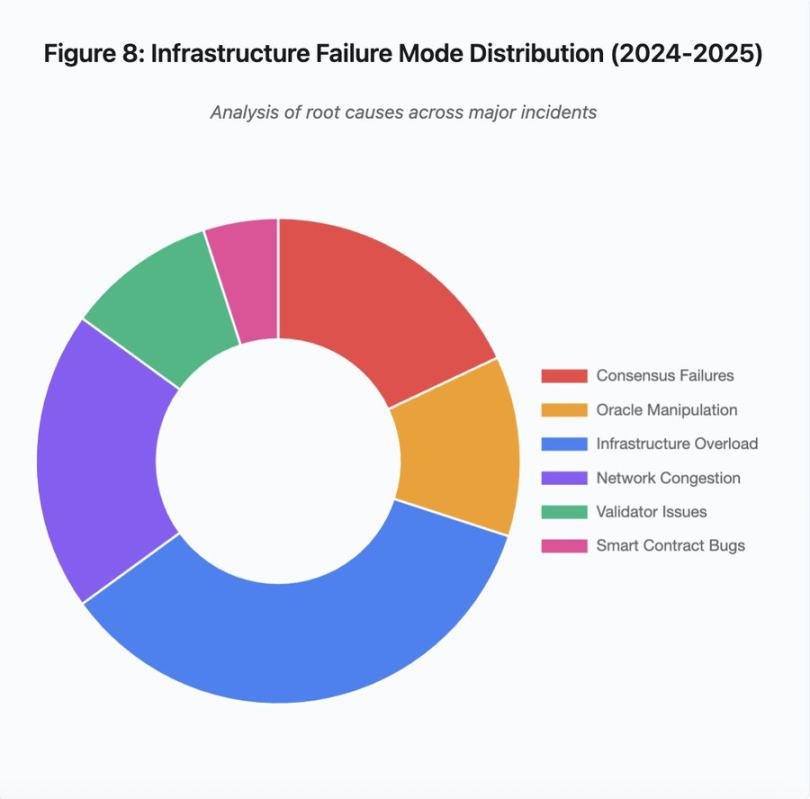
Figure 8: Distribution of Infrastructure Failure Modes (2024-2025)
The pie chart breakdown of root causes shows:
Infrastructure overload: 35% (most common)
Network congestion: 20%
Consensus failure: 18%
Oracle manipulation: 12%
Validator issues: 10%
Smart contract vulnerabilities: 5%
Several architectural changes can reduce the frequency and severity of failures, although each involves trade-offs:
Separation of Pricing and Liquidation Systems
The issues in October partially stemmed from coupling margin calculations with spot market prices. Using exchange rates for wrapped assets instead of spot prices could have avoided the mispricing of wBETH. More generally, critical risk management systems should not rely on potentially manipulable market data. Independent oracle systems with multi-source aggregation and TWAP calculations provide more robust price data streams.
Over-Provisioning and Redundant Infrastructure
The AWS outage in April 2025 that affected Binance, KuCoin, and MEXC demonstrated the risks of centralized infrastructure reliance. Running critical components across multiple cloud providers increases operational complexity and costs but eliminates correlated failures. Layer 2 networks can maintain multiple RPC providers with automatic failover. The additional costs may seem wasteful during normal operations, but they prevent hours of downtime during peak demand.
Enhanced Stress Testing and Capacity Planning
The pattern of systems running well until failure indicates insufficient testing under stress. Simulating 100 times the normal load should be standard practice, as the cost of identifying bottlenecks during development is lower than discovering them during actual outages. However, realistic load testing remains challenging. Production traffic exhibits patterns that synthetic tests cannot fully capture, and user behavior during actual crashes differs from that during testing.
The Path Forward
Over-provisioning offers the most reliable solution but conflicts with economic incentives. Maintaining 10 times excess capacity for rare events incurs daily costs to prevent issues that occur once a year. Before catastrophic failures impose enough costs to justify over-provisioning, systems will continue to fail under stress.
Regulatory pressure may force change. If regulations mandate 99.9% uptime or limit acceptable downtime, exchanges will need to over-provision. However, regulations often follow disasters rather than prevent them. The collapse of Mt. Gox in 2014 led Japan to establish formal cryptocurrency exchange regulations. The chain of events in October 2025 is likely to trigger similar regulatory responses. Whether these responses specify outcomes (maximum acceptable downtime, maximum slippage during liquidation) or implementation methods (specific oracle providers, circuit breaker thresholds) remains uncertain.
The fundamental challenge is that these systems operate continuously in global markets but rely on infrastructure designed for traditional business hours. When stress occurs at 2:00 AM, teams scramble to deploy fixes while users face escalating losses. Traditional markets halt trading during stress; the crypto market simply crashes. Whether this represents a feature or a flaw depends on perspective and position.
Blockchain systems have achieved significant technical complexity in a short time. Maintaining distributed consensus across thousands of nodes represents a true engineering achievement. However, achieving reliability under stress requires moving beyond prototype architectures to production-grade infrastructure. This shift requires funding and prioritizing robustness over the speed of feature development.
The challenge lies in how to prioritize robustness over growth during bull markets when everyone is making money and downtime seems to be someone else's problem. By the time the next cycle stress-tests the system, new vulnerabilities will emerge. Whether the industry learns from the events of October 2025 or repeats similar patterns remains an open question. History suggests we will discover the next critical vulnerability through another multi-billion dollar failure under stress.
免责声明:本文章仅代表作者个人观点,不代表本平台的立场和观点。本文章仅供信息分享,不构成对任何人的任何投资建议。用户与作者之间的任何争议,与本平台无关。如网页中刊载的文章或图片涉及侵权,请提供相关的权利证明和身份证明发送邮件到support@aicoin.com,本平台相关工作人员将会进行核查。