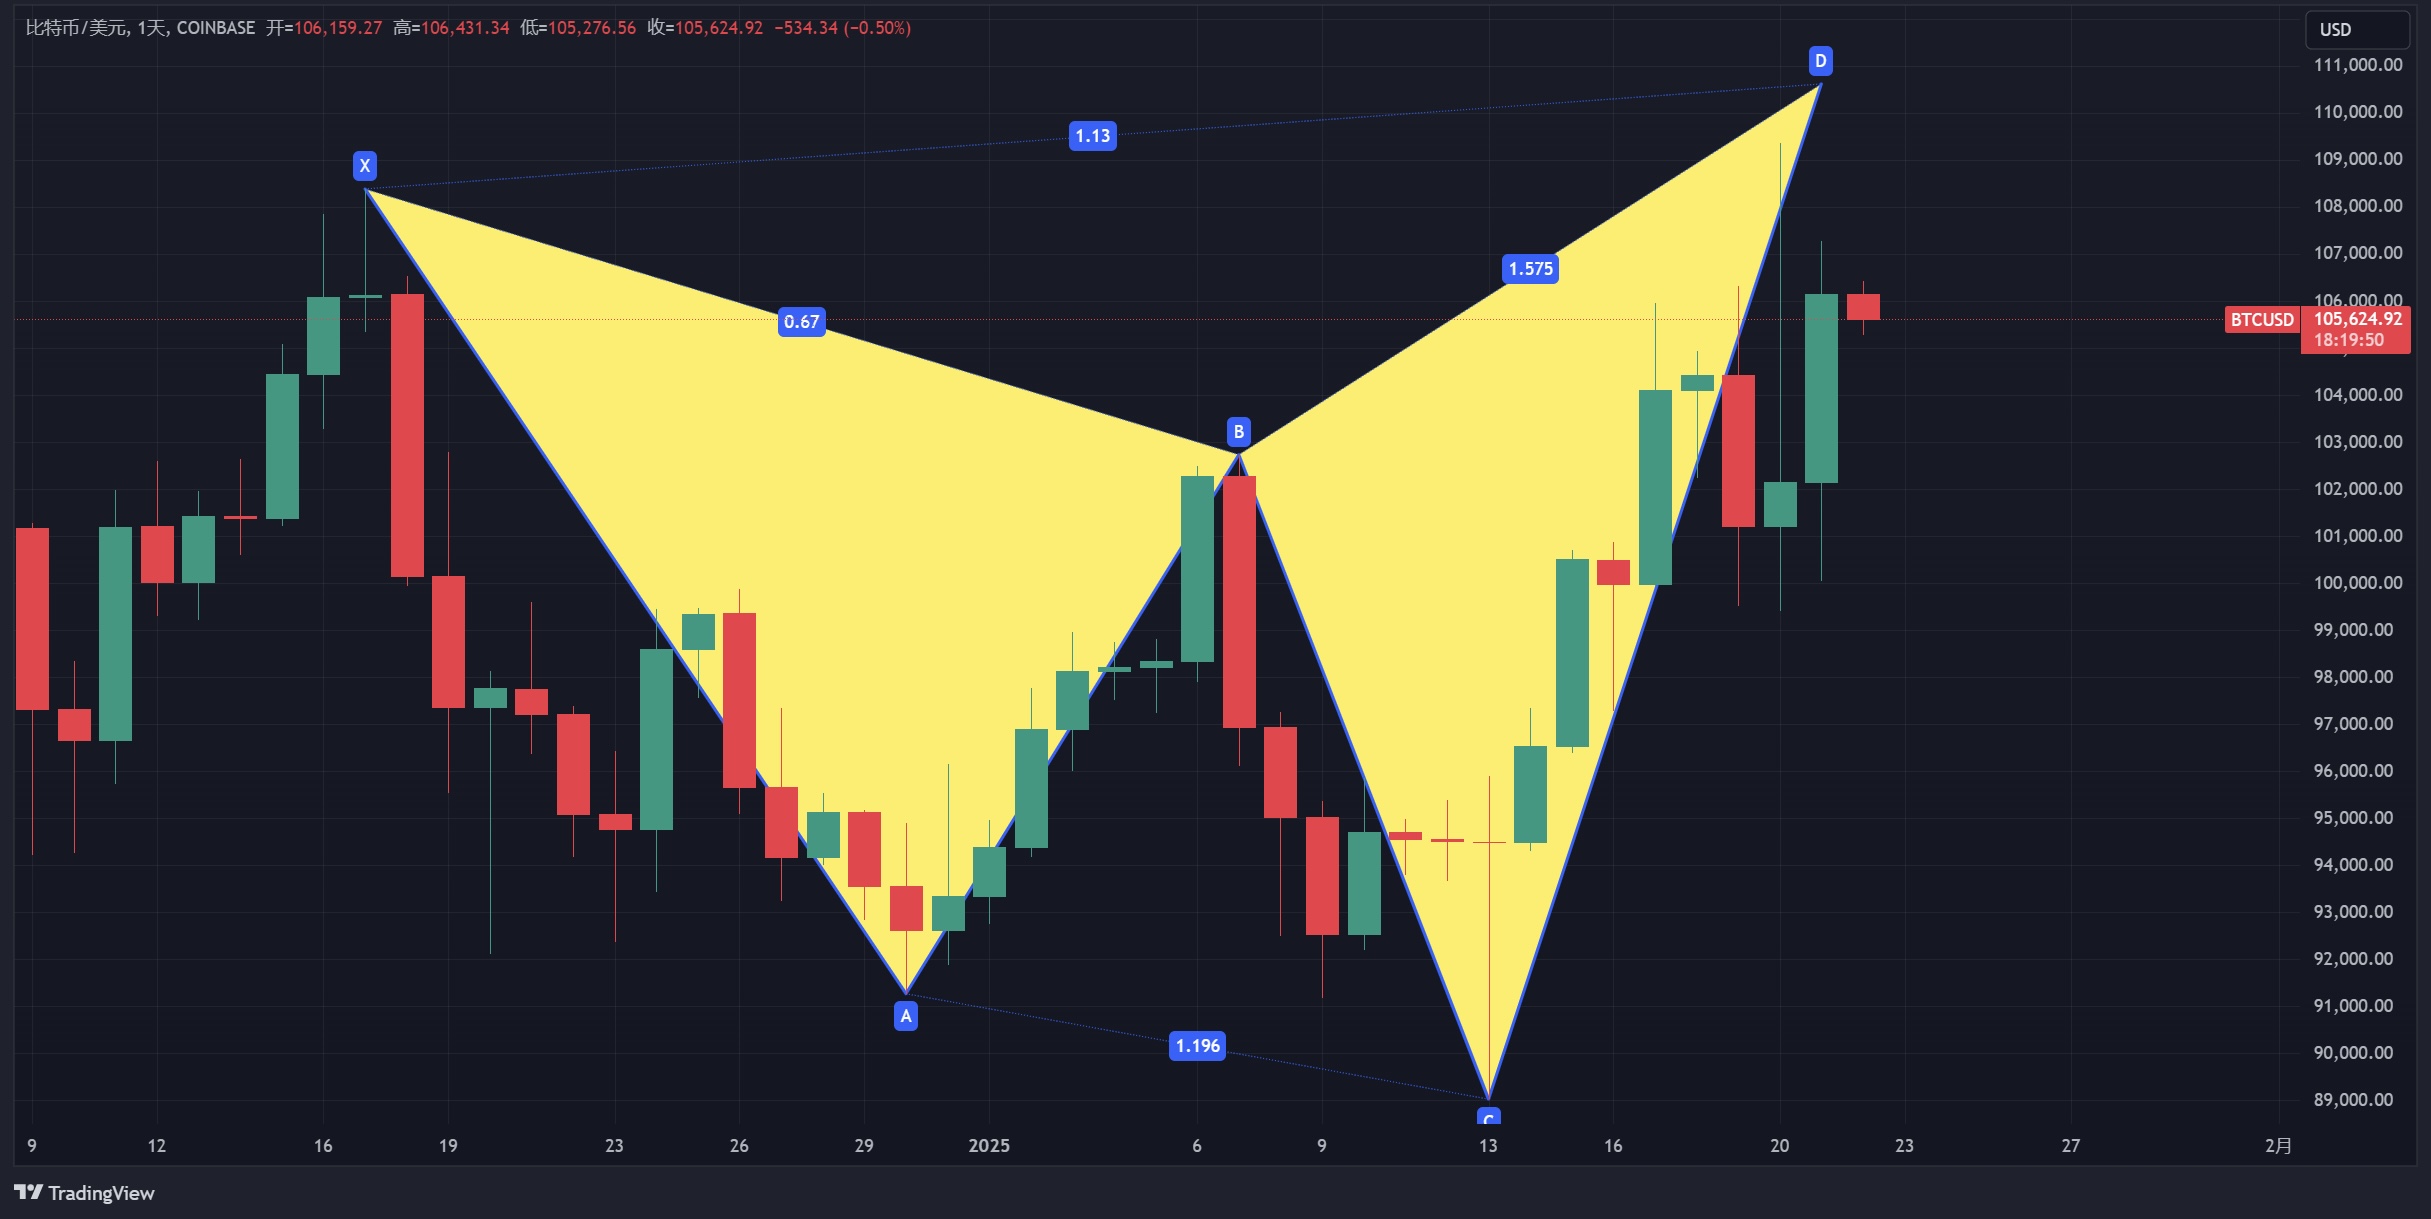
The three major U.S. stock indices rose amid fluctuations, with the Dow Jones up over 1% and the S&P 500 index rising by 0.57%. In the cryptocurrency sector, Coinbase fell by 1.35%, MicroStrategy dropped by 2.46%, and Riot decreased by 4.00%.
The Dow Jones broke through the potential shark pattern's descending neckline at 0.886, while the Nasdaq is still in a descending channel and has not yet broken through. The S&P 500 has broken through a descending wedge. As long as the three major U.S. stock indices can continue to reach new highs, a financial storm is unlikely to occur in the short term.
Rex submitted applications for DOGE ETF and TRUMP ETF, and among the more than 30 cryptocurrency ETFs filed, there are SOL, XRP, LTC, HBAR, DOGE, BONK, and TRUMP. The mixed ETF fund applied for by Grayscale includes AVAX, ADA, and others.
SoftBank, Oracle, and OpenAI have collaborated to establish a new company called Stargate, planning to invest $500 billion over the next four years to build new AI infrastructure for OpenAI in the United States. The AI sector remains promising for 2024 and 2025, and related AI tokens are worth paying attention to.
Bitcoin
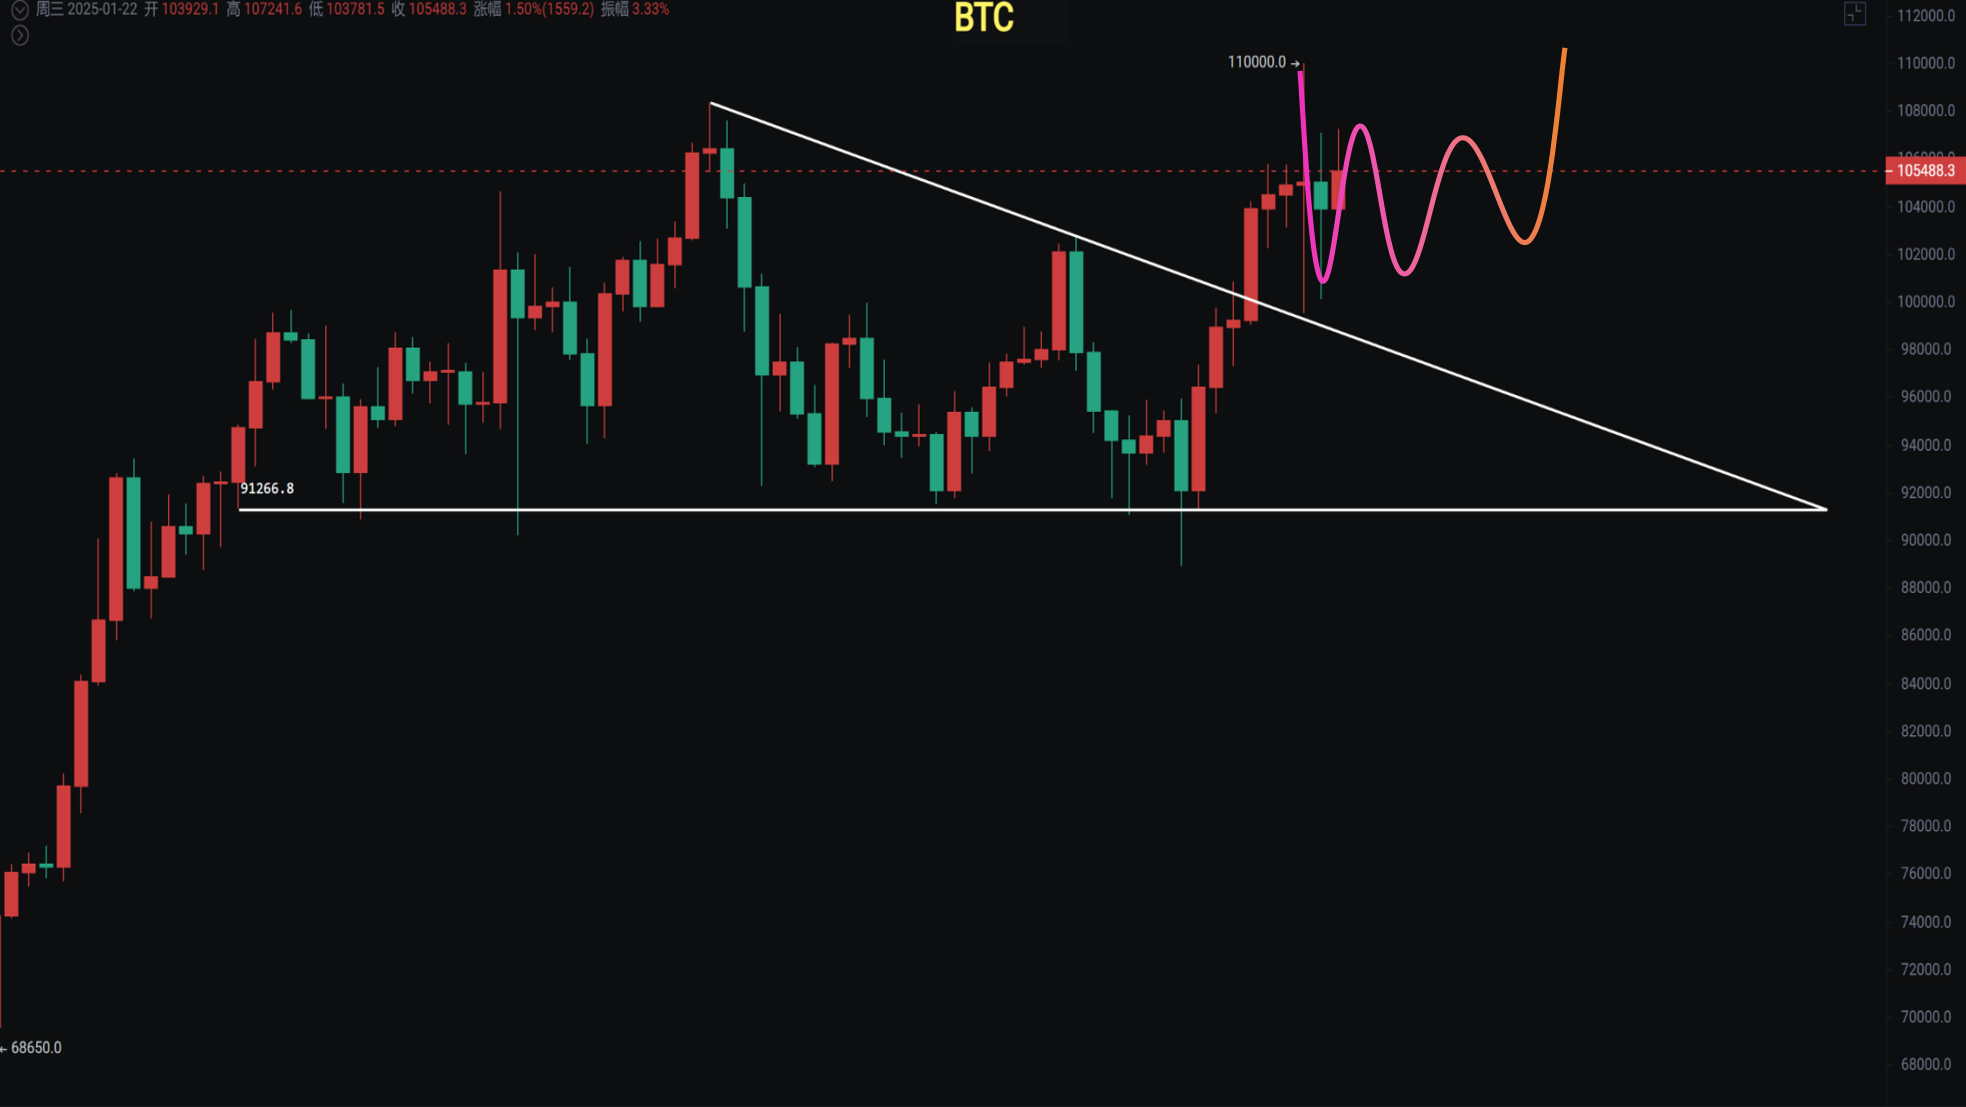
After reaching a new high of 110,000, it has retraced and continues to fluctuate between 99,550 and 110,000. Last night, after a rebound to a high of 107,240, it retraced again, also touching the M-head pressure at 110,000. As long as it stays above 99,550 to 100,000, there is still a chance for further upward breakthroughs.

After last month's monthly line closed with a doji star, there are about 10 days left this month for the K-line to break above the upper Bollinger Band. The corresponding upper Bollinger Band pressure on the weekly chart is between 116,300 and 120,000. On the daily chart, if the continuous body breaks below 102,000, the probability of a false breakout increases, leading to a higher chance of a short-term retracement. Summary: The short-term continues to fluctuate between 99,550 and 110,000, waiting for a directional choice, with a higher probability of continuing to break upward. Risk prevention should not fall below 97,300.

Support: Pressure:
Ethereum
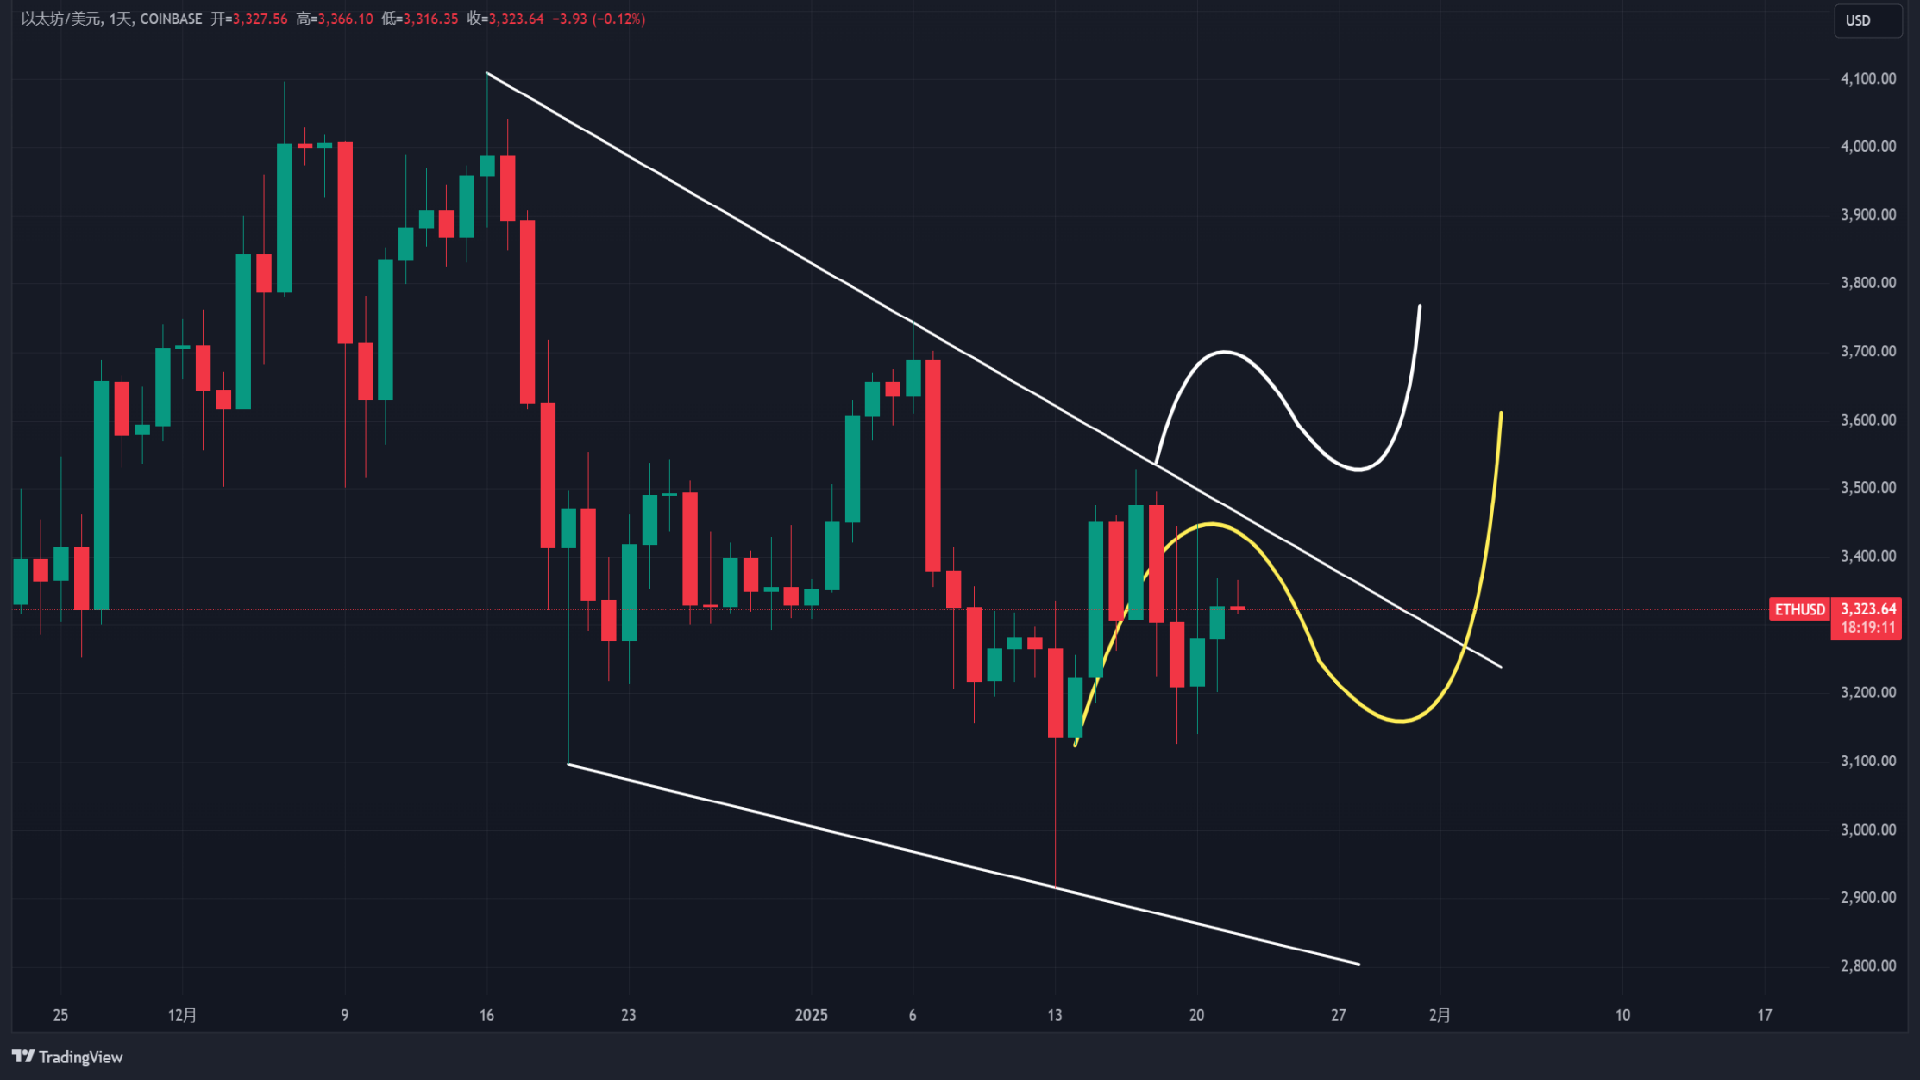
Ethereum's daily chart is still fluctuating within a descending wedge. In the past week, there have been many downward spikes. If it does not break below 3,130, there is an expectation of a head and shoulders bottom, increasing the probability of breaking upward through the descending wedge. Stop loss: Pressure:

SOL
After touching the support near 230 twice and rebounding, the pullback is an opportunity to increase positions, with the first target looking to double to 400-500 dollars.
If you like my views, please like, comment, and share, and let's navigate through the bull and bear markets together!!!
The article is time-sensitive and for reference only, with real-time updates.
Focusing on K-line technical research, sharing global investment opportunities. Public account: Trading Prince Fusu

免责声明:本文章仅代表作者个人观点,不代表本平台的立场和观点。本文章仅供信息分享,不构成对任何人的任何投资建议。用户与作者之间的任何争议,与本平台无关。如网页中刊载的文章或图片涉及侵权,请提供相关的权利证明和身份证明发送邮件到support@aicoin.com,本平台相关工作人员将会进行核查。


