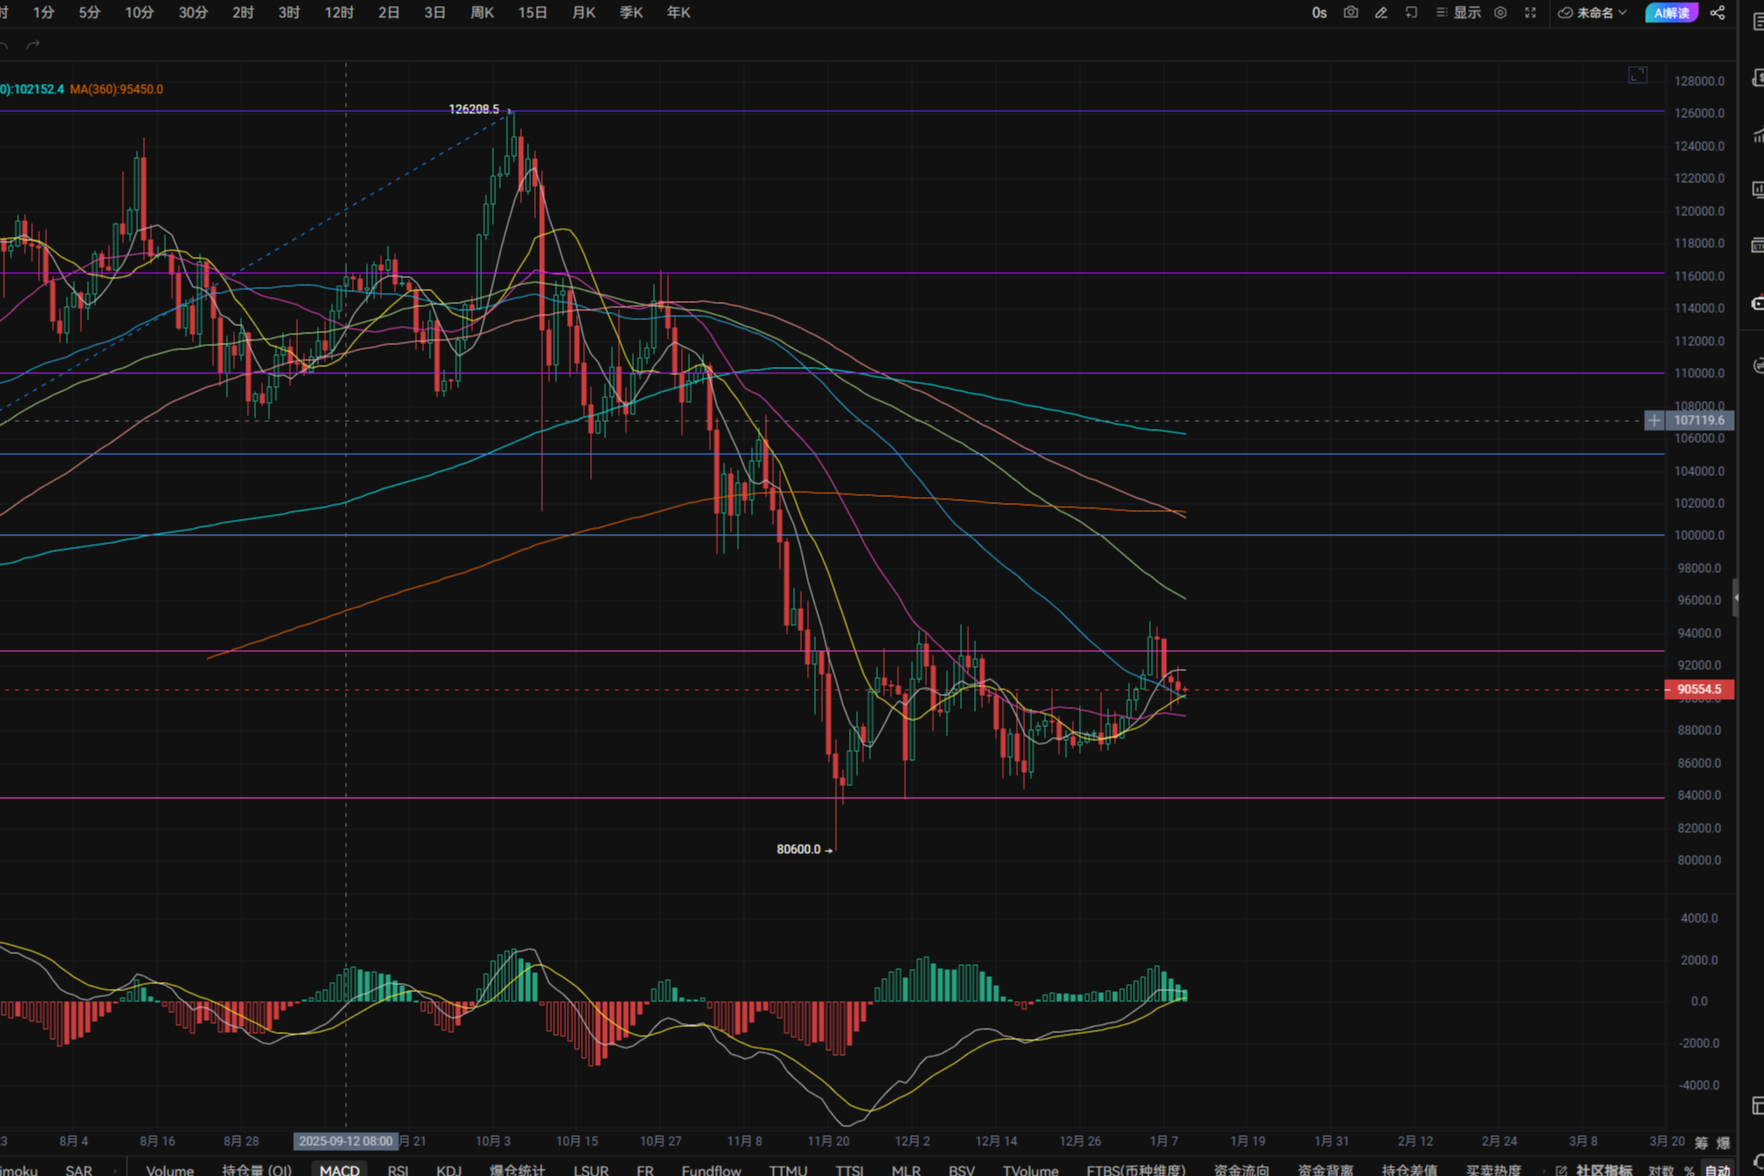
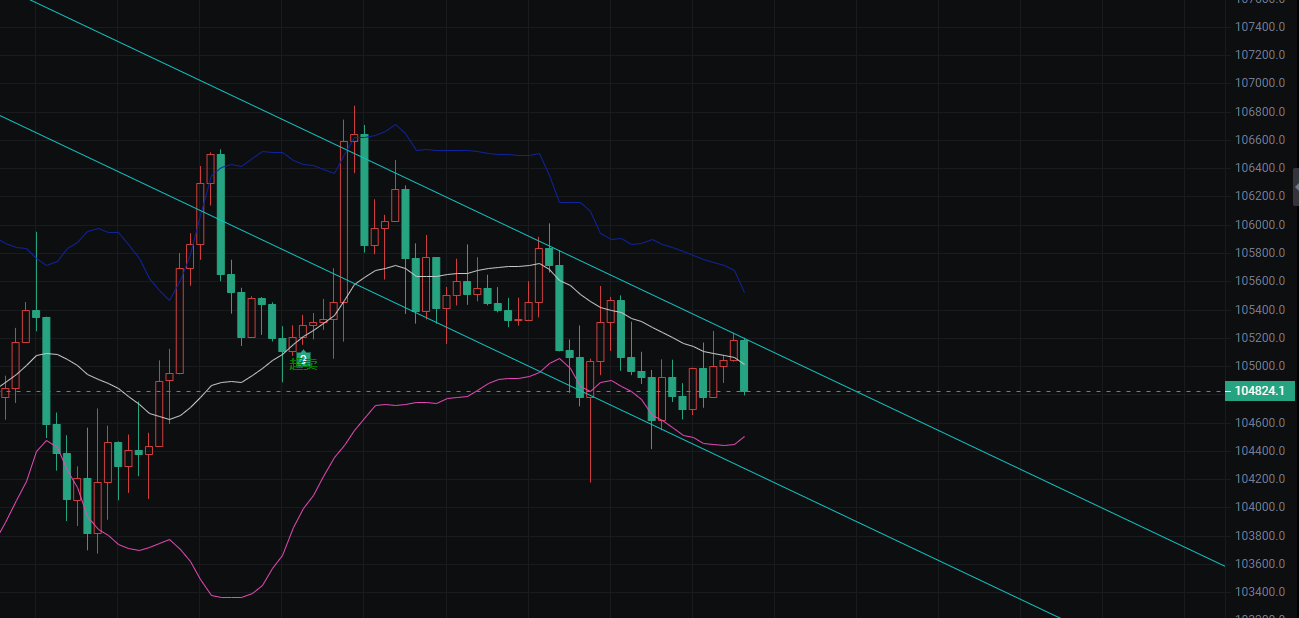
This week, the market has been relatively stable. From the hourly Bollinger Bands perspective, the price of Bitcoin is oscillating downwards within the range of the upper and lower bands, with prices between 10.4 and 10.6. The upper resistance is at 10.6, and the lower support is at 10.4, with the day primarily characterized by oscillation.
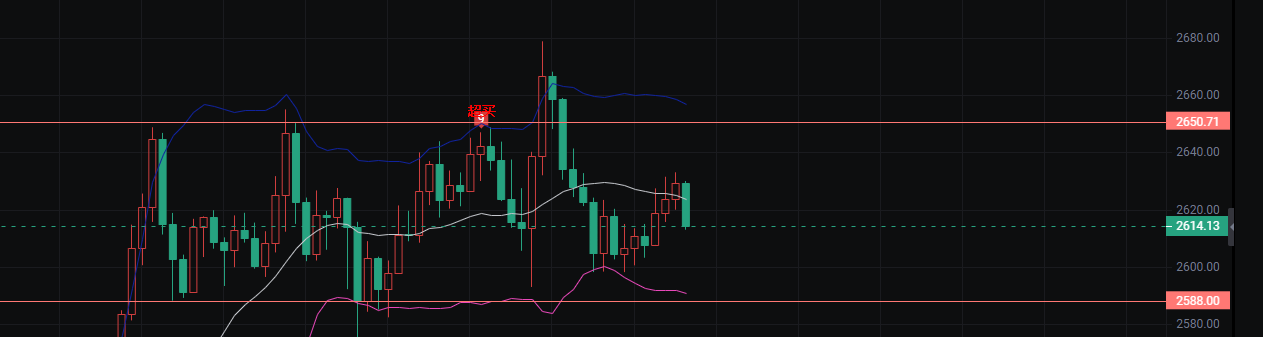
The price of Ethereum is also moving in a relatively orderly manner, with the Bollinger Bands indicating a smooth operation, oscillating regularly around the range of 2590 to 2650. The upper resistance is at 2650, and the lower support is at 2590. The oscillation of Ethereum can be clearly seen as very regular based on the Bollinger Bands.
Such regular market oscillations are very easy to trade. You only need to enter positions near the upper and lower bands of the Bollinger Bands, performing high shorts and low longs, allowing for back-and-forth trading. Prolonged consolidation and correction may likely lead to extreme trend changes. As long as we seize all the opportunities during this phase, even if we encounter extreme trend changes, we just need to focus on defense, and it won't have much impact.
Trading Strategy:
BTC: Long at 10.4, add to long at 10.3, target a rebound of one to two thousand points; Short at 10.55, add to short at 10.65, target 10.4.
ETH: Long at 2590, add to long at 2560, target 2630-2650; Short at 2650, add to short at 2680, target 2610-2580.
Daily analysis is time-consuming and labor-intensive, but with a high win rate, more trading skills and methods, including position management, market observation, and technical analysis. I hope this helps many friends. Most of my time is spent analyzing the market to assist those in need. Everyone, please pay more attention to the public account - Bitcoin Bear.

免责声明:本文章仅代表作者个人观点,不代表本平台的立场和观点。本文章仅供信息分享,不构成对任何人的任何投资建议。用户与作者之间的任何争议,与本平台无关。如网页中刊载的文章或图片涉及侵权,请提供相关的权利证明和身份证明发送邮件到support@aicoin.com,本平台相关工作人员将会进行核查。