Author: @BlazingKevin_, the Researcher at Movemaker
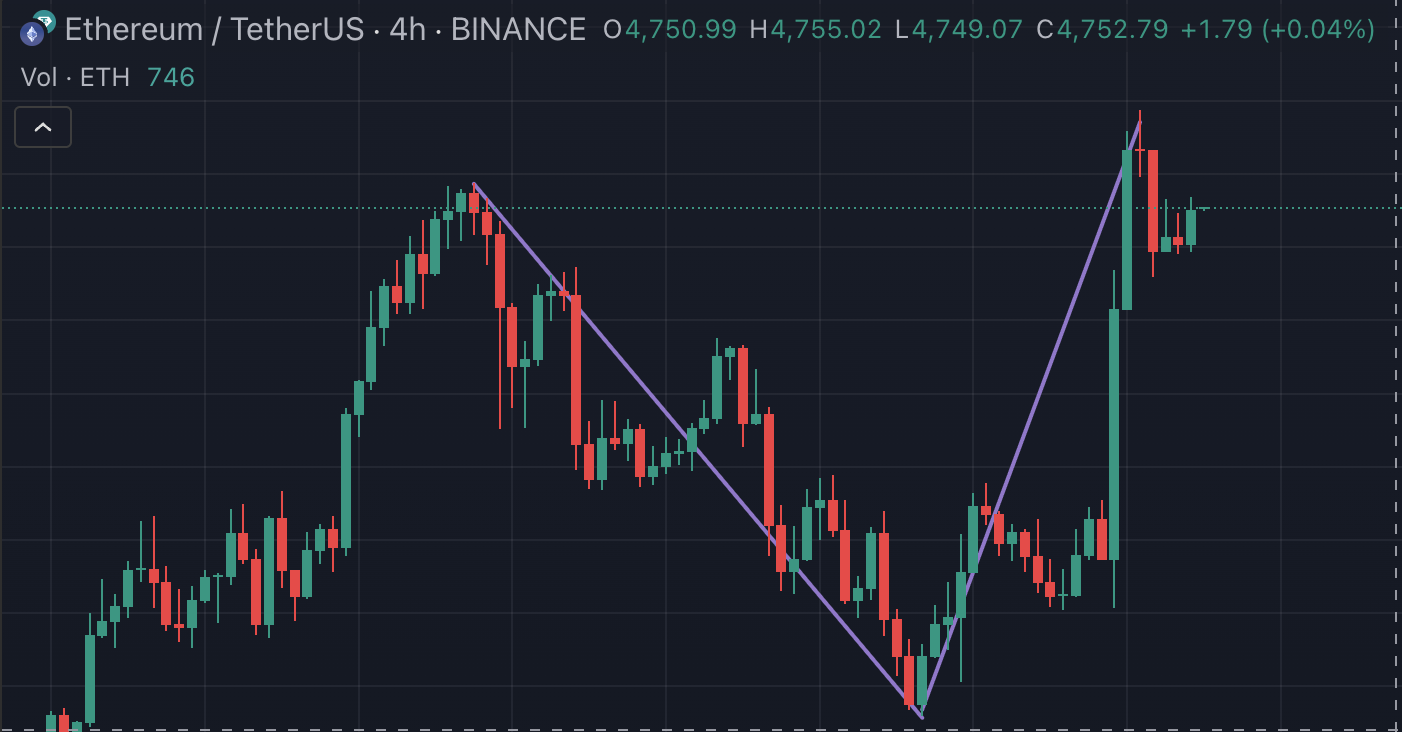
With Ethereum breaking through 4868, it officially achieved a historical new high. Looking back at the market trends over the past two weeks: Ethereum experienced a roller coaster ride from 4788 to 4060 to 4887, completing a 15% drop and a 20% rise within 10 days. The institutions driving this round of Ethereum's market, namely the Ethereum micro-strategists, are also experiencing a roller coaster in their stock prices.
If your investment portfolio includes Ethereum and its leveraged institutional stocks, and you foresee Ethereum undergoing wide fluctuations at historical highs, the importance of using derivatives to hedge against account drawdown risks is continuously increasing. Even if you are a "buy and hold" long-term holder, you may not want to experience another prolonged downward fluctuation in Ethereum like Bitcoin did last year.
Options, as a nonlinear financial derivative, provide an effective solution for managing this price risk. By purchasing put options, you can set a price floor for your held ETH or related coin stock assets, thereby protecting the value of your portfolio during significant market downturns. Furthermore, by constructing more complex options combinations, you can even profit during market consolidations or slight fluctuations.
How to go long on mNAV if you are optimistic about the flywheel further expanding?
Ethereum's DAT Ponzi flywheel is still ongoing
The DAT (Digital Asset Treasury) strategy has pushed Michael Saylor's company market value beyond 100 billion dollars, with growth during the same period even surpassing Nvidia. By issuing company securities (such as stocks or bonds) to raise funds in the public market, and then using the funds to massively increase crypto asset holdings, the aim is to create a positive cycle of "fundraising -> buying coins -> coin price and stock price rising together -> further fundraising."
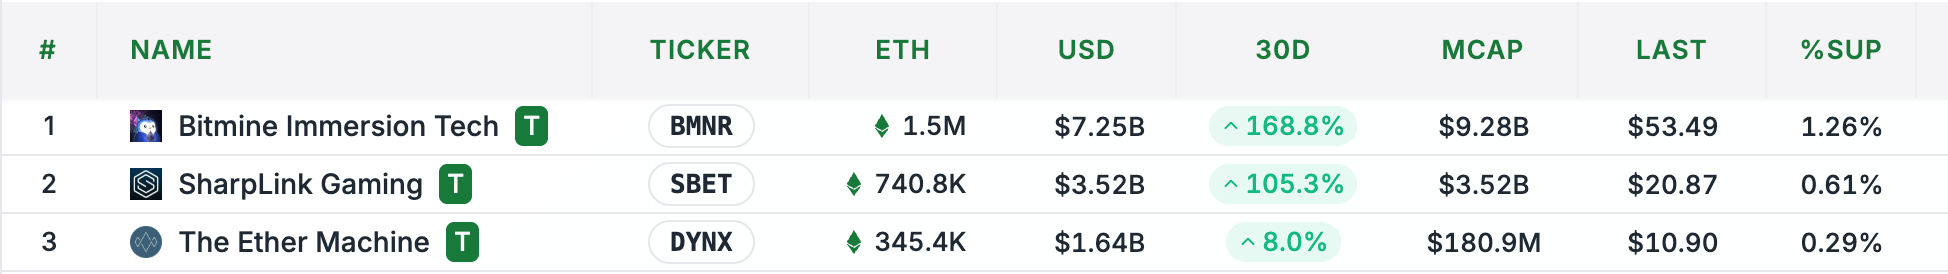
Companies represented by Sharplink Gaming (SBET) and BitMine (BMNR) are trying to replicate and upgrade this model, and Ethereum's unique nature may allow this flywheel to turn faster and more steadily.
The essence of the DAT model is an arbitrage game about the long-term growth rate of assets versus the cost of financing. Its success hinges on the long-term compound annual growth rate (CAGR) of the underlying asset (such as ETH) being significantly higher than the company's cost of capital. However, the uniqueness of Ethereum's treasury lies in the fact that it does not simply replicate Bitcoin's script but cleverly utilizes three unique characteristics of the Ethereum ecosystem to inject unprecedented driving force into this flywheel model:
- Volatility becomes a "catalyst" for financing
In traditional views, high volatility usually means high risk. However, in the financing tools of the DAT model—especially the issuance of convertible bonds (CB)—Ethereum's historical and implied volatility far exceeds that of Bitcoin, becoming a unique advantage. This high volatility poses a significant attraction for hedge funds that thrive on trading volatility (such as those engaging in Gamma trading). The result is that ETH treasury companies can issue convertible bonds under more favorable conditions (higher valuations), thus lowering financing costs. Volatility here is no longer purely a risk but is transformed into "bait" to attract specific institutional investors, providing cheaper and more abundant fuel for the flywheel's initiation.
2. Native yield provides an endogenous "stabilizer"
Bitcoin treasuries (like MSTR) pay bond interest or preferred stock dividends, which essentially rely on issuing more shares in the market to exchange for cash, a behavior highly dependent on market liquidity and stock price stability. In contrast, Ethereum's PoS mechanism endows ETH with endogenous productivity—stable and considerable native yield can be generated through staking and re-staking. This means ETH treasury companies can use this portion of income to cover the interest costs of their financing tools, significantly reducing their dependence on the market.
3. mNAV premium constitutes the flywheel's "accelerator"
The market value to net asset value ratio (mNAV) is a key indicator for measuring the valuation of treasury companies, reflecting the market's expectations for their future value appreciation capabilities. Since Ethereum's native yield mechanism can continuously increase the number of ETH corresponding to each share without relying on additional financing, the market is naturally willing to grant ETH treasury companies a higher mNAV premium. The higher the mNAV, the stronger the flywheel's appreciation and acceleration effect.
The correct way to go long on mNAV while ignoring the price fluctuations of individual coins
If your current strategy is optimistic about mNAV and you believe Ethereum may have a risk of correction, then an options strategy that ignores the price fluctuations of individual coins is the most appropriate. Taking BMNR as an example, you might think that going long on 10,000 BMNR while shorting 10,000 ETHA could simply achieve this. However, in reality, this is an incorrect hedging strategy.
When only going long on mNAV, we need to consider the intrinsic value per share of BMNR, SBET, ETHA, etc. That is, how many units of ETH each share actually represents. This can be viewed as the "net asset value" of the tool priced in ETH.
Calculation method: ETH content per share = Total ETH holdings / Total shares issued
For ETHA, the calculation process is as follows: First, the calculation method for the indicative basket of Ethereum quantity for ETHA on a certain day is: multiply the estimated net asset value (NAV) for the next day by the number of shares in each basket (40,000), then divide by the day's CF benchmark index.
According to the data from https://www.ishares.com/us/products/337614/ishares-ethereum-trust-etf, the number of Ethereum corresponding to 40,000 shares is 302.56.
302.57/40000=0.00756 ETH
That is, 1 ETHA = 0.00756 ETH
For BMNR, the calculation process is as follows:
Circulating shares: 173,496,950 shares
ETH held: 1,570,000
That is, 1 BMNR = 0.00904 ETH
After determining the "ETH content" of the two assets, the next step is to calculate the hedging ratio:
BMNR:ETHA = 0.00904:0.00756 = 6:5
Based on the closing price: 1 ETH = 4840
The intrinsic value of 1 BMNR is: 0.00904 * 4840 = 43.75
The closing price of BMNR is 53.49
BMNR's mNAV = 53.49 / 43.75 = 1.22
Using the same method, calculate SBET's mNAV: Circulating shares: 168,866,724 shares 740,800 ETH gives: 1 SBET = 0.00438 ETH
Based on the closing price: 1 ETH = 4840
The intrinsic value of 1 SBET is: 0.00438 * 4840 = 21.19
The closing price of SBET is 20.87
SBET's mNAV = 21.19 / 20.87 = 1.015
The hedging ratio between SBET and ETHA is: SBET:ETHA = 0.00438:0.00756 = 11:19
SBET's mNAV is lower than BMNR's. When Ethereum approaches historical highs, there is a significant possibility of facing a correction or entering wide fluctuations. Following the operational thought of this section, we still believe that the mNAV flywheel will continue to operate positively, meaning SBET or BMNR will not fall below intrinsic value before expiration, but we do not want to bear the net value shrinkage caused by a sharp correction in Ethereum. Therefore, it should be expected that when ETH's decline is greater than that of SBET or BMNR, we should choose the one with the smaller mNAV between SBET and BMNR to go long, minimizing risk.
Taking 250905 as an example:
We should operate with the same ratio of SBET selling PUTs and ETHA buying PUTs: Selling SBET 20.5 PUT * 19 yields a premium of 2,888 dollars.
According to the intrinsic value of SBET, the decline is: 3.2%
ETHA experiencing the same decline would price at: 35.39
The closest strike price is 36, so buying ETHA 35 PUT * 11 pays a premium of 1,507 dollars.
The premium income is: 1,381 dollars.
If mNAV rises or remains unchanged, then premium income is obtained. However, if SBET's decline exceeds that of Ethereum, i.e., mNAV decreases, then a loss will occur. According to SBET's current premium level, this situation means the premium enters underwater, and the DAT flywheel may be put on pause.
Therefore, the configuration thought of this strategy should be: Optimistic that this round of Ethereum's market has not ended, meaning mNAV should steadily rise, but believing that Ethereum has a risk of correction in the short term. Thus, the goal is to go long on mNAV while ignoring the price changes of individual stocks and coins. Of course, this strategy also has drawbacks, namely that if ETH crashes, the market may expect "the issuance flywheel to fail," and SBET's stock price often falls harder than ETH. In such extreme cases, the Put seller's exposure could incur significant losses, while ETHA Put hedging may be insufficient. Alternatively, if market sentiment turns negative (expecting issuance failure, prolonged ETH correction), the premium may enter underwater and continue to decline.
When the issuance of coin stocks leads to a decline in premium, how should one short mNAV?
For companies like SBET and BMNR, whose core business model is to hold and increase ETH, their stock price performance depends not only on the price of ETH but also on the profound impact of the company's own capital operations, the most critical of which is the cyclical model of financing through issuing new shares to purchase more ETH. In a bull market where ETH prices continue to rise, this model seems capable of creating value, but it hides a continuous dilution of existing shareholders' equity. This dilution effect is a mathematical inevitability that will ultimately undermine its "eternal growth" logic.
The core mechanism of equity dilution
To truly understand the operational logic of equity dilution, one can start from a quantitative deduction framework. The basic starting point is that issuing new shares means that the same company's corresponding assets will be shared among more shares; unless the market reacts ideally (i.e., willing to accept additional supply while maintaining valuation), the relative rights of old shareholders will inevitably be weakened, and the essence of new funds entering is a redistribution of value among shareholders.
Initial setting:
- Company Holdings: Assume the company's assets consist of a portfolio of AI startup equity valued at $200 million, with no debt, thus the net asset value (NAV) is $200 million.
- Market Value: The market values it at $250 million, reflecting a 25% premium. This premium may stem from the market's fervent enthusiasm for the AI sector or extremely high expectations for the company's investment acumen.
- Equity Size: Set as Q shares.
- Net Asset Value per Share (NAV): $200/Q.
- Share Price: $250/Q.
The market is willing to pay $1.25 for every $1 of assets held by the company, and this 25% premium is the "fuel" that can initiate subsequent fundraising cycles.
First Round of Fundraising:
- Financing Size: The company decides to raise $100 million by issuing new shares, using all funds to invest in new AI projects. To maintain market price stability, the issuance must be at the current share price of $250/Q.
- New Shares Issued (M): M = $100 million ÷ (250/Q) = 0.4Q shares.
- Total New Equity: Qnew = Q + M = Q + 0.4Q = 1.4Q shares.
- Total New Assets: Anew = $200 million + $100 million = $300 million.
- New Net Asset Value per Share: NAVnew = $300 million ÷ (1.4Q) ≈ $214.29/Q. Compared to the original $200/Q, the intrinsic value per share has indeed increased.
- New Market Value (assuming share price remains stable): Market Value new = (250/Q) × 1.4Q = $350 million.
- New Premium: Premium new = ($350 million ÷ $300 million) - 1 ≈ 16.67%.
On the surface, the net asset value per share increases, the share price remains unchanged, and the company's market value significantly expands. However, in essence, the original 25% premium has been diluted to 16.67%.
How Value Transfer Occurs:
The newly infused $100 million in assets is now jointly owned by all shareholders (new and old). The ownership percentage of old shareholders drops from 100% to Q/1.4Q ≈ 71.43%.
Their equity in the new total asset value of $300 million is approximately $300 million × 71.43% ≈ $214 million. Although this is $14 million more than the $200 million in assets they initially owned, they have lost part of their claim to the original high premium. The new shareholders, with their $100 million, not only acquire $100 million in assets but also "freely" enjoy part of the overall market premium of the company, effectively entering at a discounted price.
If the Cycle Continues:
Assuming the company continues to adopt this strategy, raising funds equivalent to 40% of the current market value each time:
- After Round 1: Assets $300 million, Market Value $350 million, Premium 16.67%.
- Round 2: Raise another $140 million (40% of $350 million), total assets will become $440 million, while the new market value (if share price remains unchanged) will reach $490 million, and the premium will be further diluted to about 11.36%.
- After Round 3: Asset scale continues to expand, but the premium will continue to decline.
As the rounds increase, the premium will approach 0 indefinitely. Ultimately, when the issuance price can only equal the net asset value per share:
- Net Asset Value per Share no longer increases. For example, if assets are K and equity is P. At this point, the issuance can only occur at K/P price. If $0.3K is raised, the new shares will be 0.3P. New assets will be 1.3K, new equity will be 1.3P, and the net asset value per share will be (1.3K)/(1.3P) = K/P, exactly the same as before the issuance.
- The "magic" of issuance becomes ineffective. Without premium space, issuance no longer has the superficial effect of enhancing net asset value per share, and the relationship between new and old shareholders becomes a purely zero-sum game.
Why This Effect is Inevitable:
- The market will not cooperate forever: Investors will conduct valuation analyses, and once they realize that the company's growth relies solely on external funding rather than endogenous profitability, the premium offered by the market will quickly shrink, leading to a drop in share price, thus undermining the premise of "issuing at market price."
- Dilution is an arithmetic inevitability: Unless the company can generate returns (g) with new funds that far exceed the market average and that return can consistently outperform the dilution rate of equity, dilution is an inevitable mathematical result from the perspective of long-term shareholder value.
Ultimately, it can be seen that while the issuance process may be temporarily obscured by the "expansion of asset scale" and "appreciation of target assets," the core issue is that the rights of old shareholders are gradually transferred to new shareholders, who share the accumulated value and premium of the company at a lower cost. The larger the proportion of financing size relative to market value, the faster this dilution effect occurs.
Shorting mNAV Strategy: Expecting BMNR to Underperform ETHA Due to Dilution from Issuance
Based on this, what strategy should you formulate? First, we are optimistic about the continuation of the bull market, so this is an offensive protective strategy regarding BMNR's upcoming issuance.
We believe that its stock price performance will be weaker than Ethereum itself, and we need a strategy that can hedge against Ethereum's price fluctuations while purely shorting its mNAV.
Simply shorting BMNR and going long on ETHA is a directional bet but not precise enough. To accurately short mNAV, we need to use options and strictly follow the intrinsic value per share (priced in ETH) for hedging.
Step 1: Calculate Intrinsic Value per Share
We need to reuse previous calculations to determine the "net asset value" (NAV) of the two assets priced in ETH.
- ETHA's ETH Content: According to iShares official data, 1 ETHA ≈ 0.00756 ETH
- BMNR's ETH Content: Based on its ETH holdings (1,570,000) and circulating shares (173,496,950), 1 BMNR ≈ 0.00904 ETH
Step 2: Determine Hedging Ratio
To strip away the impact of ETH's price movements in trading, we must calculate the hedging ratio based on their "ETH content."
Hedging Ratio:
BMNR:ETHA = 0.00904:0.00756 ≈ 1.2:1 ≈ 6:5
This means that, in terms of intrinsic value, 6 shares of BMNR are approximately equivalent to 5 shares of ETHA in terms of the value they represent in Ethereum.
Step 3: Construct Options Strategy to Short mNAV
Our goals are:
- To bet that BMNR's price performance will be weaker than its intrinsic value.
- To hedge against ETHA's price fluctuations.
Therefore, the correct operation should be buying BMNR put options and selling ETHA put options.
- Buy BMNR PUT: This is the core of our strategy. If BMNR's stock price falls or its increase is less than expected, this position will profit.
- Sell ETHA PUT: This serves as a source of hedging and funding costs. By selling ETHA puts, we collect premiums, expressing our view that "we do not believe ETHA will perform worse than BMNR." This operation hedges against the overall downside risk of the ETH market. If ETH does not drop significantly, this position will profit through the collected premiums.
Taking the 250905 (September 5, 2025 expiration) options as an example:
Assuming current prices: BMNR = $53.49, ETHA = $36.5 (based on $4840/ETH * 0.00756)
We should operate at a 6:5 ratio:
- Buy BMNR PUT: Choose a strike price close to the money, for example, buy 6 BMNR $53 PUTs. The premium paid is $5.00 per contract, totaling $5.00 * 100 * 6 = $3,000.
- Sell ETHA PUT: Similarly, choose a strike price close to the money, for example, sell 5 ETHA $36 PUTs. The premium received is $4.20 per contract, totaling $4.20 * 100 * 5 = $2,100.
Net Cost: Total cost of the strategy = Premium paid - Premium received = $3,000 - $2,100 = $900.
This is a net expenditure strategy, so the maximum loss is the $900 paid.
Profit and Loss Analysis of the Strategy
- Profit Scenario (mNAV Declines):
- BMNR's Increase is Less than ETHA: ETH rises by 10%, and ETHA's price goes from 36.5 to 40.15. Theoretically, BMNR should rise from 53.49 to 58.8. However, due to dilution expectations from the issuance, BMNR only rises to $55. At this point, although your BMNR PUT is losing, its loss is smaller than the gain from the ETHA PUT (which has become worthless), resulting in an overall profit for the strategy.
- BMNR's Decline is Greater than ETHA: ETH corrects by 5%, and ETHA's price drops to 34.6. Theoretically, BMNR should drop to 50.8. However, market panic leads to mNAV contraction, and BMNR drops to $48. At this point, the value of your purchased BMNR PUT increases significantly, exceeding the losses from the sold ETHA PUT, resulting in overall profitability for the strategy.
- Loss Scenario (mNAV Rises or Remains Unchanged):
- BMNR's Increase Exceeds ETHA (mNAV Expands): Market sentiment is euphoric, ETH rises by 10%, but BMNR, as a high-beta asset, rises by 20%. At this point, the BMNR PUT will become deeply out of the money, worth zero, while the sold ETHA PUT will also be worthless, resulting in a total loss of the net cost ($900).
- ETH Crashes: If ETHA's price crashes (for example, below $30), the sold ETHA $36 PUT will incur significant losses, which may exceed the gains from the BMNR PUT, leading to overall strategy losses.
Each strategy has corresponding thoughts, and there is no perfect solution. However, once you have a judgment about the current market environment, the corresponding options combination will help mitigate risks or provide additional rewards when your judgment is correct.
免责声明:本文章仅代表作者个人观点,不代表本平台的立场和观点。本文章仅供信息分享,不构成对任何人的任何投资建议。用户与作者之间的任何争议,与本平台无关。如网页中刊载的文章或图片涉及侵权,请提供相关的权利证明和身份证明发送邮件到support@aicoin.com,本平台相关工作人员将会进行核查。


