Long-term holders are still distributing and have not yet reached bottom characteristics.
Author: Bitcoin Magazine Pro
Translated by: Blockchain in Plain Language

Bitcoin has begun to show significant weakness, with the recent drop below the six-figure ($100,000) mark prompting a reassessment of the near-term outlook. With the loss of some key technical and on-chain levels, I have readjusted my fundamental scenario, indicating that the probability of retesting new all-time highs in the coming weeks has fallen below 50%. This situation could change rapidly if key levels are reclaimed, but until then, market conditions seem to have shifted from a strong bullish trend into a correction phase.
"Buying The Dip"
Bitcoin has experienced a considerable pullback, but buying the dip is not always the best approach unless in a confirmed bull market trend. In a bear market environment, nascent pullbacks can still lead to significant price declines. Short-term and upcoming retracements are typical in a downtrending market, making it increasingly important to react based on data rather than preemptively predicting a bottom.
From our analysis of the previous Short-Term Holder Realized Price chart, we can see this pattern of multiple pullbacks. It is also clear that this indicator acted as key resistance during this phase, with sustained rebounds only occurring after BTC reclaimed the short-term holder realized price level.
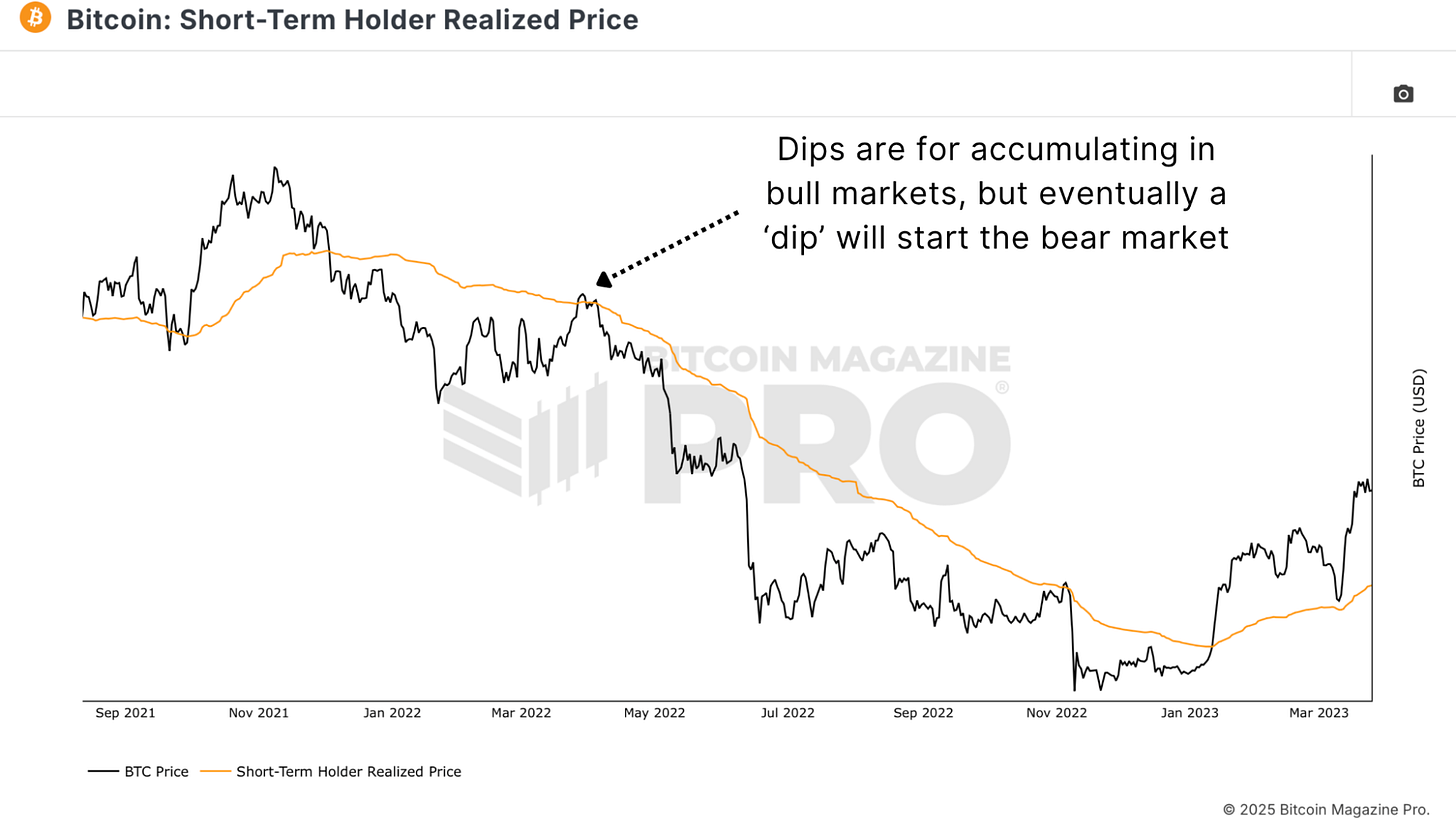 Figure 1: As observed in the previous cycle, multiple pullbacks occurred before reaching the market bottom.
However, there is a caveat: if the price effectively recovers key levels, the entire picture will change. This is why making small allocations during this pullback may be sensible, while delaying further purchases until we see macro consistency in the levels, thus adopting a more defensive approach.
Key Observation Levels
MVRV Z-Score and Bitcoin Realized Price more clearly indicate where the broader market cost basis lies. Currently, the network's realized cost basis is clustering in the $50,000 range, but this number is rising daily.
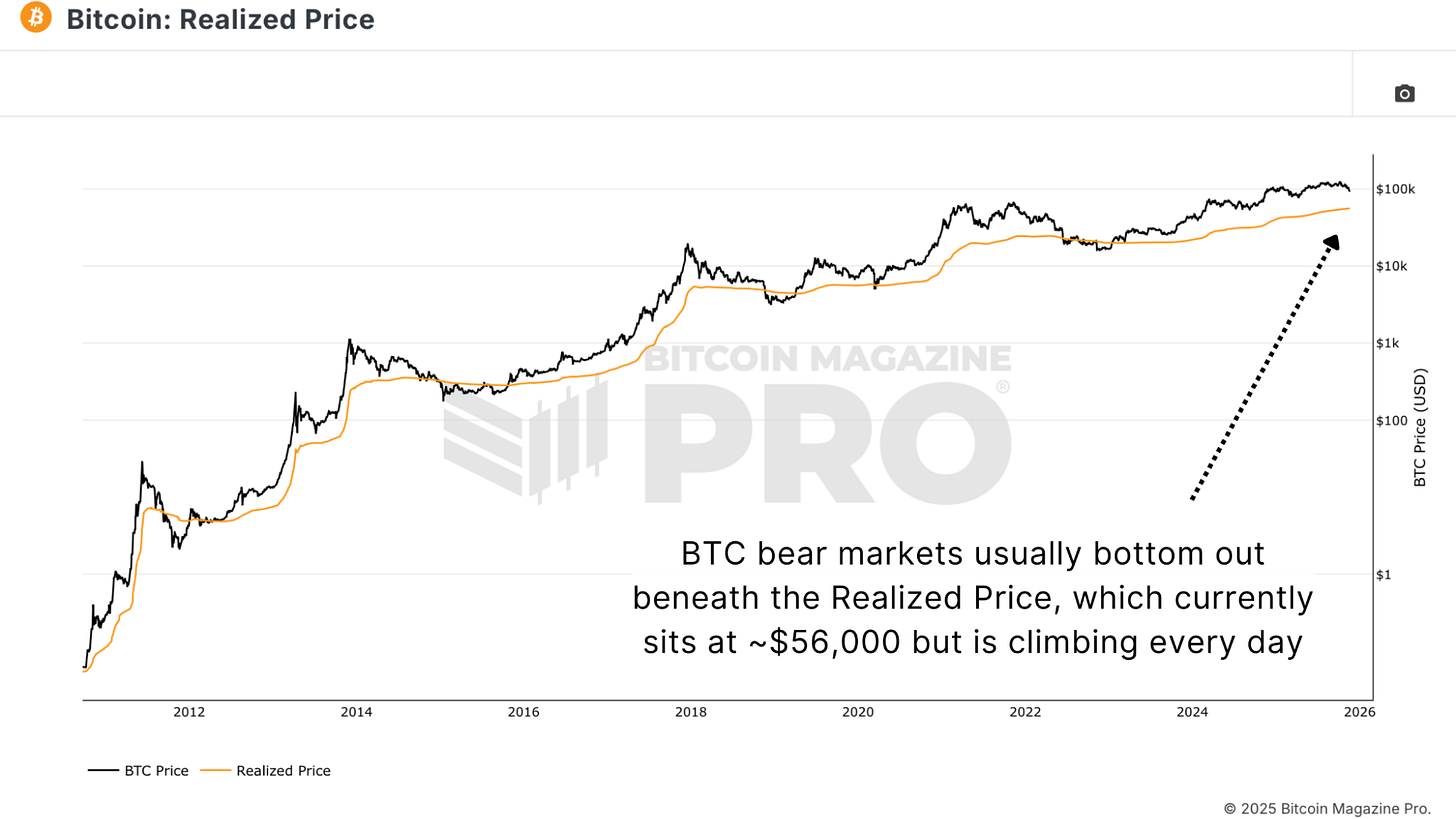 Figure 2: Historically, bear market bottoms typically occur when BTC price is below the realized price.
The 200-Week Moving Average is also showing a similar situation, as it currently sits in the $50,000 range. Historically, the points where this indicator meets the price provide strong long-term accumulation opportunities.
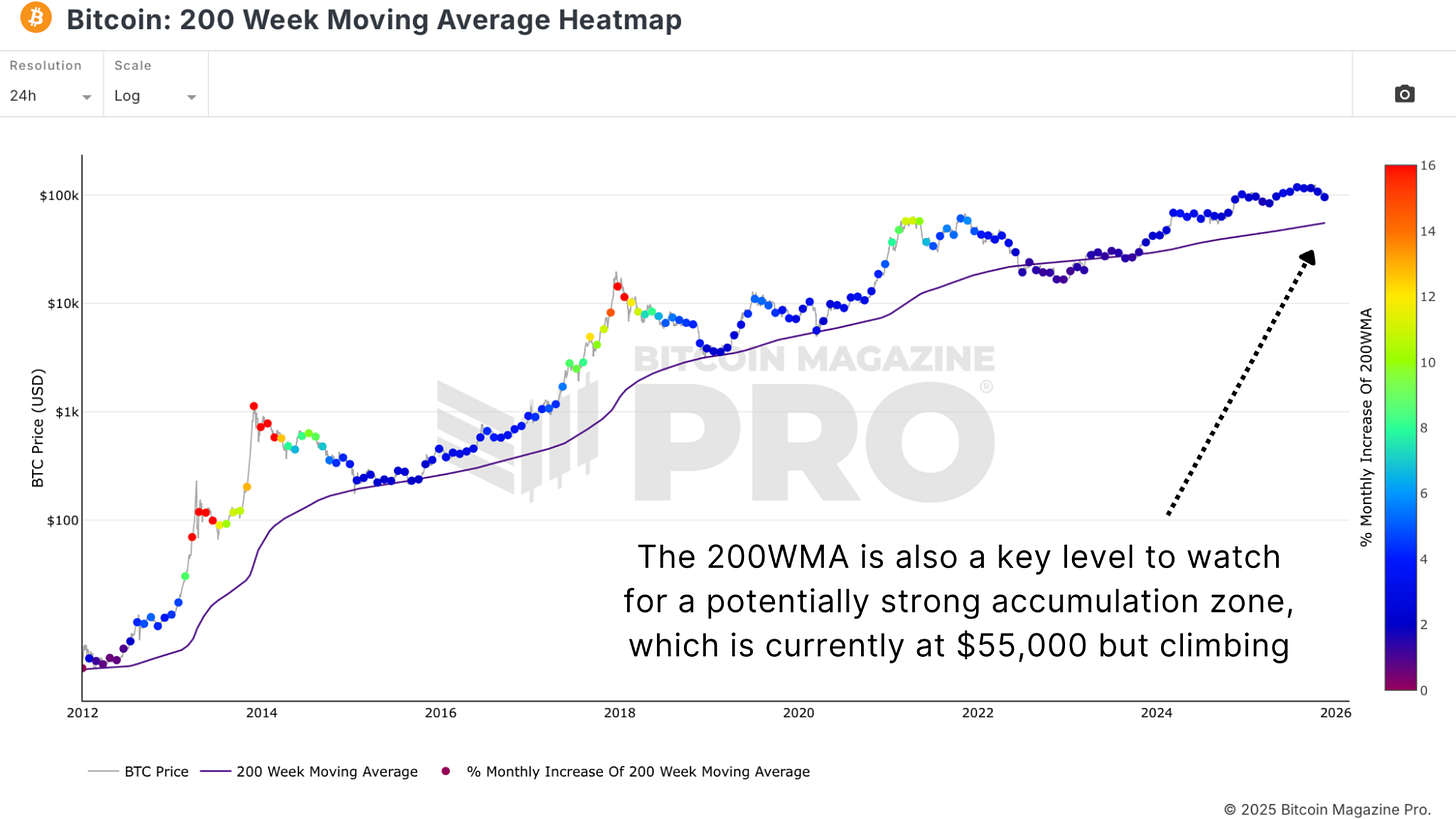 Figure 3: The 200WMA also suggests that $55k is an accumulation point, although it is rising daily.
These are slowly rising each day, indicating that a potential bottom may form at $60,000, $65,000, or higher, depending on how long Bitcoin continues its trend. Importantly, when spot prices trade close to the network's historical average cost, value often appears at levels where key buying support levels provide consistency.
Supply and Demand Signals
The Value Days Destroyed (VDD) Multiple remains an important indicator for identifying pressure points among long-term and experienced holders. Very low readings indicate that a large amount of long-held coins have not been moved, which often aligns with market bottoms. However, short-term spikes may introduce selling pressure, typically accompanying or preceding significant market turning points.
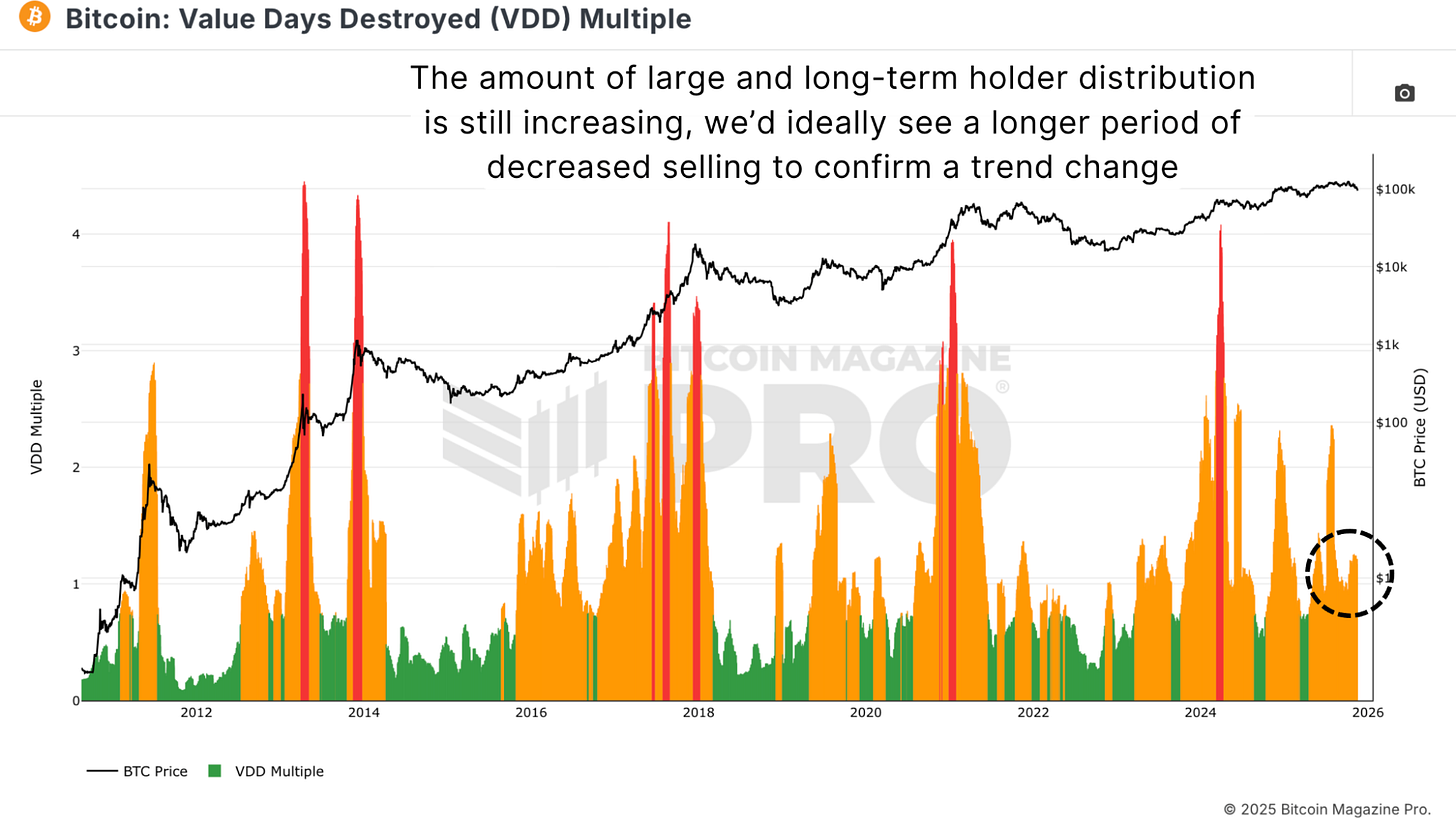 Figure 4: Current VDD multiple readings indicate that larger, more experienced participants in the market remain very active.
Currently, as prices decline, this indicator continues to rise, suggesting that many holders are fatigued from selling. This does not align with the characteristics of a cycle bottom, which typically features extreme forced selling and compression in the short term. At this stage, the market seems to be gradually releasing rather than being exhausted. Meanwhile, Long Term Holder supply ideally should stabilize and begin to increase again before confirming any significant bottom, as bottoms form when the most patient participants begin to hold (accumulate) rather than exit.
Funding Rates
Periods of extreme fear are often clearly manifested through large short positions, as indicated by negative funding rates in Bitcoin Funding Rates and huge realized losses. These conditions suggest that weak hands have capitulated, and strong hands are absorbing this supply.
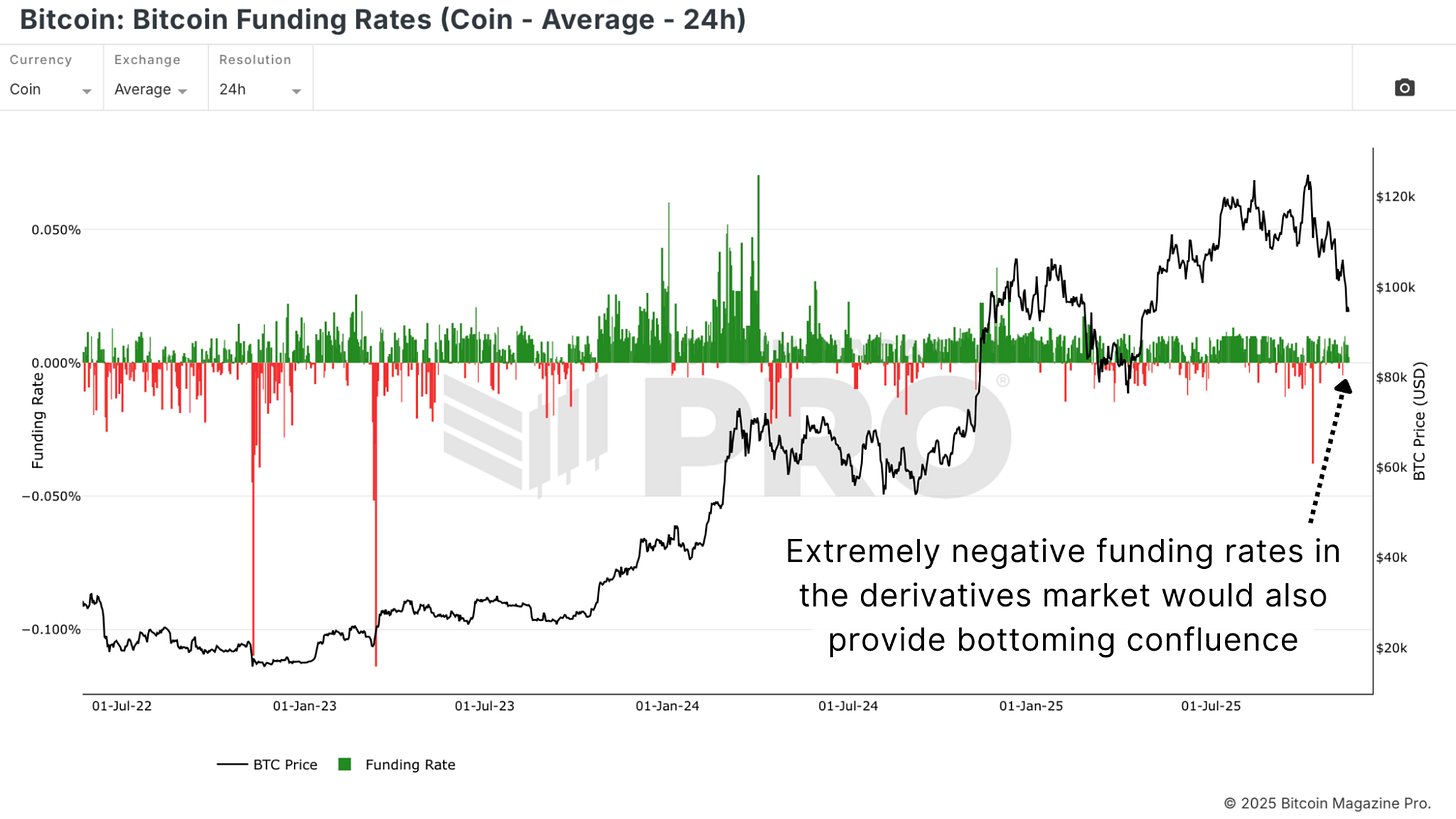 Figure 5: The timing of severely negative Bitcoin funding rates often precedes significant market lows, followed by price rebounds.
The market has not yet exhibited the characteristic panic selling and shorting typically associated with major cyclical lows. Without pressure from the derivatives market and no rush to realize losses, it is difficult to say that the market has fully cleared.
Levels That Must Be Reclaimed
Assuming the bearish scenario is incorrect, which is certainly the preferred outcome. In this case, Bitcoin needs to begin recovering key structural levels, including the psychological barrier of $100,000, short-term holder realized price, and the 350-day moving average, as depicted in the Golden Ratio Multiplier chart.
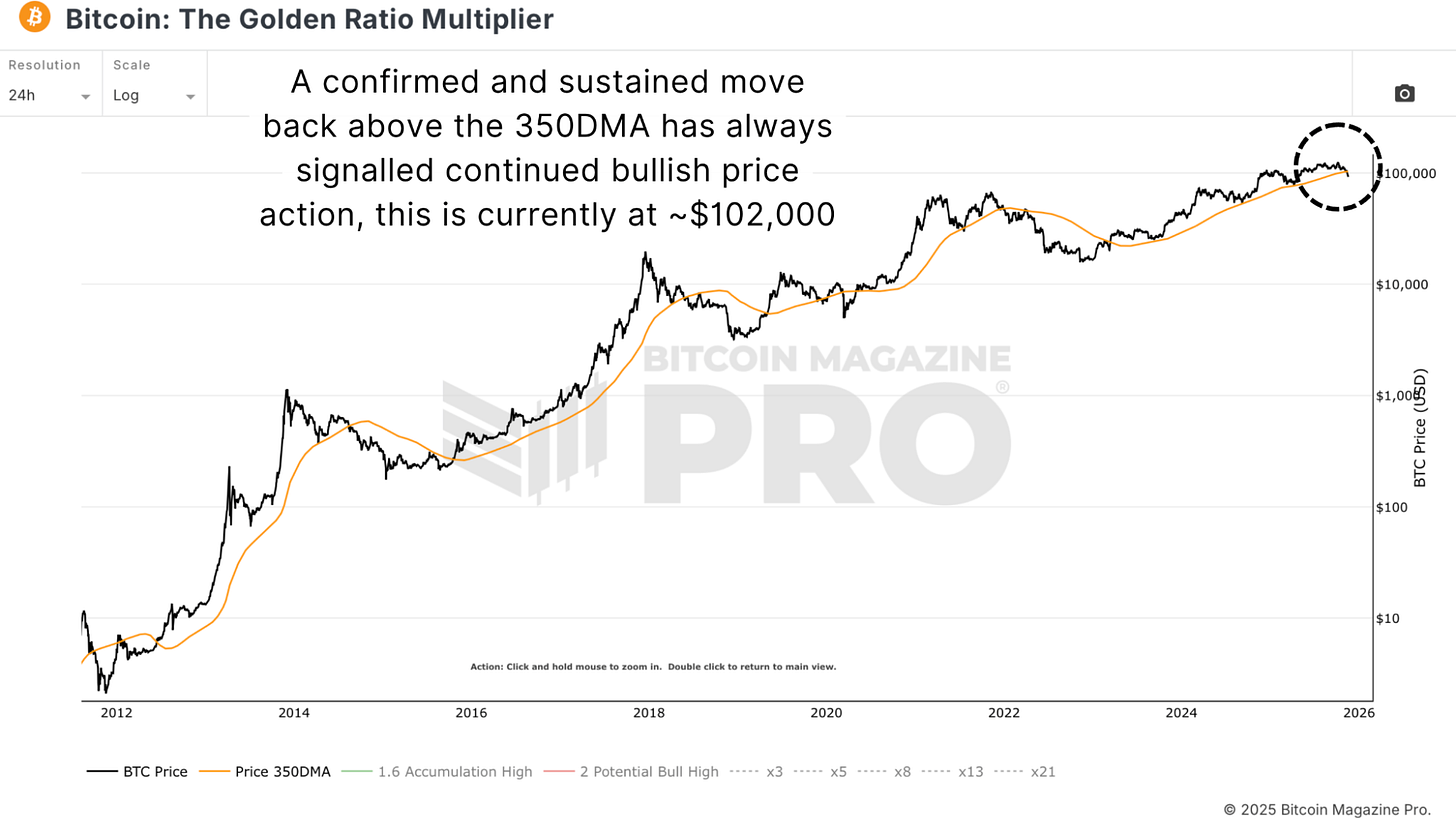 Figure 6: BTC must sustain recovery above the 350-day moving average to revert to a bullish trend.
Sustained closing prices at these levels, along with a strengthening of global risk assets, would indicate that the trend is shifting. But until then, the data temporarily leans towards caution.
Conclusion
Since breaking below several key levels, the outlook has become more defensive. Bitcoin's long-term fundamentals are not structurally flawed, but the short-term market structure is not a healthy bull trend.
Currently, the recommended strategy includes not buying the dip indiscriminately, waiting for consistency to appear before making large positions, respecting macro conditions and trends, and only becoming aggressive when strength is proven. Most investors can never pinpoint the top or bottom of a target; the goal is to position near high-probability areas and have sufficient confirmation of the market's excess for months.
Article link: https://www.hellobtc.com/kp/du/11/6132.html
Source: https://bmpro.substack.com/p/bitcoin-dip-or-new-bear-market
免责声明:本文章仅代表作者个人观点,不代表本平台的立场和观点。本文章仅供信息分享,不构成对任何人的任何投资建议。用户与作者之间的任何争议,与本平台无关。如网页中刊载的文章或图片涉及侵权,请提供相关的权利证明和身份证明发送邮件到support@aicoin.com,本平台相关工作人员将会进行核查。


