This morning, Federal Reserve Chairman Powell mainly spoke about managing market expectations, focusing on "not guaranteeing interest rate cuts," which serves to maintain the independence of the Federal Reserve and shows a different tone from the Trump administration. However, Powell also emphasized that it is difficult to draw conclusions about the limitations of policy based on existing data and did not comment on whether the dollar is weak.
At the same time, the next candidate for the Federal Reserve has also become a source of instability. With the upcoming transition, the Treasury Secretary has stated that a new candidate for the Federal Reserve Chair will be announced within a week, with the transition taking place in February and March. As the candidate is not yet determined, the market remains uncertain about whether the monetary policy will continue.
Bitcoin was affected by this information this morning, showing a large red candlestick, briefly dropping below the $88,000 level, and as of the time of writing, it is reported at $88,260. Ethereum's price also fell along with Bitcoin, reported at $2,960 at the time of writing, as the market digests the changes brought by monetary policy. Observing precious metals, gold has fallen from a new high of $5,600 to around $5,500 after the Federal Reserve's announcement, reported at $5,530 at the time of writing, indicating that market expectations are adjusting downward.
Bitcoin Four-Hour Chart
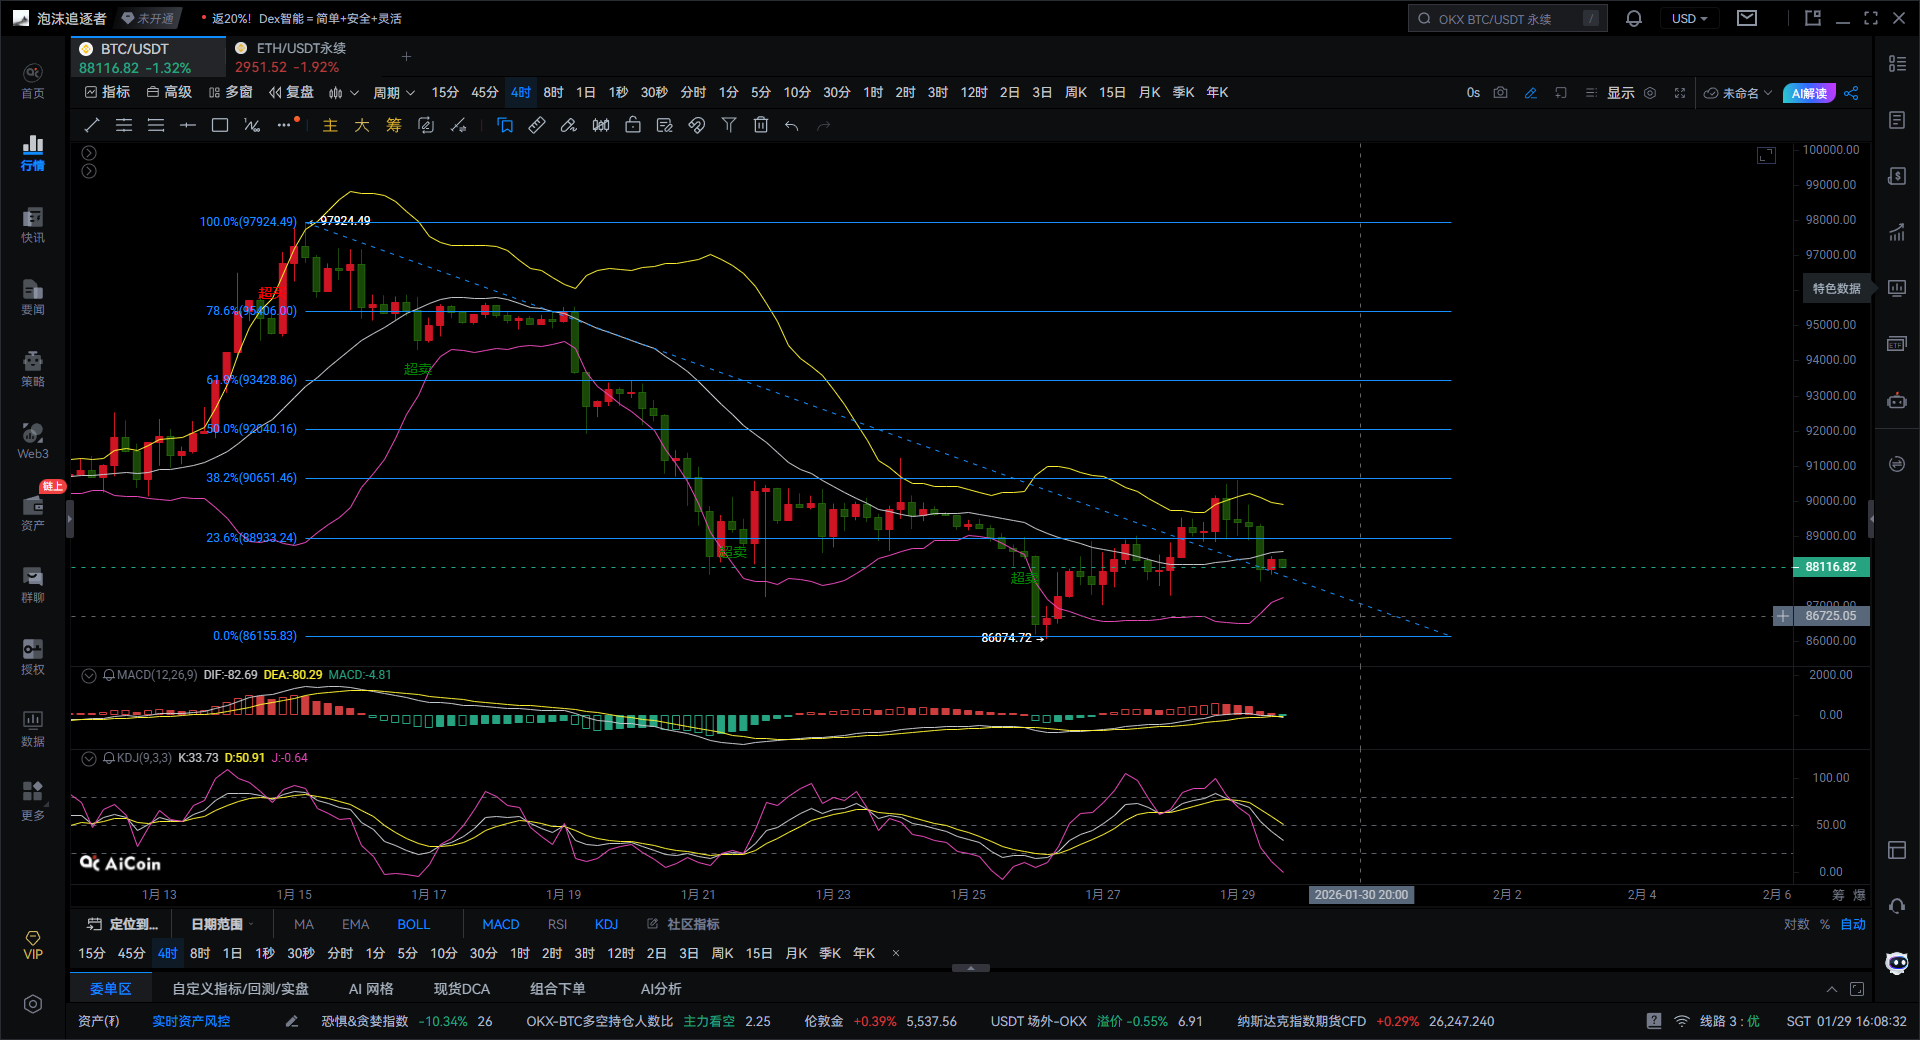
From the chart, several features can be clearly seen: the price highs are sequentially lower, and the lows are also gradually moving down, with a downward trend line consistently suppressing the price. It is important to remember this: until the price effectively stands above this trend line, all upward movements can only be seen as rebounds. Currently, the price is near $88,000, just below the trend line, and is in a sensitive area where multiple technical indicators converge.
The current state of the Bollinger Bands is quite informative, with the bands trending downward. During the rebound, the price has repeatedly touched the middle band but has been suppressed back down, while previously it received support near the lower band, triggering a rebound. In simpler terms, this is a "natural bounce after a significant drop," rather than a signal of a genuine market strengthening. As long as the price cannot stabilize above the middle band, it will be difficult for the market to escape weakness.
Calculating Fibonacci retracement for the previous decline, several key resistance levels are: the 23.6% level is around $88,930, the 38.2% level is around $90,650, and the 50% level is around $92,400. Observing the market, it can be found that the price is currently being suppressed near the 23.6% first resistance level, and the rebound appears weak. This means that the $88,000-$89,000 area has become a battleground for both bulls and bears, with multiple layers of pressure above, making it difficult to break through effectively without sufficient trading volume and momentum.
The current state of the MACD indicator is quite telling, with the energy bars closely hugging the zero axis, and the MACD red and green bars frequently alternating, while the DIF and DEA lines are nearly flat. This pattern is typically interpreted as a "directionless MACD," indicating that the main funds are hesitating and observing here. For the market to strengthen, clear signals need to be seen, such as the red bars continuously expanding and the DIF line decisively crossing above the DEA line to form a golden cross signal; currently, these signals have not yet appeared.
Focusing on the KDJ indicator, it can be observed that with the previous rebound, the KDJ indicator has reached a relatively high position. Currently, the J value shows a clear downward turning sign, and the K and D values are also trending towards forming a death cross. This usually indicates that the short-term rebound momentum may have been exhausted, and there is a possibility of the price testing support downward again.
Next, there may be two scenarios for the market. The first, which has a higher probability, is a weak trend where the price oscillates repeatedly in the $88,000 area before testing the support at $87,000 or even $86,500 again, forming a range consolidation pattern. The second, which is less likely, is a slightly stronger movement where the price quickly rises above $89,000 and attempts to challenge the $90,000-$90,500 area. However, if there is no accompanying increase in volume during the upward movement, it is likely to be pushed back by the pressure above.
It is essential to closely monitor several key positions: the core resistance above is in the $90,000-$90,650 range; the key support below is around $87,200-$86,000. It can be understood that as long as the support at $86,000 is not broken, the market remains in a weak oscillation category; once $86,000 is effectively broken, caution should be exercised as the market may experience a second round of decline.
In summary, the current market situation can be simply described as a rebound nearing its end within a downward trend, presenting an overall weak oscillation pattern. It is neither the beginning of a major upward wave nor an immediate crash, but rather a search for the next direction at a critical position.
Giving you a 100% accurate suggestion is not as good as providing you with the correct mindset and trend; teaching someone to fish is better than giving them fish, suggesting a temporary gain, while learning the mindset can earn a lifetime!

Writing time: (2026-01-29, 16:10)
(Written by - Master Coin) Disclaimer: Online publication has delays, and the above suggestions are for reference only. Investment carries risks; please proceed with caution!
免责声明:本文章仅代表作者个人观点,不代表本平台的立场和观点。本文章仅供信息分享,不构成对任何人的任何投资建议。用户与作者之间的任何争议,与本平台无关。如网页中刊载的文章或图片涉及侵权,请提供相关的权利证明和身份证明发送邮件到support@aicoin.com,本平台相关工作人员将会进行核查。