The cryptocurrency market kicked off the second quarter of 2026 with a subtle balance. Bitcoin closed on March 31 with its first positive monthly growth since September 2025. The spot price stabilized around $68,300. However, data shows that confidence has not fully returned behind this rebound.
The fear index briefly dropped to 8 yesterday, an extreme low seen only seven times since 2018, and today it slightly rebounded to 12. Market sentiment remains frozen in the extreme fear range. Against this backdrop, Bitcoin fluctuated down from a daily high of 69,171 to around 66,230. The 24-hour decline was 2.63%. Ethereum moved in sync, dropping to a low of around 2,032, with a nearly 24-hour decline of 1.13%, reflecting a market characterized by "extreme fear and low volatility."
Bitcoin four-hour chart
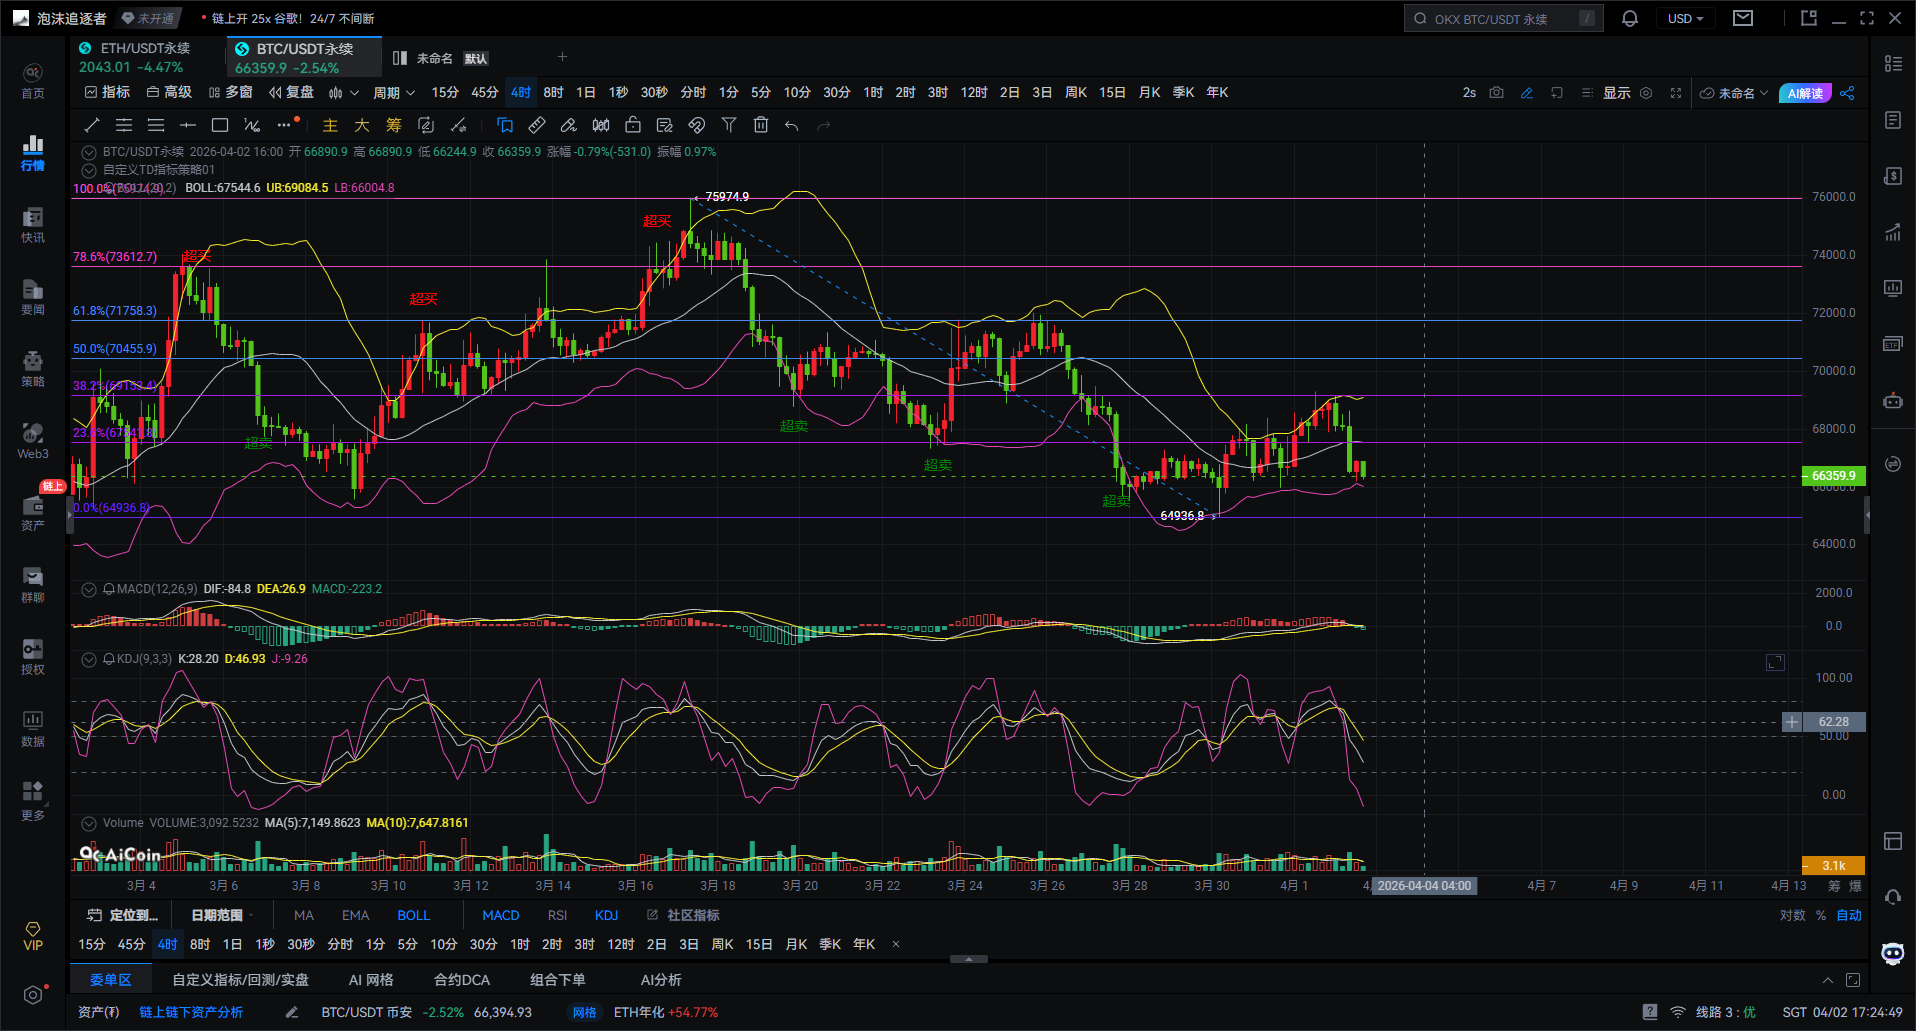
Let’s look at the specific analysis. First, using Fibonacci retracement, I drew the line from 75,974 to 64,936. Several key levels are: 0.236 at 67,541, 0.382 at 69,173, 0.5 at 70,455, 0.618 at 71,758, and 0.786 at 73,612. The current price is around 66,359, hovering near the 0.236 support level. The expert plainly states: this is a short-term support. If it breaks down, we will look for support below 64,936. There are significant resistance levels above at 69,173 and 70,455, making a breakout difficult.
Now looking at the Bollinger Bands. The price is currently close to the lower band, the middle band is relatively flat and slightly downward, and the upper band represses significantly. The conclusion is clear: a short-term rebound may occur, but pressure from the upper band is significant, making it unsuitable to chase after highs.
On the MACD indicator, the DIF line has crossed below the DEA line, forming a death cross. The MACD green histogram is expanding, indicating that bearish strength remains and no golden cross reversal signal has appeared yet. My judgment is: the bearish rhythm has not changed; the current rebound is merely an adjustment.
Regarding the KDJ indicator, both the K line and D line are moving down, with the J value falling close to the zero axis. This indicates a short-term inclination towards bearishness, with insufficient momentum for a rebound and a high likelihood of further retracement.
Everyone must remember the key operational positions. The support level is seen in the range of 64,936 to 65,500. Resistance levels are at those Fibonacci points: 67,541, 69,173, and 70,455. The short-term strategy can be summed up in one sentence: do not chase after highs, patiently wait for the price to retrace to the support area, and see if there are opportunities for low-entry.
In summary, Bitcoin is currently in a repair rebound phase after a decline, but the strength of the rebound is quite limited. To summarize in one sentence: it is sideways digestion with a slight rebound, the bearish trend still exists, and true bullish strength has not yet emerged. First, the rebound has encountered resistance, and the bearish trend remains. Second, do not chase highs, and avoid taking risks. Third, near support levels, observe for any low-entry signals, but ensure there is matching volume.
Ethereum four-hour chart
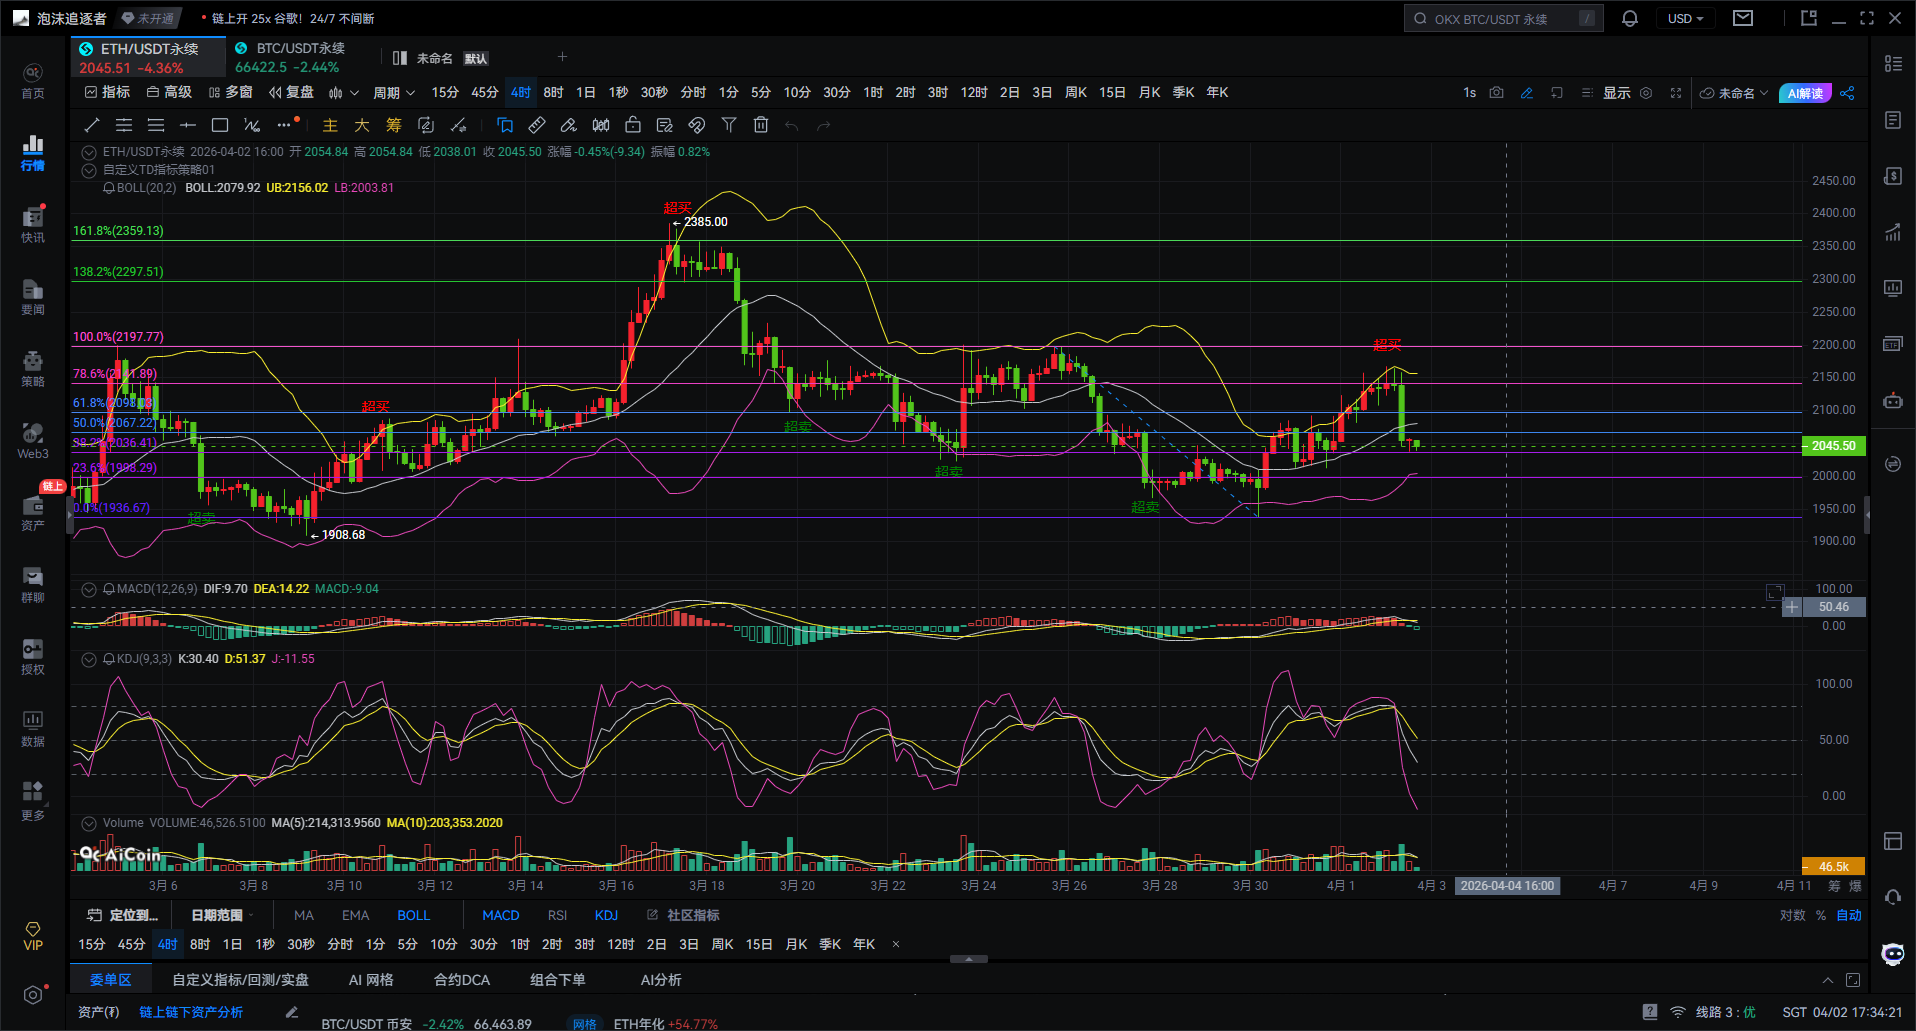
According to the Fibonacci retracement lines drawn on the chart, several key numbers are: 2,114, 2,098, 2,067, 2,036, 1,998, and 1,936. The current price is around 2,045, having already dropped below the 2,067 support level (0.5) and is hovering near the 2,036 support (0.382). The expert bluntly states that the 2,036 level is a relatively strong short-term support. If it cannot hold this level, the price is likely to continue downward to test the range of 1,998 to 1,936, which is the true bottom area for the next stage.
Now looking at the Bollinger Bands indicator. The price has quickly slid down from the upper and middle bands and has now reached below the middle band. The upper band has a significant suppressive effect on the price, while there is still space below the lower band, indicating that the pressure for retracement is indeed considerable. Thus, the conclusion is clear: this wave of rebound is essentially over, and a subsequent retracement will be the main tone; it is not suitable to chase after buying while prices are rising.
The MACD indicator also supports this evaluation. The fast line DIF has crossed downward through the slow line DEA, forming a death cross, and the MACD green histogram, representing bearish energy, is still expanding, indicating sufficient bearish strength. Currently, there are no signs of a golden cross forming at the bottom. Thus, the bearish rhythm has temporarily not changed; retracement may continue for a while.
The KDJ indicator similarly shows a short-term bearish trend. After the K line and D line formed a death cross, they have been trending downward, and the J line has quickly plunged, indicating that the trend of retracement in the short term is quite clear, with bulls temporarily unable to exert strength and unable to organize an effective counterattack.
Based on this analysis, let’s look at the key operational positions. The lower support levels are first at 2,036, then at 1,998, and further down at 1,936, which is a previous stage low. The resistance levels above, in reversal, are the Fibonacci levels of 2,067, 2,098, and 2,114. The short-term operational strategy can be summed up in one sentence: do not rush to chase the rise, nor to chase the bearish drop. Patiently wait for prices to retrace to the 2,036 to 1,998 range, looking for signs of rebound, or simply stabilize there and consider opportunities for low entry.
In summary, Ethereum is currently experiencing a short-term rebound that has likely nearly ended after a decline, entering a phase of sideways movement and retracement. Simply put, the pressure from the short-term pullback is quite significant; it must stabilize near key support levels before there is a possibility for a safer entry opportunity. Three key points: First, this rebound has encountered resistance, and the bearish trend persists. Second, short-term trading should focus on pullbacks and avoid chasing highs. Third, the most critical factor is patience; wait for the market to reach crucial support levels and provide confirmation signals, preferably with accompanying volume before taking action.
Finally, let me remind you: the market moves step by step and does not go straight up or down. When anxious, actions may become distorted, which can easily lead to being shaken out in volatility. In this market, many times, patience and the grasp of rhythm are much more important than simply predicting rises and falls.

It’s better to provide you with a correct mindset and trend than to give you a foolproof piece of advice; teaching someone to fish is better than just giving them fish; advice may make a profit temporarily, but learning to think can lead to lifelong gains!
Time of writing: (2026-04-02, 17:25)
(Article - Expert Talks Crypto) Disclaimer: The online publication may have delays; the above advice is for reference only. Investment involves risks; proceed with caution!
免责声明:本文章仅代表作者个人观点,不代表本平台的立场和观点。本文章仅供信息分享,不构成对任何人的任何投资建议。用户与作者之间的任何争议,与本平台无关。如网页中刊载的文章或图片涉及侵权,请提供相关的权利证明和身份证明发送邮件到support@aicoin.com,本平台相关工作人员将会进行核查。