Currently, although the third-quarter reports of U.S. stocks have not yet concluded, the peak of concentrated disclosures has already passed. Looking back at the companies that have been announced, what is most noteworthy is not how many exceeded expectations, but rather that financial reports sometimes align with subsequent market movements and other times diverge. According to the results of relevant predictive events by OKX, AMD's revenue in the third quarter grew by 45% year-on-year, meeting the set threshold, and the price increased on the first full trading day after the earnings report; Robinhood set a revenue record, yet its designated earnings per share did not meet expectations, and the price did not increase on the first day. SK Hynix's quarterly revenue and operating profit also reached record highs, its designated profit target was not met, yet the price increased on the first day; Microsoft's and Apple's performance exceeded expectations, but their prices did not rise.
These results include expected growth as well as unexpected outcomes that warrant a review. Whether AI investment can be converted into profit, whether consumer demand can persist, and how the quality of financial platform revenue is, are not the same questions addressed by several companies. OKX's platform split two of these judgments into predictive events: one asked whether the earnings report met the previously set threshold, while another inquired whether the price increased on the first full trading day after the report was released. Looking back at the earnings season through these two questions allows for a clearer view of the gap between "what report card the company delivered" and "what price the market is willing to pay for it."
24 companies, 12 had opposing answers to the two questions
We compiled 48 earnings report predictive events from OKX's platform from October 20 to November 10, covering 24 companies, with two types of questions for each company. The combinations of performance and first-day price are as follows; among them, "Meeting the earnings threshold" follows the preset indicator thresholds of each event, while the price direction adheres to the settlement criteria of the activities, which does not equate to the specific increase or decrease of U.S. stock spot prices.
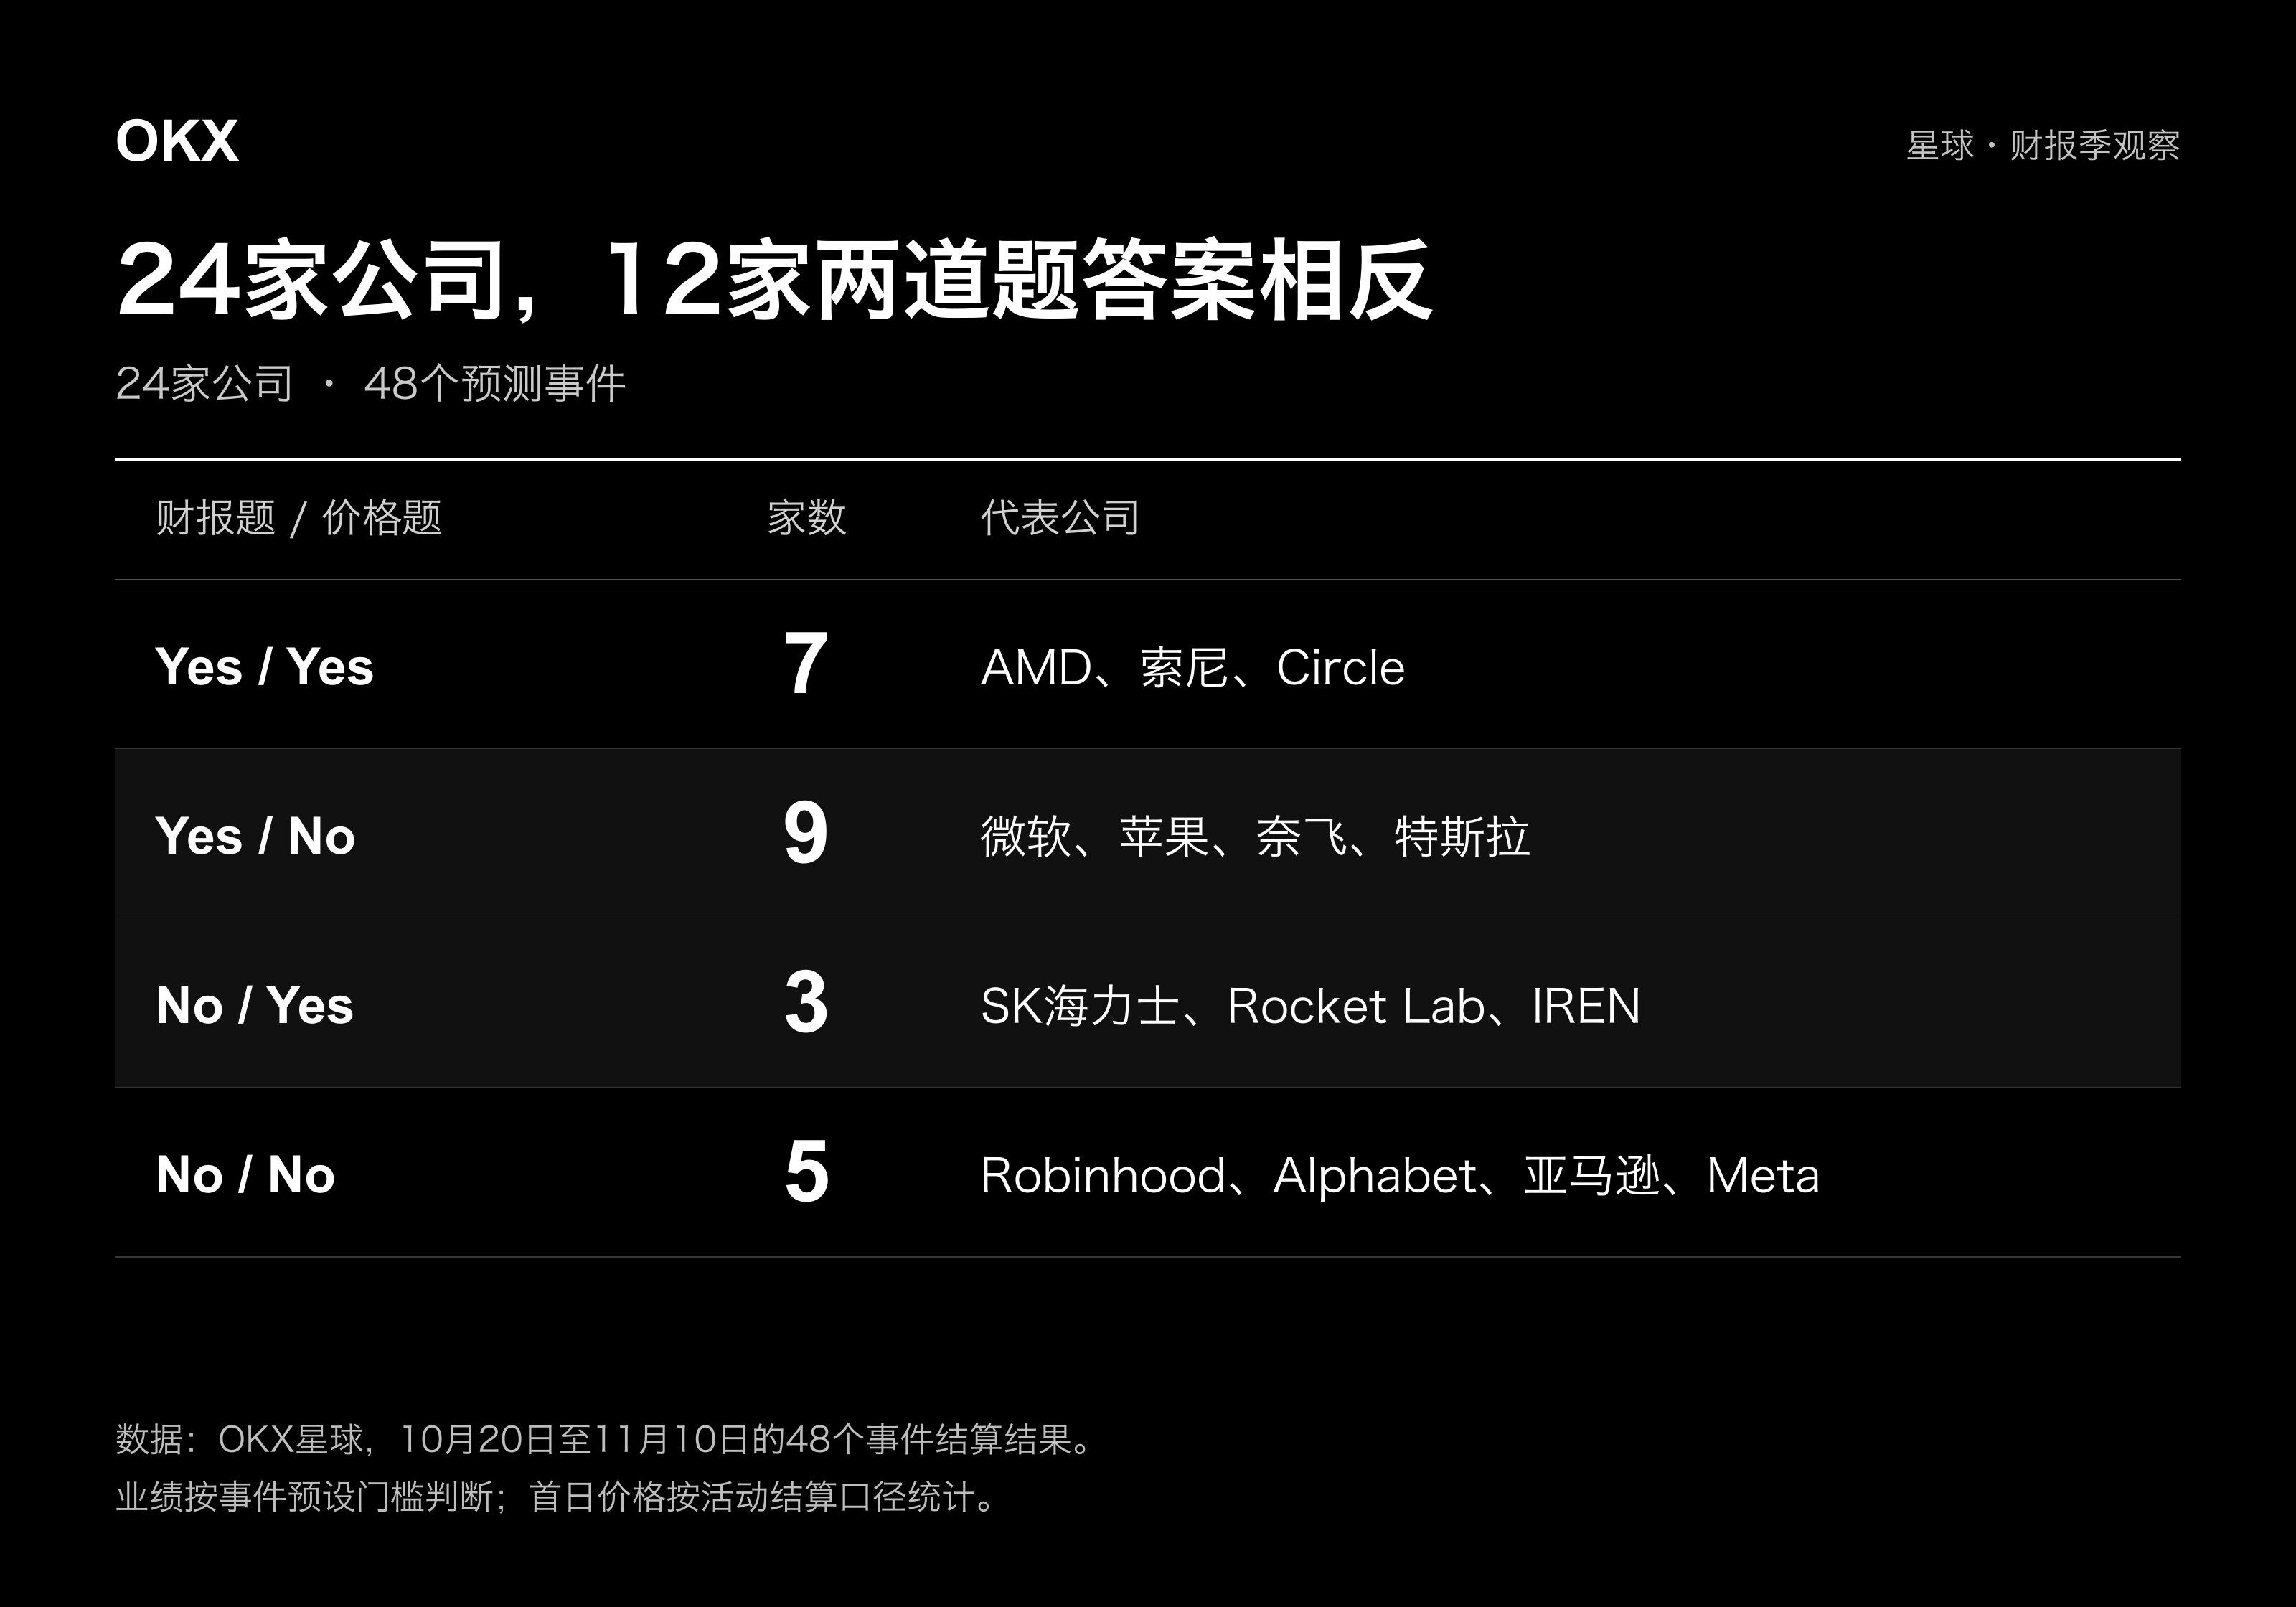
Among the 24 companies, half had performance and price directions that differed. Notably, within the 16 companies that exceeded their performance targets, only 7 saw an increase on the first day, accounting for 43.8%; among the 8 companies that did not meet their targets, 3 also saw an increase, accounting for 37.5%. The percentages of increases in these two groups differed by only about 6 percentage points.
This small sample is insufficient to estimate long-term trends, yet it indicates that during this round of observation, simply knowing "whether performance exceeded expectations" provides limited help in distinguishing whether the price will go up on the first day. The 9 companies that did not rise after exceeding expectations cannot all be uniformly explained as experiencing operational deterioration. They may still be growing; however, the degree, quality, or sustainability of that growth did not provide sufficient new reasons for the price to continue rising.
When placed back into the overall earnings season context, two layers can be observed: corporate earnings generally surpassed analyst benchmarks, but "surpassing the benchmarks" itself is no longer scarce information; investors also need to judge whether this earnings report can push up subsequent earnings expectations. Although the S&P 500 statistics from FactSet and OKX's event thresholds for these 24 companies are not directly comparable, the former provides context that when exceeding expectations becomes common, the real differentiator is how much it surpasses, and whether it can sustain that growth; the latter provides a comparison of performance and price response, revealing a point that is easily overlooked when only looking at the proportion of earnings meeting standards—exceeding earnings thresholds does not mean the market is willing to pay a higher price. To understand this discrepancy, further judgment is needed on whether these performance improvements have already been reflected in the price.
Is the closer to the result, the more accurate the prediction?
This round's predictions regarding performance were generally optimistic. Three hours before the earnings reports were released, 20 out of 24 companies had performance predictions leaning towards yes, yet only 16 ultimately met the thresholds. Among the 6 performance questions with inconsistent directions, 5 belonged to those that were previously optimistic yet did not exceed expectations, involving SK Hynix, Alphabet, Amazon, Robinhood, and Meta; only Oklo diverged with an opposite result.
In other words, the main deviation was not a general underestimation of companies, but an overestimation of some companies' likelihood to reach profit thresholds. The difference between industry prosperity, revenue growth, and profit realization is precisely where these companies need to further analyze. But how much will these judgments be corrected as results approach? The changes in the two types of predictions are not the same.
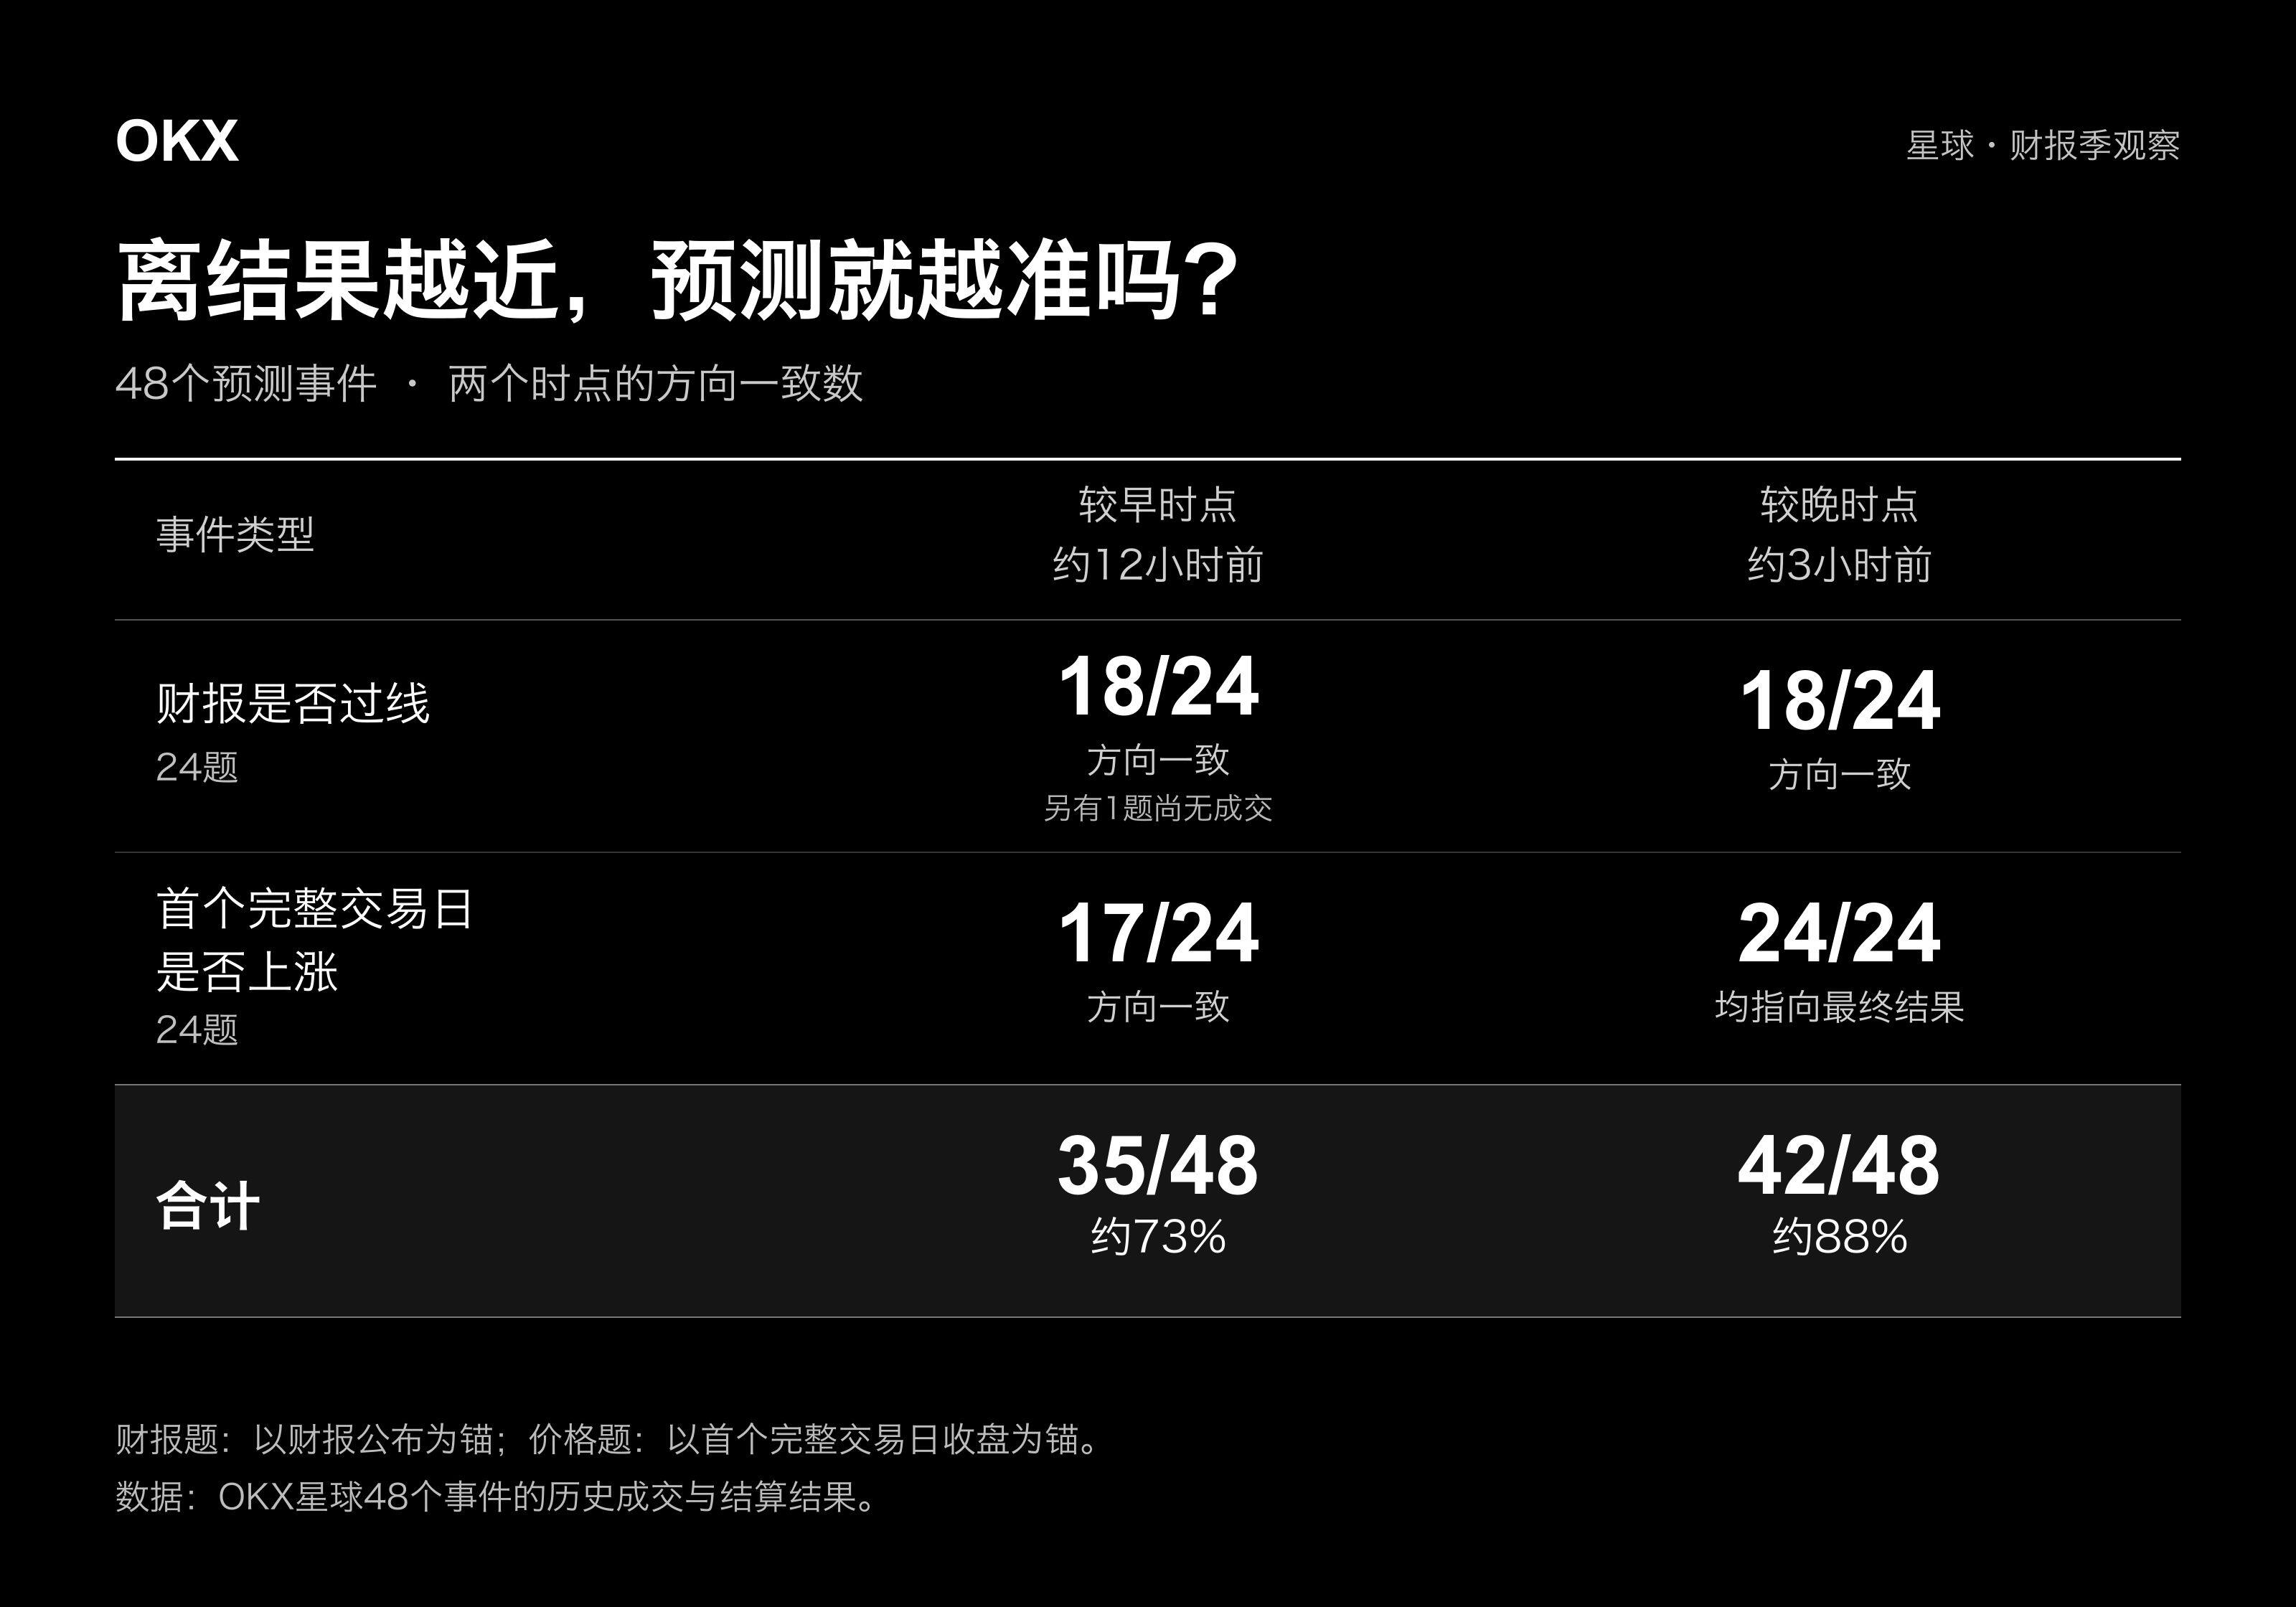
In total, the judgments consistent with the results increased from 35 to 42, with the proportion rising from about 73% to 88%. All 7 net increases came from price predictions, with the price judgment increasing from 17 consistent judgments to 24, while the performance predictions remained consistent at 18 at both time points. Therefore, this set of data shows that the improvement occurred in tracking market dynamics rather than in the early estimation of corporate earnings.
The two faced different information conditions. Before the earnings report is released, even with only 3 hours left, participants may not have gained enough new evidence to alter profit estimates, and earlier optimistic or pessimistic judgments may still prevail. When price predictions near the close of the first full trading day, the earnings report has been released, and the market has reacted for most of the trading day, making it easier for judgments to align with the results. This set of data supports "new information and market feedback help correct judgments" rather than "the longer you wait the more accurate the predictions become." For market research, subsequent pricing can help observe whether the market accepts the initial interpretation of the earnings report, but cannot retroactively prove that prior judgments are equally reliable.
How does a 50% predictive discrepancy lead to a single answer?
A reading close to 50% is still insufficient to form a clear judgment. Intel's performance question had a yes trading price of 51% twelve hours before the announcement, and it ultimately met the earnings threshold; meanwhile, Amazon had reached a reading of 53% but ultimately did not exceed its threshold. Both slightly leaned optimistic but led to different results. For these types of companies, it is more worthwhile to research where the discrepancies lie, such as whether there is consensus on revenue growth, whether profit margins, costs, or next-quarter guidance vary in estimates. Interpreting 51% or 53% directly as "the market is optimistic" amplifies a very small leading margin.
A stronger inclination does not necessarily point to the correct answer. Oklo's performance question had yes trading prices of 20%, 18%, and 11% six hours, three hours, and one hour before the earnings report, respectively, yet it ultimately met the threshold. In contrast, SanDisk saw a rise from 57% twelve hours before the announcement to 65% three hours prior, indicating a growing optimism, and ultimately it also exceeded the threshold. One fell and one rose; both changes need to be explained through operational information and profit estimates; price changes themselves cannot substitute for evidence supporting the judgments.
7 corrections, 5 bullish judgments retracted
Further examining the 7 price judgment corrections, Netflix, Microsoft, Tesla, Meta, and AST SpaceMobile shifted from a bullish to a neutral stance; Rocket Lab and AAOI adjusted in the opposite direction. As the trading day progressed, some of the originally optimistic price expectations did not hold.
The relationship between predictions and market dynamics is not merely "predictions come first, verification follows." Before the earnings report, price records show what participants are willing to believe; after the report, operational data, management guidance, and trading dynamics can conversely alter prices. For analysts, the most valuable insight is identifying what information caused the judgment to pivot. If bullish expectations continue to decline after meeting profit targets, one should check whether the initially optimistic growth has already been priced in, or whether new guidance has weakened it; one cannot solely deduce from a price drop which factor caused the decline.
If the figures in the earnings report are correct, why would prices still diverge?
First, look at Robinhood. Its third-quarter revenue was $1.42 billion, a year-on-year increase of 12%, setting a record; yet GAAP earnings per share fell by 16% to $0.51, and adjusted earnings per share also fell by 3% to $0.60. Even without discussing which metric was used, the failure of revenue growth to translate into per-share profit growth poses a question the earnings report itself needs to answer. Robinhood earnings announcement
Internally, revenue did not strengthen uniformly. Revenue from options and stock trading increased by 31% and 41% respectively, but cryptocurrency trading revenue decreased by 55%, and net interest income fell by 9%. The total revenue record obscures the ebb and flow between different business segments. For such platforms, whether new revenue can compensate for the decline of existing businesses and leave more profit is more significant than whether total revenue hits a new high. It did not meet the profit threshold, and the price also did not rise on the first day, at least aligning with the characteristic of earnings reports where “growth did not universally improve profit,” rather than being merely an issue of settlement criteria.
SK Hynix presents a different situation. Although the designated profit metric did not exceed the threshold, the company reported record high revenue and operating profit; more forward-looking information indicates that the sales of HBM4 and high-value server products have expanded and covered over half of the production capacity through long-term agreements from 2027 to 2028. SK Hynix earnings announcement This information provides investors with an observation basis beyond the quarterly earnings per share, whether the proportion of high-value products can continue to rise, and whether future capacity has existing demand. Long-term agreements do not guarantee future profits, but they help assess the visibility of growth. This is also why missing a specific metric in the season does not necessarily overturn the judgment on subsequent operations.
The differentiation in the AI industry chain is clearer between Microsoft and AMD. Microsoft's revenue grew by 19% that quarter, and operating profit increased by 21%, with Azure revenue rising by 48%, which is not a report reflecting weak demand. However, its operating cash flow was approximately $58 billion, and cash capital expenditures were about $39.37 billion; calculating the difference between operating cash flow minus this expenditure results in approximately $18.63 billion, lower than the $25.66 billion in the same period last year, representing a decrease of about 27%. This calculation does not include financing lease contributions. Microsoft earnings report and cash flow statement
While profits are increasing, the cash left after expenditures is decreasing, indicating that business expansion still requires faster capital input. For cloud platforms, the next step is to prove not only that "customers need AI," but also whether the newly added computing power can be sustained, whether pricing can cover input, and how depreciation and operating costs impact future profits. Microsoft exceeded performance expectations, but the price did not rise on the first day, which can continue to be studied along this line and cannot be simply classified as "the market did not understand the good earnings report."
AMD is at the other end of this investment chain. Its third-quarter revenue grew by 45%, data center revenue increased by 97%, GAAP operating profit margin rose from 14% year-on-year to 21%; the midpoint revenue guidance for the fourth quarter is about $17 billion, corresponding to a year-on-year growth of about 66%. AMD earnings announcement Here, there is not only revenue growth but also margin improvement and next quarter's growth expectations. Compared to simply surpassing quarterly earnings expectations, this set of information is more helpful in supporting the judgment that growth can be sustained.
When comparing the two companies, it does not imply that the purchasing companies always decline while the selling companies always rise; rather, the same round of AI investments leaves different marks on each company's reports, with platforms initially bearing the construction and recovery cycles, while suppliers may confirm income and profits more quickly. One cannot expect them to necessarily yield similar cash returns in the same quarter just because they both benefit from AI.
Apple further provides another clue. Revenue grew by 12% that quarter, and earnings per share increased by 14%, but the earnings per share included about $0.05 of tariff refunds, positively impacting the gross margin by about 1 percentage point. Apple earnings report This does not deny the growth of the main business, but it means that when judging the next quarter's profits, one must distinguish which improvements can be sustained and which are due to unique current factors. The earnings report figures are real, but the sustainability still requires separate judgment.
These cases collectively point to a trend where the quality of growth and the timing of realizing that growth better explain company differences than simply meeting profit thresholds. To further elucidate the first-day market behavior, it is necessary to consider the earnings report alongside previous valuations, contemporaneous sector performance, and management guidance, rather than simply picking a figure from the report that aligns with price movements.
Out of a thousand predictions, only three people answered 26 questions correctly in a row
Shifting from overall samples to individual judgments adds another layer of difficulty. The second round of OKX's platform "Earnings Report Grand Winner" attracted over 1,400 participants; by the middle of the competition, only Lin Mo Yang, abingttt, and the Speculation Lab remained. The three consecutively answered 26 questions correctly and tied for first place, sharing a prize of 10,000 USDT, with each receiving about 3,333 USDT, during which they all used a revival opportunity once.
The challenge of continuous competition lies in the continuously changing subjects of study. Cloud platforms, chip manufacturers, trading platforms, and consumer electronics companies each have different variables impacting profits and valuations. The reasoning that was correct in the previous round may not remain the most important factor for the next company. The interviews with the three players during the tournament left a record of how they dealt with these differences.
The first failure: all three fell on Hynix
The first failure for all three occurred with SK Hynix. Lin Mo Yang and abingttt erred on the performance question, while the Speculation Lab erred on the price change question. Lin Mo Yang mentioned in an interview during the tournament that he misunderstood the relationship between the trading cutoff and the settlement snapshot, and adjusted his judgment to earn XP, thereby consuming his revival opportunity. His research habit involves gathering information along the upstream and downstream supply chain, using AI to integrate company operations, industry developments, etc., and then discussing and verifying. The value of this method lies in placing the growth of an individual company back within the industry chain; Microsoft’s investments can become the demands of suppliers, but one must also continue to check orders, deliveries, and whether profits align.
Similarly failing on SK Hynix, the performance question and price change question exposed different issues; the former required reviewing profit estimates, while the latter required understanding why the market was still willing to trade future demand when the current indicators did not meet thresholds. This also corresponds to the repeated divergence in this round, where industry prosperity does not guarantee that every profit indicator will meet benchmarks, and missing profit targets does not automatically erase future growth value.
Abingttt and the Speculation Lab also had different methods. Abingttt placed together earnings per share, revenue, consensus expectations, and company guidance, examining how much optimism was already reflected in the price before the earnings report; the Speculation Lab separated profit estimates from price judgments, referencing implied volatility from options and the long-short ratio of OKX perpetual contracts, and also looked at discussions in the platform that were contrary to their own direction. Each piece of information has its uses; earnings reports help estimate how much a company can earn, while derivatives and predictive pricing help observe what the market has bet on, and the two cannot substitute for one another.
The three consecutive winners, which questions did they finally answer incorrectly?
In the last round, all three judged that AMD and Circle would not rise on the first full trading day after the earnings report, yet the actual results were both upward. Both companies met the performance thresholds, and the first-day market also moved in the same upward direction; this time, the common failure was not regarding profit judgments but price judgments.
From the earnings report itself, AMD provided data center expansion, margin improvement, and subsequent growth guidance, so it is not reasonable to pre-assume that just because Microsoft and Apple previously "exceeded expectations but did not rise," it will replicate the same path. Studying earnings reports requires recognizing anomalies while accepting that strong performance and rising markets can indeed align. "Exceeding expectations may still drop" is just a scenario to guard against, and should not become another mechanically applied formula.
As earnings season concludes, what usable judgments remain?
The most worthwhile judgment to retain from this earnings season is not "how good are U.S. stock earnings," but rather that earnings growth, the quality of growth, and valuation resilience are being tested separately. FactSet statistics indicate that the forward P/E ratio of the S&P 500 dropped from 19.0 times at the end of September to 17.7 times on November 6, showing a decrease in the multiple of price concerning future earnings expectations, which does not imply that corporate earnings are weakening concurrently. Subsequent earnings reports still need to verify along these lines: whether AI suppliers' orders can continue to translate into profits, whether new inputs from cloud platforms can yield cash returns, and whether revenue growth from consumer and financial companies can improve per-share earnings. The answers to these questions will determine whether growth is becoming more solid or if it requires more funds and longer time to sustain.
The value of predictions should also be measured in this process. Before the earnings report, they reflect market expectations; after the report is released, they record how those expectations are adjusted by operational data and market movements. Truly useful feedback comes from identifying areas where one overestimated growth, underestimated inputs, or mistakenly took short-term profits as long-term trends, and then adjusting judgments accordingly. Being right about direction does not equate to making money. Rather than remembering a string of wins and losses, the more valuable takeaway is the continuous refinement of research methods.
免责声明:本文章仅代表作者个人观点,不代表本平台的立场和观点。本文章仅供信息分享,不构成对任何人的任何投资建议。用户与作者之间的任何争议,与本平台无关。如网页中刊载的文章或图片涉及侵权,请提供相关的权利证明和身份证明发送邮件到support@aicoin.com,本平台相关工作人员将会进行核查。


