Crypto Circle News
September 7 Hot Topics;
1. ARK Invest invests $23.5 million in BitMine and Bullish stocks
2. Ethena rises 12% after StablecoinX receives a $530 million investment from the Treasury Company
3. Tether CEO reveals that the crypto communication app Keet plans to support BTC, USDT, and XAUT payments
4. Hyperlabs core contributor cancels delegation of 25.4 million HYPE from foundation nodes and redistributes
5. Morph announces its refund plan: officially ends the black card and platinum card programs
Trading Insights
Share 4 hidden K-line signals from market makers to avoid 50% of pitfalls! 1. False Breakout: The "Previous High Trap" set by market makers ① Characteristics: Price quickly falls back after reaching the previous high, with trading volume shrinking compared to the average of the previous 3 days (rather than increasing), akin to "hanging a false light" to lure buyers. ② Key distinction: A true breakout requires volume and price to move in sync, with volume at least 1.5 times the average of the previous 3 days; a false breakout only "touches" the previous high, with weak volume. 2. Yin-Yang "Washing Needle": Emotional manipulation by market makers Core observation: At support levels (like MA60), the appearance of "Yin Needle + Yang Needle" signals a washout test of panic selling by market makers; at resistance levels (like previous highs), the appearance of "Yang Needle + Yin Needle," with increased volume on the Yin Needle (like 2 times), indicates a lure for selling. 3. Long-term Consolidation: Market makers' "Hawk Waiting" accumulation technique ① Misconception: Consolidation is not a lack of movement, but a method for market makers to exhaust retail patience, with direction often revealed at the end of consolidation. ② Technique: Consolidation lasting over 15 days leads to stronger momentum after a breakout; a true breakout requires simultaneous increase in volume and price, while a false breakout sees price rise with shrinking volume (market makers "drawing a door"). 4. Sharp Top vs. Round Bottom: Signals of "Selling" and "Accumulation" from market makers ① Sharp Top (Selling): A rapid rise followed by a sharp drop forms a "sharp knife" shape, often accompanied by massive volume (trading volume exceeding 3 times the usual), leaving no time to exit. ② Round Bottom (Accumulation): A slow grind up forms a "round pot" shape, requiring low volume (trading volume reduced to below 50% of the average of the previous 3 months). Final reminder: K-lines are the "footprints" of market makers; while these patterns are not 100% accurate, mastering them can at least help avoid half of unnecessary losses. Now, by opening the K-line chart for comparison, you can discover signals you may have missed. The crypto circle is a game of hunters and prey; understanding the "subtext" can help you be less harvested and more proactive.
LIFE IS LIKE
A JOURNEY ▲
Below are the real trading group orders from the Big White Community this week. Congratulations to the friends who followed along; if your operations are not going smoothly, you can come and test the waters.
Data is real, and each order has a screenshot from the time it was issued.
**Search public account: *Big White Talks About Coins*
BTC
Analysis
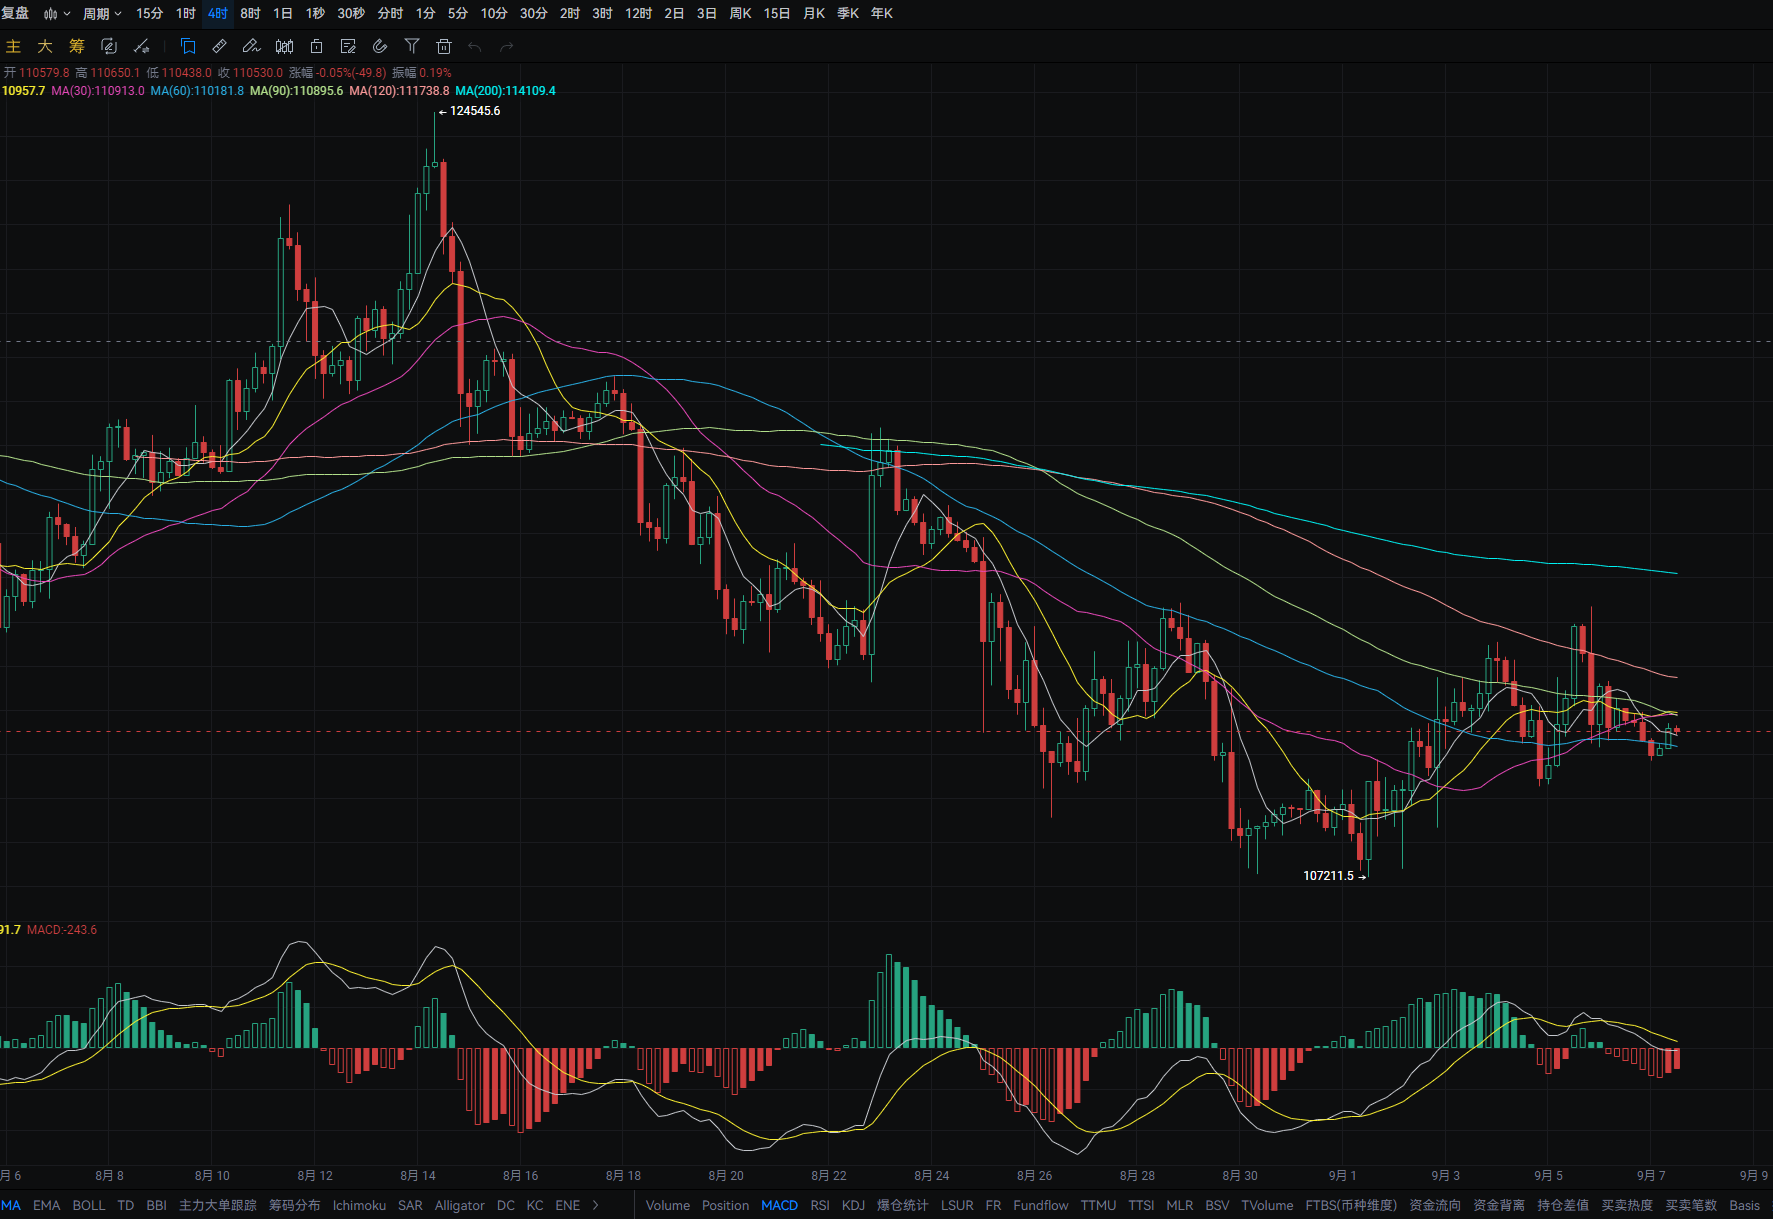
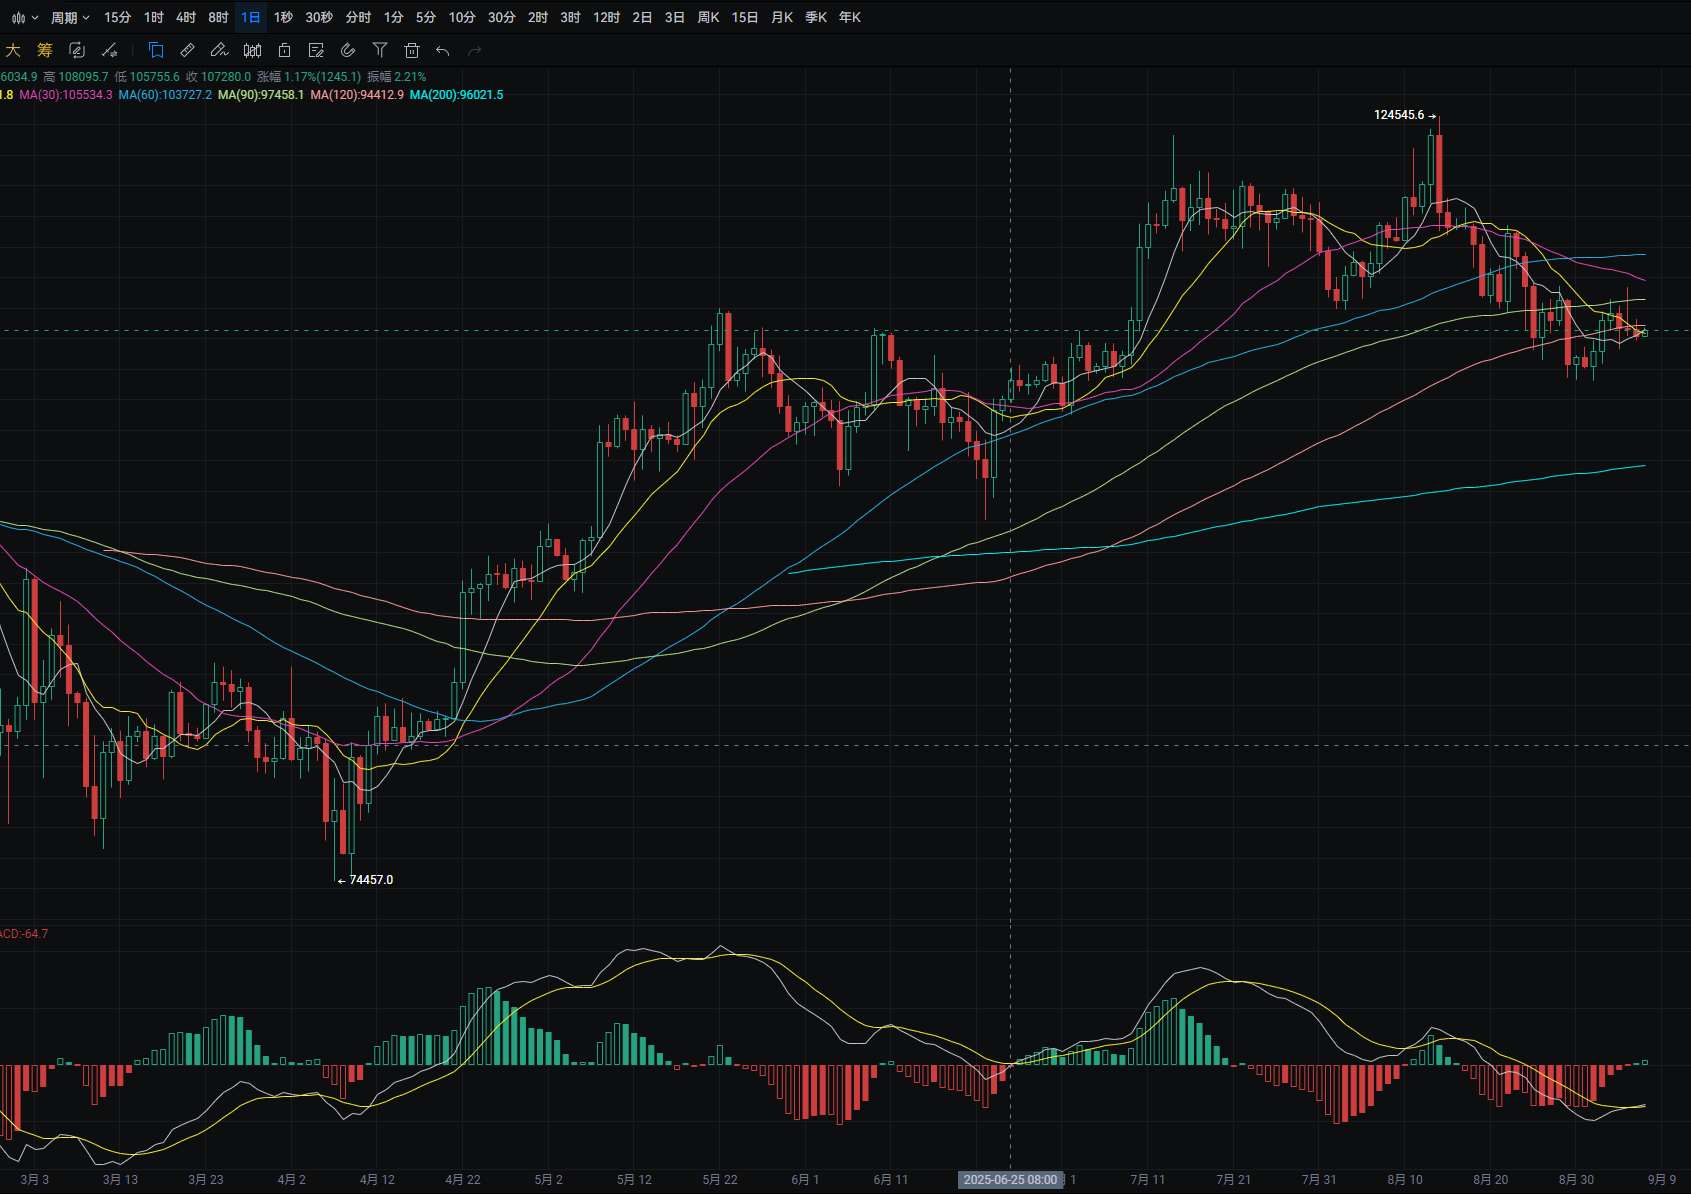
Bitcoin's daily line fell from a high of around 111,250 to a low of around 109,850 yesterday, closing around 110,150. The support level is around 109,200; if it breaks, it could drop to around 107,400. A pullback can be used to buy near this level. The resistance level is around MA90; if it breaks, it could rise to around MA30. A rebound near this level can be used to sell. MACD shows increasing bullish momentum, forming a golden cross. The four-hour support level is around 109,700; if it breaks, it could drop to around 108,100. A pullback can be used to buy near this level. The resistance level is around MA120; if it breaks, it could rise to around 112,500. A rebound near this level can be used to sell. MACD shows decreasing bearish momentum.
ETH
Analysis
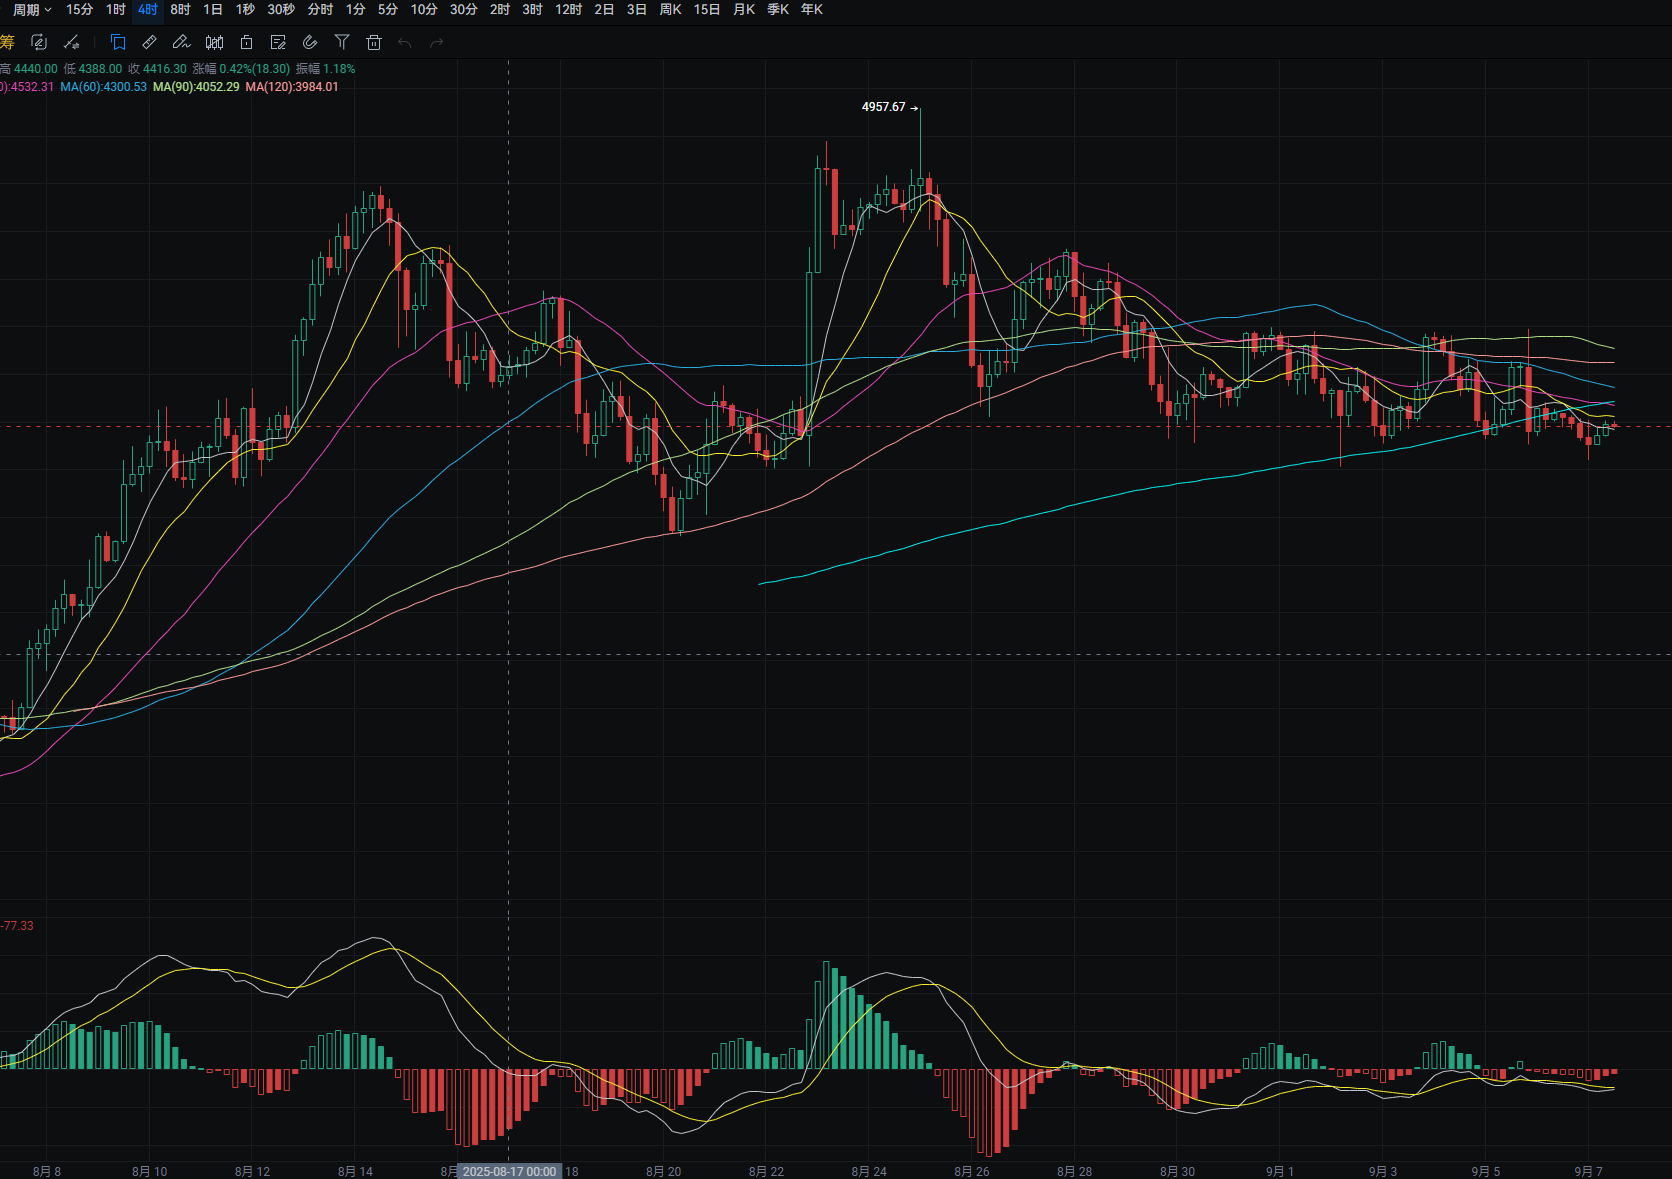
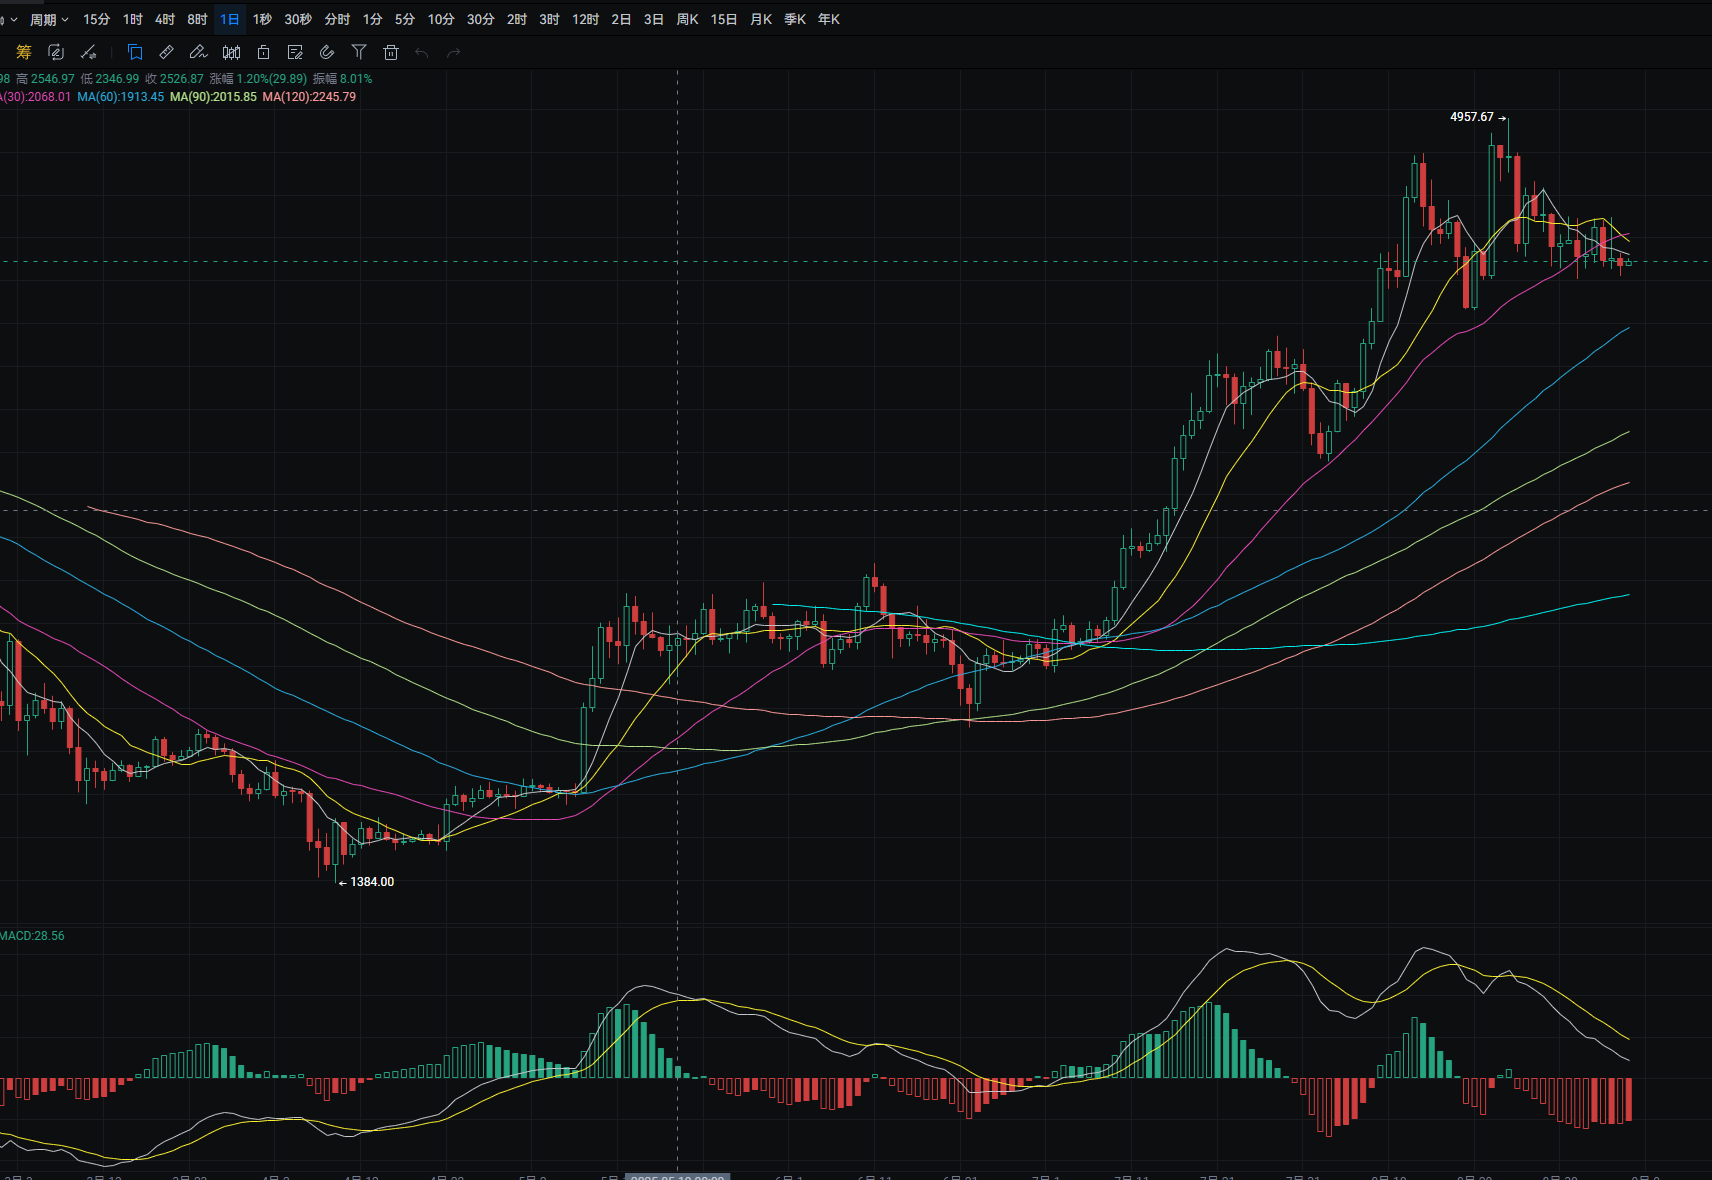
Ethereum's daily line fell from a high of around 4,325 to a low of around 4,220 yesterday, closing around 4,270. The support level is around 4,220; if it breaks, it could drop to around 4,070. A pullback can be used to buy near this level. The resistance level is around MA14; if it breaks, it could rise to around 4,485. A rebound near this level can be used to sell. MACD shows decreasing bearish momentum. The four-hour support level is around 4,225; if it breaks, it could drop to around 4,155. A pullback can be used to buy near this level. The resistance level is around MA30; if it breaks, it could rise to around MA120. A rebound near this level can be used to sell. MACD shows decreasing bearish momentum and signs of forming a golden cross.
Disclaimer: The above content is personal opinion and for reference only! It does not constitute specific operational advice and does not bear legal responsibility. Market conditions change rapidly, and the article has a certain lag; if you have any questions, feel free to consult.
免责声明:本文章仅代表作者个人观点,不代表本平台的立场和观点。本文章仅供信息分享,不构成对任何人的任何投资建议。用户与作者之间的任何争议,与本平台无关。如网页中刊载的文章或图片涉及侵权,请提供相关的权利证明和身份证明发送邮件到support@aicoin.com,本平台相关工作人员将会进行核查。


